http://dx.doi.org/10.4236/epe.2014.69021
How to cite this paper: Aoun, N., Chenni, R., Nahman, B. and Bouchouicha, K.(2014) Evaluation and Validation of Equiva-lent Five-Parameter Model Performance for Photovoltaic Panels Using Only Reference Data. Energy and Power Engineering, 6, 235-245. http://dx.doi.org/10.4236/epe.2014.69021
Evaluation and Validation of Equivalent
Five-Parameter Model Performance
for Photovoltaic Panels Using Only
Reference Data
Nouar Aoun1,2,3*, Rachid Chenni3, Boukheit Nahman1, Kada Bouchouicha2 1Department of Physics, Constantine 1 University, Constantine, Algeria
2Research Unit in Renewable Energies in the Saharan Medium, URER/MS, Development Centre of Renewable
Energies, Adrar, Algeria
3MoDERNa Laboratory, Constantine 1 University, Constantine, Algeria
Email: *[email protected]
Received 27 June 2014; revised 1 August 2014; accepted 14 August 2014
Copyright © 2014 by authors and Scientific Research Publishing Inc.
This work is licensed under the Creative Commons Attribution International License (CC BY).
http://creativecommons.org/licenses/by/4.0/
Abstract
This paper presents the modeling of electrical I-V verification of photovoltaic modules using five- parameter models based on the minimum usage of input data, which are usually provided by manufacturer’s datasheet. However, we vary them with a step of 10−4, the ideality factor γ
be-tween 0.0 and 4 for each iteration in order to choose the γ value, which gives a minimal relative error of the maximum power point. Moreover, when γ is known, the other four parameters (i.e.,
Rs, I0, Iph and Rsh) are known. Finally, the effectiveness of this approach is then validated through
comparison of the experimental results data under outdoor weather conditions.
Keywords
Photovoltaic, Five-Parameters, Mono-Crystalline, Relative Error, Ideality Factor
1. Introduction
Due to the fossil fuels consumption,the increase of energy demand and the negative effect of pollution on the en-vironment, the photovoltaic solar cell has become one of the promising green and renewable energy solutions. Ge-
nerally, the three import points (i.e., maximum power points, short circuit current and open-circuit voltage) are pro-vided on manufacturer datasheets under STC, i.e., 1000 W/m2, 25˚C and NOCT conditions, i.e., 800 W/m2, 47˚C.
For the modeling of (the) photovoltaic module, the use of equivalent circuits can be seen from the literature
[1]-[4]. Reference [5] proposed an equivalent circuit called three-diode model. The third diode is to present the
influence of the recombination of carrier and the leakage current. This model is more effective for the poly-sil- icon cells. The double exponential model [6]-[8] is the most accurate model, which contains seven unknown pa-rameters. In general, this model is more accurate for polycrystalline silicon cells [9].
To make the model easier to be solved, the equivalent circuit can be reduced to a circuit with a one-diode
[10]-[14]. In addition, one diode model can be divided into two categories. The first is called the four parameters
model [15] [16], where the shunt resistance is neglected and considered as infinite. The second is called the five parameters model [17]-[19], where the shunt resistance is considered as finite. A comparison of five different mathematical one-diode models was studied in detail in [20]. Reference [21] developed an empirical model to produce the current and voltage curve using five located points at the current-voltage curve. However, the me-thod needs empirically coefficients parameters which are typically not available from the manufacturers data-sheet. The coefficients are provided by the Sandia National Laboratory [22].
A modified electrical five-parameter-model is presented in the present work. The multi-crystalline PV module is studied by the model under real meteorological conditions in the desert climate.
2. The Equivalent Circuit of a Solar Cell
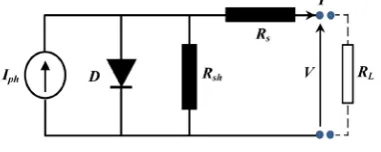
The five-parameter model is one of the famous photovoltaic models in the scientific world. Figure 1 shows the one diode equivalent circuit which contains of a current source
( )
Iph , a one diode (D), and series/parallel resis-tances (Rs and Rsh, respectively).The characteristic equation model is given by Equation (1).
(
)
0 exp 1
s s
ph
sh
q V IR V R I
I I I
kT R
γ
+ + = − − −
. (1)
where Iph is the photocurrent (A), I0 is the reverse saturation current (A), q is the electron’s charge (1.602 × 10⁻¹⁹˚C), γ the ideality factor, 23
1.38 10 J/K
k= × − is Boltzmann’s constant and T is the temperature of the –
p n junction (K), Rs the series resistance
( )
Ω and Rsh the shunt resistance( )
Ω .The five unknown parameters necessities to estimate before to solve Equation (1) are: γ, I0, Iph, Rs, and Rsh. The ideality factor value γ is indicative of the recombination mechanism, it has been observed in the c-Si cells. The increasing of solar radiation from 1.6 to 1.1 includes a decrease of the ideality factor in even range [23]. Moreover, at the three important manufacturer points at STC (i.e., short circuit, open circuit tension and maxi-mum power points), Equation (1) can be written as:
Short-circuit current: I=Isc, V =0
0 exp 1
s sc s sc
sc ph
sh
qR I R I
I I I
kT R
γ
= − − −
(2)
Open circuit tension: I=0, V =Voc
0
0 exp oc 1 oc
ph
sh
qV V
I I
kT R
γ
= − − −
(3)
Maximum power point: I=Ip, V =Vp
(
)
0 exp 1
p s p p s p
p ph
sh
q V R I V R I
I I I
kT R
γ
+ +
= − − −
(4)
Figure 1. One-diode equivalent circuit for a PV panel.
10−2, the ideality factor γ between 0 and 3, for each iteration, in order to choose its value which gives a mi-nimal relative error of the maximum power. Reference [24] used the following relationship, Equations (5)-(7) relating to the photo-current Iph, the saturation current I0, and shunt resistance Rsh.
(
)
1
det
ph oc sc oc p p sc
I = −⋅ V I A V I B V I C− − (5)
(
)
1
0 det oc sc oc p p sc
I = −⋅ V I −V I −V I (6)
(
)
1 1
det
sh sc p sc p
R− = −⋅I A−I B− I −I C (7)
where:
(
)
exp q Vp R Is p 1
A kT γ + = − (8)
exp qR Is sc 1
B
kT
γ
= −
(9)
exp qVoc 1
C
kT
γ
= −
(10)
and
(
)
(
)
(
)
det= Voc−R Is sc ⋅ + −A Voc+Vp+R Is p ⋅ + −B Vp+RsIsc−Ip ⋅C (11)
The derivative of the maximum power point as expressed in Equation (12):
( )
d d
0
d p p pd p
IV I
I V
V = − V = (12) The Equation (1) derivative compared to the tension can be expressed by:
(
)
1 10 d 1 exp d s s sh
q V R I
qI I
R
V γkT γkT R
− − + = − + + (13)
We introduce Equation (12) in (13), and then we define a s
R
f function given by:
(
)
0 exp(
)
1s
p s p
R p p s p
sh
q V R I
qI
f I V R I
kT kT R
γ γ + = − − + (14)
As I0 and Rsh are depending on Rs, the fRs function behaves so. For the series resistance Rs, we suppose that the initial value of the crystalline PV cells is given by the approximate function [25].
,ref ,ref ,ref ,ref ,ref
0 1 2 3 4
,ref ,ref ,ref ,ref ,ref
p p p p
oc s
sc sc oc oc sc
I V V I
V R
I α I V α V α I α
= + + +
(15)
5.411 6.45 3.417 4.422 α − = − (16)
We note that Equation (16) is independent of material properties of the solar cell [26].
3. Effect of Outdoor Condition on the Parameters
The unknown electrical parameters (i.e., Iph, I0, γ, Rs and Rsh), was measured under standard test condi-tion (1000 W/m2 and 25˚C) were rarely found in outdoor climate [27]. Moreover, the dependence of the para-meters on the real conditions is described in Equations (17)-(21) [27].
0 0,ref
ref ref
exp g g
c
c
E E
T q
I I
T k T T
γ γ = −
(17)
(
)
, ,ref
,ref
T
ph ph ref Isc c c
T
G
I I T T
G µ
= + − (18)
ref
n=n (19)
,ref
s s
R =R (20)
,ref ,ref T sh sh T G R R G
= (21)
where Eg is the band gap energy.
3.1. The Cell Temperature
To predict the performance of PV modules, it is necessary to know the PV cell temperature. In the literature, the modeling of PV cell temperature is obtained by several correlations mathematic models as a function of solar ir-radiance, ambient temperature and wind speed, etc., [28] [29]. Equation (22) is used to calculate the PV-cell temperature [30].
NOCT 20
0.8
c a T
T =T +G − (22)
NOCT is the Nominal Operating Cell Temperature which is estimated at 20˚C, 0.8 kW∙m−2 and 1 m∙s−1.
3.2. The Maximum Power Point Current and Voltage
At any operating condition the maximum power point current and voltage in Equations (23) and (24) can be ob-tained by iterative method, we used the instrument fsolve in MatLab [31].
(
)
0 exp 1
p p s p p s
p p
c sh
q V I R V I R
I I I
kT R γ + + = − − − (23)
(
)
(
)
0 0 1 exp 1 expp p s
s s
p
c c sh
p
p p s
c c sh
q V I R
qI R R
I
kT kT R
V
q V I R
qI
kT kT R
γ γ γ γ + + + = + + (24)
3.3. Short Circuit Current and Open Circuit Voltage
ref-erence values, can be obtained by simultaneously solving Equations (2) and (3), using fsolve in MatLab/Simu- link [22].
4. Outdoor Tested Photovoltaic Module
[image:5.595.193.438.419.570.2]To validate the five parameter model we used an experimental data extracted from specific desert climate envi-ronment. The outdoor exposure tests were started on March 21-23, 2013 within the Research Unit in Renewable Energies in the Saharan Medium, Adrar, Algeria. A mono-crystalline silicon solar cell, i.e., S-Energy SM- XXXMH1 Series PV module was experimentally selected to perform the characterization and modeling method,
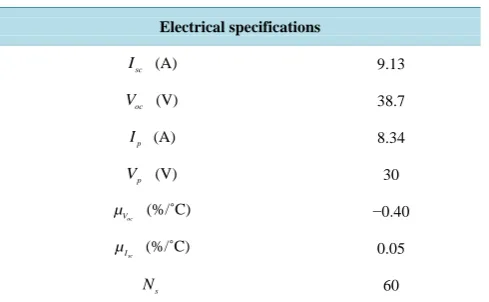
Table 1 shows the electrical specifications in the module reference conditions. Table 2 shows the electric
para-meters calculated by the proposed model.
The measurements of the I-V photovoltaic characteristics were performed with a data acquisition MP-160 I-V curve tracer and a CM11 type Kipp & Zonenpyranometer (last calibrate February 2011) was used to collect the measurements of meteorological radiation data.
Also, the MP-160 I-V curve tracer was used for determining the important points (i.e., Isc, Voc, Ip and p
V ) and for tracing the IV curves. The panel temperature was calculated using Equation (22).
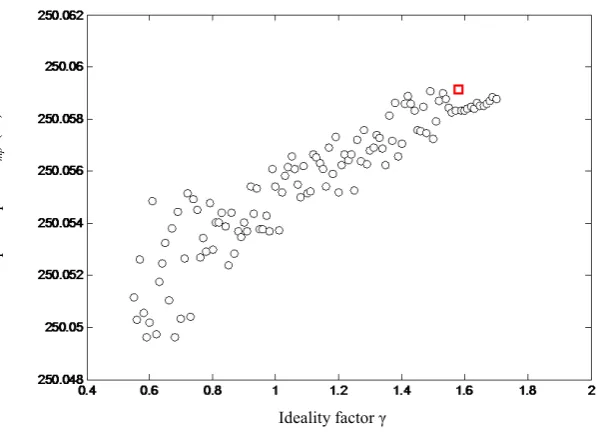
The maximum power point for a PV module and the relative error of maximum power point described by the model of this paper according to ideality factor, are illustrated in Figure 2 and Figure 3. The graph represented
in Figure 2, reveals that the value of γ =1.58 we give a maximum power almost equal to that of the
manu-facturer.
It is noted that the maximum power point of the PV modules studied in this article is calculated according to the manufacturer datasheet by producing the maximum power point current and voltage, i.e., P=Ip×Vp. This
appears clearly in Figure 3, where the relative error is very weak for a value γ which corresponds to 1.58. The manufacturer gives under the test standard conditions (1000 W/m2 with 25˚C) that the maximum power point equal to 250.2 W, and the simulation gives us Pp =250.151 W. However, the value of the maximum power relative error is 5.63%.
Table 1. The modules nominal electrical specifications.
Electrical specifications
sc
I (A) 9.13
oc
V (V) 38.7
p
I (A) 8.34
p
V (V) 30
oc
V
µ (%/˚C) −0.40
sc
I
µ (%/˚C) 0.05
s
[image:5.595.192.437.601.719.2]N 60
Table 2. Electrical parameters model for the selected PV module.
Electrical parameters
γ 1.58
ph
I (A) 9.1351
0
I (A) 1.1471e−6
s
R (Ω) 0.30989
p
Figure 2. Maximum power point Pmp for different accepted values of ideality factor at SRC.
Figure 3. Relative Error for Pmp for different accepted values of ideality factor γ at SRC.
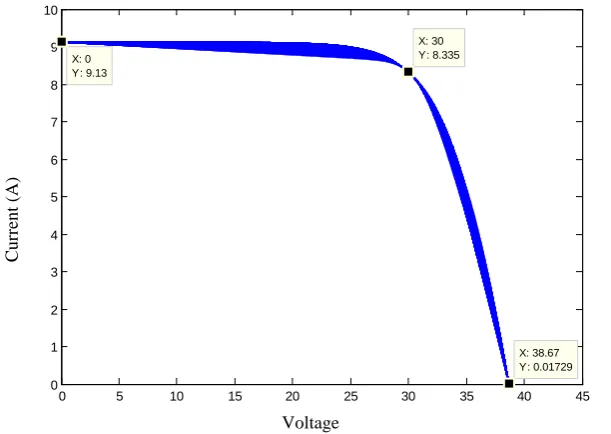
Figure 4 and Figure 5 indicate the current-voltage and power-voltage of all acceptable values of S-energy PV
panel at SRC. It is observed that the majority of the simulated values results are in very good agreement with the three important points: short circuit current, maximum power point and open circuit voltage.
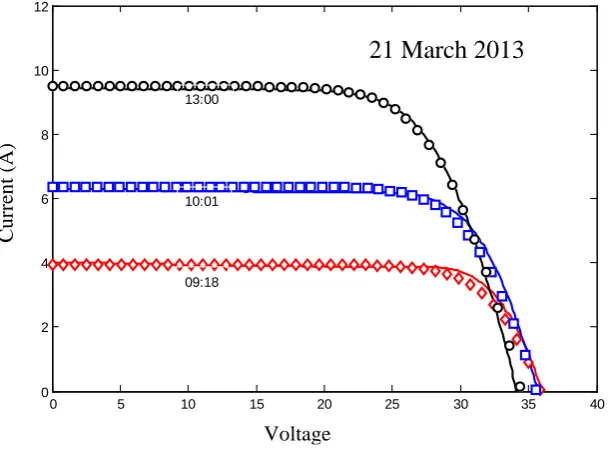
To verify also the model of this paper, it is necessary to observe the curves resulting from the five parameters under varied atmospheric conditions. However, Figure 6 and Figure 7 show the I-V and P-V characteristics of S-energy modules in outdoor conditions. Scattered points are the experimental results and solid line is the model results. It can be seen that the I-V and PV curves extracted with the method of this paper is on a good agreement at the current zone with experimental dataset. But at the zone of voltage and maximum power there is a differ-ence between experimental and calculated values. The differdiffer-ences between the experimental data and the calcu-lated values was occurred as a result of limitations in the cell model itself, as well as in the methods used to cal-culate cell temperature.
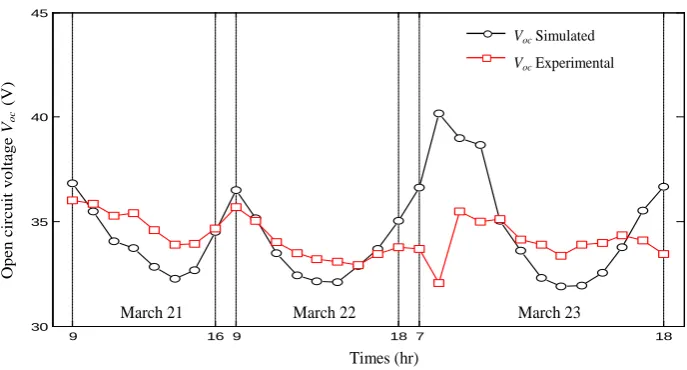
For the verification of the model at the three important points (i.e., Isc, Voc and Pp), Figure 8 to Figure
10 show the comparison between the simulated and experimental values of these points during the test days.
Ideality factor γ
M
a
x
imu
m
P
o
w
er P
mp
(
W)
M
ax
im
um
po
w
er
poi
n
t
Pmp
(W
)
Ideality factor γ
Ideality Factor γ
R
el
a
ti
v
e
E
rro
r P
mp
(%
)
R
el
at
iv
e er
ro
r @
Pmp
Figure 4. Current-Voltage curves at SRC at different values of ideality factor γ.
Figure 5. Power-Voltage curves at SRC for different values of ideality factor γ.
To compare the estimate results with the experimental measurements, the statistical parameters i.e., the root mean square error (RMSE) and the correlation coefficient
( )
2R are used. The values of root mean square error RMSE and the correlation coefficient R2 of maximum power point are respectively 11.0121 W and 0.9743. The correlation coefficient is greater than 0.97, a good agreement between the simulated and measured values is observed. However, the values of root mean square error RMSE and the correlation coefficient R2 of short circuit current are respectively 0.6802 A and 0.9743. A good agreement between the simulated and measured values is observed.
In Figure 10 we observe a remarkable deviation between simulated and experimental values. However, the
values of root mean square error RMSE and the correlation coefficient R2 of open circuit voltage are respec-tively 2.1746 V and 0.0677. By far, the open-circuit voltage point Voc is more temperature dependent than the short circuit current Isc [28]. From this, the disparity was also supposed to be mainly caused by the error esti-mate by the module temperature, which was theoretically measured.
0 5 10 15 20 25 30 35 40 45
0 1 2 3 4 5 6 7 8 9 10
X: 30 Y: 8.335
Voltage (V)
C
u
rre
n
t (A
)
X: 38.67 Y: 0.01729 X: 0
Y: 9.13
Voltage
C
u
rre
n
t
(A)
0 5 10 15 20 25 30 35 40
0 50 100 150 200 250 300
X: 30 Y: 250.1
Voltage (V)
P
o
w
e
r (W
)
Voltage (V)
P
o
we
r
(W
Figure 6. I-V characteristic curves (data from 21/03/2013).
Figure 7. P-V characteristic curves (data from 21/03/2013).
5. Conclusions
In this paper, the modeling of the photovoltaic five-parameter-model was proposed. This approach is based on datasheet parameters with a minimum of input information to find and calculate the parameters γ, I0, Iph,
s
R and Rsh at STC (25˚C, 1000 W/m 2
).
The model accuracy was also analyzed through comparison between experimental data and simulation results using mono-crystalline PV-panel in outdoor climate. The plot of I-V and P-V curves extracted by the method of this paper is in a good agreement at the current zone with experimental data, but in the voltage zone and the maximum power zone there is a difference between experimental data and the calculated value. To present the model accuracy more clearly, the maximum power point, short circuit current and open circuit voltage during the three test days were described and evaluated. The agreement between the theoretical estimates and the experi-
0 5 10 15 20 25 30 35 40
0 2 4 6 8 10 12
Voltage (V)
C
u
rre
n
t (A
)
13:00
10:01
09:18
21 March 2013
C
u
rre
n
t
(A)
Voltage
21 March 2013
0 5 10 15 20 25 30 35 40
0 50 100 150 200 250
Voltage(V)
P
o
w
e
r (W
)
13:00
10:01
09:18 21 March 2013
Voltage (V)
P
o
w
er (W
)
Figure 8. The simulated and experimental values of maximum power point during the three test days.
Figure 9. Simulated and experimental values of short-circuit current during the three test days.
Figure 10. The simulated and experimental values of open circuit voltage during the three test days.
9 16 9 18 7 18
0 50 100 150 200 250 300 350
Times (hr)
M
a
x
im
um
po
w
e
r poi
n
t
Pmp
(W
)
March 22 March 23
Pmp Simulated
Pmp Experimental
March 21
09 16 9 18 7 18
0 2 4 6 8 10 12 14
March 21 March 22 March 23
Times (hr)
S
ho
rt
-c
ir
c
u
it c
u
rr
e
n
t
Isc
(
A)
IscSimulated
IscExperimental
9 16 9 18 7 18
30 35 40 45
March 21 March 22 March 23
Times (hr)
O
p
e
n
c
ir
c
u
it
v
o
lta
g
e
Voc
(V)
Voc Simulated
[image:9.595.143.485.306.484.2] [image:9.595.141.485.509.694.2]mental data of the maximum power point and short circuit current is very good in the whole days. The root mean square error RMSEand the correlation coefficient
( )
R2 of the maximum power point and short circuit currentrespectively is 0.9743 and 0.9743, which is very satisfactory. By far, we observe a remarkable deviation between theoretical estimate values and experimental data of the open-circuit voltage point Voc. However, the values of root mean square error RMSE and the correlation coefficient R2 of open circuit voltage are 2.1746 V and 0.0677, respectively.
Acknowledgements
The authors express their gratitude to Mr. Draou Djamel and the team of solar field at the Research Unit in Re-newable Energies in the Saharan Medium (URER/MS) for providing the typical electrical parameters and the meteorological radiation data.
References
[1] Orioli, A. and Di Gangi, A. (2013) A Procedure to Calculate the Five-Parameter Model of Crystalline Silicon Photo-voltaic Modules on the Basis of the Tabular Performance Data. Applied Energy, 102, 1160-1177.
http://dx.doi.org/10.1016/j.apenergy.2012.06.036
[2] Ding, K., Zhang, J., Bian, X. and Xu, J. (2014) A Simplified Model for Photovoltaic Modules Based on Improved Translation Equations. Solar Energy, 101, 40-52. http://dx.doi.org/10.1016/j.solener.2013.12.016
[3] Karamirad, M., Omid, M., Alimardani, R., Mousazadeh, H. and Heidari, S.N. (2013) ANN Based Simulation and Ex-perimental Verification of Analytical Four- and Five-Parameters Models of PV Modules. Simulation Modelling Prac-tice and Theory, 34, 86-98. http://dx.doi.org/10.1016/j.simpat.2013.02.001
[4] Aoun, N., Chenni, R. and Bouchouicha, K. (2014) Experimental and Validation of Photovoltaic Solar Cell Perfor- mance Models in Desert Climate. Applied Mechanics and Materials, 492, 135-142.
http://dx.doi.org/10.4028/www.scientific.net/AMM.492.135
[5] Nishioka, K., Sakitani, N., Uraoka, Y. and Fuyuki, T. (2007) Analysis of Multicrystalline Silicon Solar Cells by Mod-ified 3-Diode Equivalent Circuit Model Taking Leakage Current through Periphery into Consideration. Solar Energy Material and Solar Cells, 91, 1222-1227. http://dx.doi.org/10.1016/j.solmat.2007.04.009
[6] Adamo, F., Attivissimo, F., Di Nisio, A. and Spadavecchia, M. (2011) Characterization and Testing of a Tool for Pho- tovoltaic Panel Modeling. IEEE Transactions on Instrumentation Measurement, 60, 1613-1622.
http://dx.doi.org/10.1109/TIM.2011.2105051
[7] Veissid, N., Bonnet, D. and Richter, H. (1995) Experimental Investigation of the Double Exponential of a Solar Cell under Illuminated Conditions: Considering the Instrumental Uncertainties in the Current, Voltage and Temperature Values. Solid State Electronics, 38, 1937-1943. http://dx.doi.org/10.1016/0038-1101(95)00017-N
[8] Chan, D.S.H. and Phang, J.C.H. (1987) Analytical Methods for the Extraction of Solar-Cell Single and Double-Diode Model Parameters from I-V Characteristics. IEEE Transaction on Electron Devices, 34, 286-293.
[9] Gow, J.A. and Manning, C.D. (1999) Development of a Photovoltaic Array Model for Use in Power-Electronics Si-mulation Studies. IEE Proceedings—Electric Power Applications, 146, 193-200.
http://dx.doi.org/10.1049/ip-epa:19990116
[10] Ma, T., Yang, H.X. and Lu, L. (2014) Development of a Model to Simulate the Performance Characteristics of Cry- stalline Silicon Photovoltaic Modules/Strings/Arrays. Solar Energy, 100, 31-41.
http://dx.doi.org/10.1016/j.solener.2013.12.003
[11] Villalva, M.G., Gazoli, J.R. and Filho, E.R. (2009) Comprehensive Approach to Modeling and Simulation of Photo-voltaic Arrays. IEEE Transactions on Power Electronics, 24, 1198-1208.
http://dx.doi.org/10.1109/TPEL.2009.2013862
[12] Boyd, M.T., Klein, S.A., Reindl, D.T. and Dougherty, B.P. (2011) Evaluation and Validation of Equivalent Circuit Photovoltaic Solar Cell Performance Models. Journal of Solar Energy Engineering, 133, Article ID: 021005.
http://dx.doi.org/10.1115/1.4003584
[13] Siddiqui, M.U., Arif, A.F.M., Bilton, A.M., Dubowsky, S. and Elshafei, M. (2013) An Improved Electric Circuit Mod-el for Photovoltaic Modules Based on Sensitivity Analysis. Solar Energy, 90, 29-42.
http://dx.doi.org/10.1016/j.solener.2012.12.021
[14] Tian, H., Mancilla-David, F., Ellis, K., Muljadi, E. and Jenkins, P. (2012) A Cell-to-Module-to-Array Detailed Model for Photovoltaic Panels. Solar Energy, 86, 2695-2706. http://dx.doi.org/10.1016/j.solener.2012.06.004
Energy, 32, 1724-1730. http://dx.doi.org/10.1016/j.energy.2006.12.006
[16] Walker, G. (2001) Evaluating MPPT Converter Topologies Using a Matlab PV Model. Journal of Electrical & Elec-tronics Engineering Australia, 21, 49-55.
[17] Lo Brano, V. and Ciulla, G. (2013) An Efficient Analytical Approach for Obtaining a Five Parameters Model of Pho-tovoltaic Modules Using Only Reference Data. Applied Energy, 111, 894-903.
http://dx.doi.org/10.1016/j.apenergy.2013.06.046
[18] Peng, L., Sun, Y. and Meng, Z. (2014) An Improved Model and Parameters Extraction for Photovoltaic Cells Using Only Three State Points at Standard Test Condition. Journal of Power Sources, 248, 621-631.
http://dx.doi.org/10.1016/j.jpowsour.2013.07.058
[19] Lo Brano, V., Orioli, A., Ciulla, G. and Di Gangi, A. (2010) An Improved Five-Parameter Model for Photovoltaic Modules. Solar Energy Materials & Solar Cells, 94, 1358-1370. http://dx.doi.org/10.1016/j.solmat.2010.04.003
[20] Ciulla, G., Lo Brano, V., Di Dio, V. and Cipriani, G. (2014) A Comparison of Different One-Diode Models for the Representation of I-V Characteristic of a PV Cell. Renewable and Sustainable Energy Reviews, 32, 684-696.
http://dx.doi.org/10.1016/j.rser.2014.01.027
[21] King, D., Boyson, W. and Kratochvill, J. (2004) Photovoltaic Array Performance Model. SAND2004-3535, Sandia National Laboratories, Albuquerque.
[22] De Soto, W., Klein, S.A. and Beckman, W.A. (2006) Improvement and Validation of a Model for Photovoltaic Array Performance. Solar Energy, 80, 78-88. http://dx.doi.org/10.1016/j.solener.2005.06.010
[23] de Blas, M.A., Torres, J.L., Prieto, E. and Garcı́a, A. (2002) Selecting a Suitable Model for Characterizing Photovoltaic Devices. Renewable Energy, 25, 371-380. http://dx.doi.org/10.1016/S0960-1481(01)00056-8
[24] Mustapha, B. (2006) Modélisation et Simulation d’un Système de Pompage Photovoltaïqu. Master’s Thesis, Oran University, Algeria.
[25] Wagner, A. (2000) Peak-Power and Internal Series Resistance Measurement under Natural Ambient Conditions. Pro-ceedings of EuroSun 2000,Copenhagen, 19-22 June 2000, 1-7.
[26] Benghanem, M. (2009) Low Cost Management for Photovoltaic Systems in Isolated Site with New IV Characterization Model Proposed. Energy Conversion and Management, 50, 748-755.
http://dx.doi.org/10.1016/j.enconman.2008.09.048
[27] Attivissimo, F., Adamo, F., Carullo, A., Lanzolla, A.M.L., Spertino, F. and Vallan, A. (2013) On the Performance of the Double-Diode Model in Estimating the Maximum Power Point for Different Photovoltaic Technologies. Measure- ment, 46, 3549-3559. http://dx.doi.org/10.1016/j.measurement.2013.06.032
[28] Skoplaki, E., Boudouvis, A.G. and Palyvos, J.A. (2008) A Simple Correlation for the Operating Temperature of Photo- voltaic Module of Arbitrary Mounting. Solar Energy Materials & Solar Cells, 92, 1393-1402.
http://dx.doi.org/10.1016/j.solmat.2008.05.016
[29] Topic, M., Brecl, K. and Sites, J. (2007) Effective Efficiency of PV Modules under Field Conditions. Progress in Pho- tovoltaics: Research and Applications, 15, 19-26. http://dx.doi.org/10.1002/pip.717
[30] Luque, A. and Hegedus, S. (2003) Handbook of Photovoltaic Science and Engineering. John Wiley & Sons Ltd., Chi- chester. http://dx.doi.org/10.1002/0470014008