R E S E A R C H A R T I C L E
Open Access
Why does the adverse effect of
inappropriate MRI for LBP vary by
geographic location? An exploratory
analysis
Mujahed Shraim
1*, Manuel Cifuentes
2, Joanna L. Willetts
3, Helen R. Marucci-Wellman
3and Glenn Pransky
4Abstract
Background:Early magnetic resonance imaging (eMRI) for nonspecific low back pain (LBP) not adherent to clinical guidelines is linked with prolonged work disability. Although the prevalence of eMRI for occupational LBP varies substantially among states, it is unknown whether the risk of prolonged disability associated with eMRI varies according to individual and area-level characteristics. The aim was to explore whether the known risk of increased length of disability (LOD) associated with eMRI scanning not adherent to guidelines for occupational LBP varies according to patient and area-level characteristics, and the potential reasons for any observed variations.
Methods:A retrospective cohort of 59,360 LBP cases from 49 states, filed between 2002 and 2008, and examined LOD as the outcome. LBP cases with at least 1 day of work disability were identified by reviewing indemnity service records and medical bills using a comprehensive list of codes from the International Classification of Diseases, Ninth Edition (ICD-9) indicating LBP or nonspecific back pain, excluding medically complicated cases.
Results:We found significant between-state variations in the negative impact of eMRI on LOD ranging from 3.4 days in Tennessee to 14.8 days in New Hampshire. Higher negative impact of eMRI on LOD was mainly associated with female gender, state workers’compensation (WC) policy not limiting initial treating provider choice, higher state orthopedic surgeon density, and lower state MRI facility density.
Conclusion:State WC policies regulating selection of healthcare provider and structural factors affecting quality of medical care modify the impact of eMRI not adherent to guidelines. Targeted healthcare and work disability prevention interventions may improve work disability outcomes in patients with occupational LBP.
Keywords:Cohort study, Low back pain, Work disability, Geographic variation in care, Magnetic resonance imaging
Background
Occupational Low back pain (LBP), defined as reported pain in the lumbar region as the primary reason for med-ical visit and registered as such (occupational origin) in the clinical records, is very common and accounts for a third of work-related soft and hard tissue musculoskeletal injuries and disorders leading to work absenteeism [1], and is the leading cause of years lived with disability globally [2]. Due to its use in Workers’Compensation, we
will refer to low back injury or disorder as an injury and by doing so will use the expression“injured workers.” Al-though the majority of workers (68%) with LBP resulting in work absence return to work within few weeks, a sig-nificant proportion of occupational LBP cases experience prolonged work disability [3], which is associated with higher risk of permanent disability [4]. As many persons affected by LBP are of working age, work disability is a key outcome in LBP. Prolonged work disability is associated with significant health and economic impacts, and is a pri-ority outcome in evaluation of treatment effectiveness [5].
Prior studies have shown that length of disability (LOD) due to occupational LBP is associated with
© The Author(s). 2019Open AccessThis article is distributed under the terms of the Creative Commons Attribution 4.0 International License (http://creativecommons.org/licenses/by/4.0/), which permits unrestricted use, distribution, and reproduction in any medium, provided you give appropriate credit to the original author(s) and the source, provide a link to the Creative Commons license, and indicate if changes were made. The Creative Commons Public Domain Dedication waiver (http://creativecommons.org/publicdomain/zero/1.0/) applies to the data made available in this article, unless otherwise stated. * Correspondence:[email protected]
1Department of Public Health, College of Health Sciences, QU Health, Qatar University, P.O.Box: 2713, Doha, Qatar
several factors. These include, individual characteristics (such as age, gender, tenure), physical demand of job and employer/work environment related characteristics [6, 7], regional factors such as state workers’ compensation (WC) policies [8] and residential area socioeconomic characteristics [9], and health care-related factors, primar-ily reflecting treatments that are inconsistent with accepted clinical guidelines. These include early opioid prescribing (within the first 15 days of seeking medical care), early magnetic resonance imaging (eMRI) scanning not adherent to evidence-based clinical guidelines (within the first 30 days of first registered medical visit for the current low back pain episode), prolonged or passive physical therapy, and other interventions not recom-mended by evidence-based clinical guidelines [10–13].
Clinical practice guidelines for acute nonspecific LBP recommend that, except for suspected serious underlying conditions (e.g. cancer and infection), MRI scanning should not be performed until at least a one-month period of standard medical therapies has occurred, and is only then indicated to evaluate pa-tients with persistent LBP and radiculopathy or spinal stenosis who may be candidates for surgery [10]. Des-pite these guidelines, inappropriate eMRI in patients with acute LBP is common, and is associated with prolonged disability, unnecessary subsequent interven-tions, and higher medical costs [14–16]. In addition, this practice has been resistant to various efforts to curtail it. However, whether its negative impact is the same across all cases is unknown. Some forms of in-effective or inappropriate care have differential im-pacts on different populations. For example, low back surgery is associated with worse disability outcomes for WC cases than non-WC cases [17]. Information on relative impact can be helpful to prioritize inter-ventions for groups who might be most adversely af-fected by a certain practice or risk factor, or regions where a risk factor has higher impact on outcomes. Although there are significant geographic variations in the prevalence of eMRI scanning for LBP [18, 19], whether the risk of increased LOD associated with
eMRI scanning for occupational LBP varies is
unknown.
The aim of this exploratory study was to examine whether the magnitude of increase in LOD associated with eMRI scanning for occupational LBP varies ac-cording to a range of different factors, as a way of identifying potentially susceptible subpopulations, and thus providing new information on effect modifica-tion, and guidance for prioritizing interventions to de-crease this practice. A large national database of injured workers provided a unique opportunity to examine individual, local and state factors that might affect susceptibility.
Methods
Study population
This was a retrospective cohort of LBP cases identified from the administrative database of a large WC private company, which accounts for about 10% of the WC coverage in the United States [20]. Workers compensa-tion is a no-fault, compulsory, employer-paid insurance system that provides coverage for medical care and a percentage of lost wages for workers who have an injury caused or substantially aggravated by work. Each State has a slightly different system, based on specific state laws. The insurer pays all bills for medical care regard-less of provider, so the record of medical care is quite complete. Medical bills are required to include diagno-ses, date and type of service, and provider.
The database includes comprehensive information about medical care and work disability compensation re-ceived by injuried workers. The distribution of occupa-tional injuries from the dataset is similar to other large national work injury databases [21], and our dataset has been used to conduct several national occupational re-search studies [15,22,23]. We included all LBP cases filed between 2002 and 2008 (inclusive), aged 18–65 years at first occupational LBP registered visit and received disabil-ity payment for at least 1 day. The New England Institu-tional Review Board approved the study.
Briefly, International Classification of Diseases, Ninth Edi-tion (ICD-9) codes referring to LBP or nonspecific back pain were used to identify uncomplicated LBP patients by review-ing the primary physician reported ICD-9 codes in medical bills for services during the first 15 days of seeking medical care (Additional file1: Table S1).These diagnoses are meant to describe the injury and any other relevant diagnoses. In prior investigations, we found that almost all of the relevant diagnoses were represented in these bills, which could each contain up to five different diagnoses. We looked at all diag-noses in the first 15 days, and included only those cases where LBP represented at least 66% of all musculoskeletal diagnoses (ICD 320–399, 710–739, and 800–999). The ma-jority of cases (89%) had 100% of their ICD-9 diagnoses representing low back pain. Complicated LBP cases with specific ICD-9 codes indicating severe injuries, multiple trauma, or significant non-injury diagnosis (e.g., cancer, autoimmune disease, or infection) were excluded.
Data and measures Outcome variable
claims with lump-sum settlements that often happen after a year of work disability duration [24].
Predictor variables
Individual-level variables We included individual-level variables that have been reported as significant predictors of LOD in patients with occupational LBP [8]. These in-clude age, sex, job tenure, average weekly wage, industry type, severity of LBP injury, lumbar spine surgery, early opioid prescribing (within 15 days of injury), eMRI, and WC claim litigation status. Operational definitions of these variables are described in detail elsewhere [8]. Briefly, early opioid prescribing was identified by review-ing medical bills, eMRI and lumbar spine surgery status were identified using Clinical Procedural Terminology codes [25]. eMRI was identified as a gap of 30 days or less between the date of first treatment for the low back injury and the date of the first lumbar MRI procedure. This was based on coexisting ICD-9 codes and Clinical Procedural Terminology codes reported in medical bills.
Neighborhood-level variables We included “neighbor-hood”inflation-adjusted median household income (MHI), quantified at census-tract level, which was found to be asso-ciated with LOD in cases with occupational LBP [9].
State-level variables We included several state-level variables found to be associated with healthcare utilization and work disability outcomes in patients with LBP and other conditions [26,27]. These included the annual state physician density per 100,000 population (2002–2008) [28] and state orthopedic surgeon density per 100,000 population. State orthopedic surgeon density was available only for 2004 and 2005 [29, 30]. Therefore, data on state orthopedic surgeon density from 2004 were used as an es-timated density for 2002–2004 and data from 2005 were used for 2005–2008. State MRI facility density per 100,000 population was another variable of interest. Prior studies have reported significant variation between states in eMRI for LBP, but it is not clear if MRI facility density is inde-pendently related to LOD. Other variables included were state annual unemployment rate and annual state WC policies on wage replacement and medical benefits (2002 to 2008), which are associated with LOD in patients with occupational LBP [8]. Neighborhood-level and state-level data were obtained from national and private data sources; see Additional file2: Table S2.
Data analysis
We used descriptive statistics to summarize included vari-ables. We used multivariable multilevel regression analysis to model our hierarchical data (LBP patients nested within different states) using the PROC MIXED function in SAS
9.2 [31]. The distribution of LOD was positively skewed. Therefore, the natural logarithm of LOD and log-linear models were used in analysis. Continuous predictor vari-ables were grand-mean centered. The majority of census tracts (96%) had less than five LBP cases. Therefore, neighborhood MHI was included in all analyses as individual-level variable to avoid less efficient estimate of variance parameters using small cluster sizes [32].
We followed a stepwise modelling approach to assess if the effect of eMRI scanning on LOD varies signifi-cantly between states and whether such variation is moderated by included individual and state-level predic-tors. Briefly, the first model (empty model) estimated mean LOD across all included states and estimated the amount of variability in LOD attributed to state-level factors using the intraclass correlation coefficient (ICC) [8,33]. Model 2 included all state-level variables to iden-tify independent predictors of LOD. Model 3 included statistically significant predictors of LOD from model 2 plus all individual level variables as fixed effects to iden-tify individual level predictors of LOD. Model 4 included all significant predictors of LOD identified in model 3 plus eMRI as random effect variable to assess if the inde-pendent effect of eMRI on LOD varied between states significantly. Model 5 included significant predictors from model 4 plus within and across-level interactions to examine if the effect of eMRI scanning on LOD was moderated by other individual and state-level variables.
Results
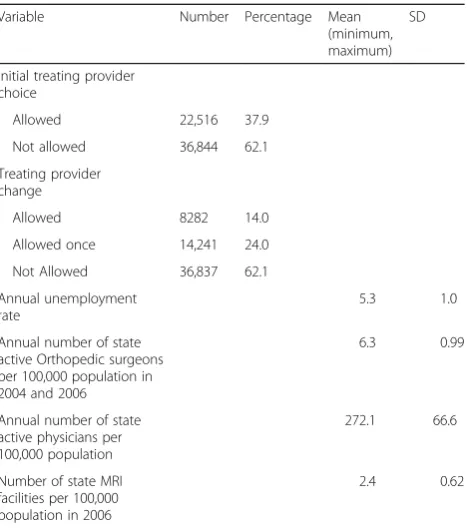
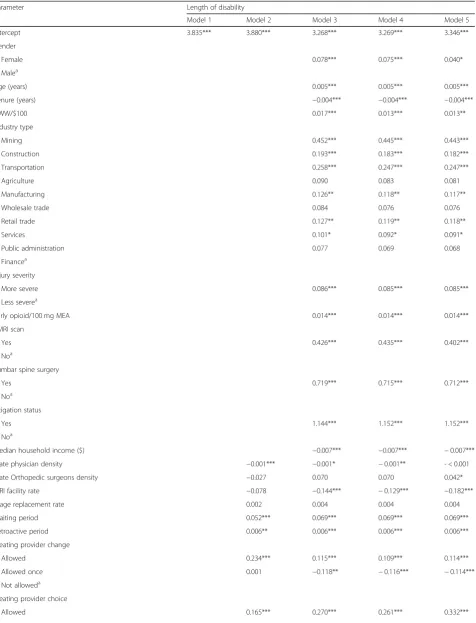
A total of 59,360 LBP claimants from 48 states and the District of Columbia were included. Two states (North Dakota and Wyoming) had very few LBP claims, and thus, were excluded. The average LOD (censored at 1 year) was 98 days (median = 43 days); more detailed sum-mary of distribution of LOD by state is given elsewhere [8]. About 69% of cases were men. The mean age and tenure of LBP claimants were 39.4 years (standard devi-ation (SD) = 10.8) and 5.8 years (SD = 7.7), respectively. A total of 17,555 cases (29.6%) received eMRI scanning for LBP. A summary of the cohort characteristics is given in Table 1. The estimated ICC showed that 5% of between-state variability in mean LOD is explained by state-level characteristics. As shown in Table 2 (model 5), state WC policy variables, state orthopaedic surgeons density, state MRI facility rate, and cross-level interac-tions with eMRI scanning explained 65% of between-state variability in mean LOD.
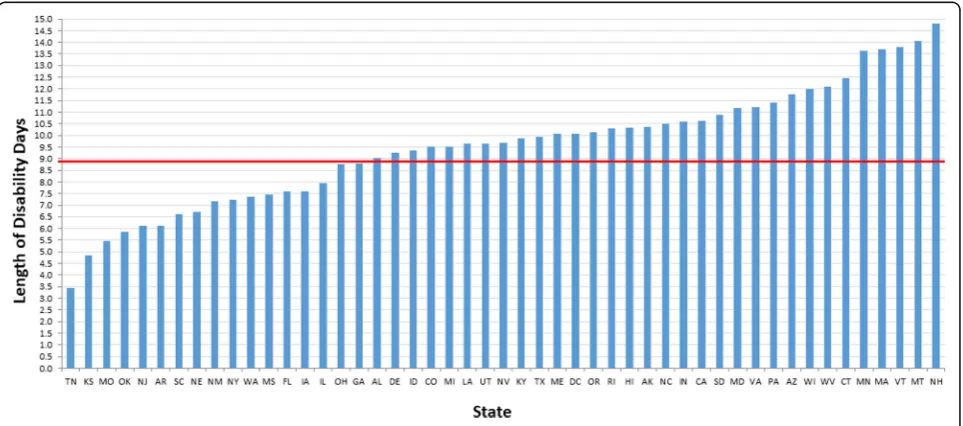
Geographic variation in impact of eMRI scanning on LOD
CI 8.5, 10.2), and this varied across states from 3.4 days in Tennessee to 14.8 days in New Hampshire (Fig.1).
Associations of state-level factors with LOD
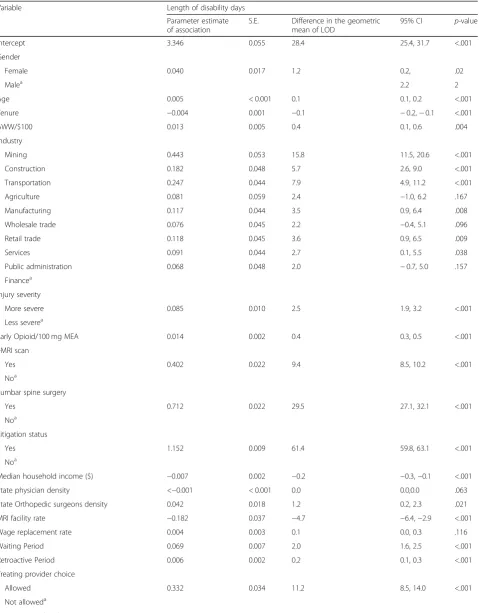
As shown in Tables2and3, after controlling for statisti-cally significant predictors and interactions, an increase in state orthopedic surgeon density by 1 surgeon for each 100,000 population was associated with an increase in mean LOD by 1.2 days (95% CI 0.2, 2.3). Additionally, an increase in the state MRI facility density per 100,000 population by 1 facility was associated with decrease in mean LOD by 4.7 days (95% CI 2.9, 6.4). There was no statically significant association between state physician density and LOD.
Within and cross-level interactions with effect of eMRI on LOD
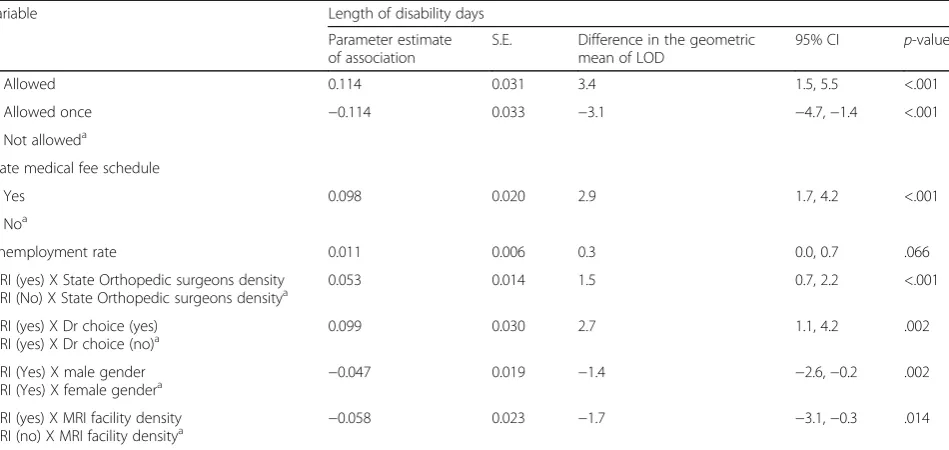
[image:4.595.306.540.108.373.2] [image:4.595.59.292.110.719.2]We found statistically significant interactions between gender and effect of eMRI on LOD; the negative effect of eMRI on mean LOD was higher by 1.4 days in females than males (95% CI 0.2, 2.6; see Table3). In addition, the negative effect of eMRI on mean LOD increased by 2.7 days (95% CI 1.1, 4.2) in LBP cases working in states that do not limit initial treating provider choice than those working in states that limit initial treating provider choice. Additionally, the effect of eMRI on mean LOD increased by 1.5 days (95% CI 0.7, 2.2) with an increase in state orthopedic surgeon density by 1 surgeon for each 100,000 Table 1Cohort characteristics according to individual and
state-level variables
Variable Number Percentage Mean (minimum, maximum)
SD
Gender
Female 18,352 30.9
Male 41,008 69.1
Age (years) 39.4 10.8
Tenure (years) 5.8 7.7
Average Weekly Wage ($) 403.0 187.5
Injury Severity
Less severe 47,805 80.5
More severe 11,555 19.5
Early opioid prescribing (MEA per 100 mg)
No 43,013 72.5
Yes 16,347 27.5 3.9 3.8
Early lumbar MRI scan
No 41,805 70.4
Yes 17,555 29.6
Lumbar spine surgery
No 53,869 90.7
Yes 5491 9.3
Industry type
Mining 1071 1.8
Construction 2087 3.5
Transportation, Communications, Electric, Gas, and Sanitary Services
16,305 27.5
Agriculture, Forestry, and Fishing
588 1.0
Manufacturing 10,887 18.3
Wholesale Trade 4515 7.6
Retail Trade 6626 11.2
Services 14,782 24.9
Public Administration 1990 3.4
Finance, Insurance, and Real Estate
509 0.9
Litigation status
Yes 19,182 32.3
No 40,178 67.7
Median household income ($K)
52.7 21,394
Wage replacement rate (%)
68 3
Waiting period (days) 5.3 1.9
Retroactive period (days) 15.7 7.0
State medical fee schedule
No 10,498 17.7
Yes 48,862 82.3
Table 1Cohort characteristics according to individual and state-level variables(Continued)
Variable Number Percentage Mean (minimum, maximum)
SD
Initial treating provider choice
Allowed 22,516 37.9
Not allowed 36,844 62.1
Treating provider change
Allowed 8282 14.0
Allowed once 14,241 24.0
Not Allowed 36,837 62.1
Annual unemployment rate
5.3 1.0
Annual number of state active Orthopedic surgeons per 100,000 population in 2004 and 2006
6.3 0.99
Annual number of state active physicians per 100,000 population
272.1 66.6
Number of state MRI facilities per 100,000 population in 2006
2.4 0.62
population. Finally, the effect of eMRI on mean LOD was lower by 1.7 days (95% CI 0.3, 3.1) with an increase in number of state MRI facility density by 1 facility for each 100,000 population. No other statistically significant inter-actions were observed between effect of eMRI on LOD and the remaining individual and state-level variables.
Discussion
To our knowledge, this is the first study to explore geo-graphic variation in the negative impact of eMRI for occu-pational LBP and factors associated with such variation. Findings from the study showed significant regional varia-tions in the negative impact of eMRI on LOD due to LBP after adjusting for between-state differences in individual-level, neighborhood-individual-level, and state-level characteristics associated with LOD in LBP patients. The observed varia-tions in the negative impact of eMRI on LOD were mainly explained by female gender, state WC policy not-limiting initial treating provider choice, higher state orthopedic surgeon density, and lower state MRI facility density.
The finding of more negative impact of eMRI on LOD in women can be explained by role and interpretation. For example, men might be more likely expected by their pro-viders to have back pain at work and recover, even with a relevant clinical abnormality. Common abnormalities seen on MRI, such as disc degeneration, disc protrusions, mild arthritis, and vertebral endplate changes, are often of un-certain clinical significance, and are frequently seen in asymptomatic persons [34, 35]. However, women may be more likely to have over-interpretation of abnormalities by doctors less used to seeing women in manual labor job roles [36]. Female injured workers are also more likely to have non-localized LBP, thereby a‘positive’MRI might be more likely to be over-interpreted, and this also could lead to prolonged disability [37].
State WC policy not limiting initial treating provider choice is associated with increased LOD [8]. There is some evidence that workers who choose their treating provider have longer disability duration than those treated by medical provider networks chosen by em-ployers [38,39]. Therefore, the negative impact of eMRI on LOD in the context of unlimited provider choice may mean that eMRIs are less justified and perhaps more often over-interpreted than those done by doctors with more occupational LBP experience.
The negative impact of eMRI on LOD in the context of higher state orthopedic surgeon density may be explained by more demand for patients or excess orthopedic surgical capacity, and thus more likely over-interpretation of sig-nificance of findings, which may result in more diagnostic labelling of patients, increasing the sick role, and unneces-sary interventions. For example, higher state orthopedic surgeon density has been independently linked to higher back surgery rates in workers with LBP [26].
The finding about the negative impact of eMRI on LOD with lower state MRI facility density may be ex-plained by variations in interpretation of eMRI findings and prevalence of interpretive errors, which might be as-sociated with type of equipment and imaging sequence used in MRI facilities, availability of fellowship-trained radiologists, and expertise in interpreting MRIs or nu-ances in reporting results in facilities performing a high number of scans [40,41].
This study adds an important contribution to current knowledge in occupational LBP by showing that an im-portant risk factor for adverse outcome (eMRI for LBP not adherent to evidence-based clinical guidelines) can vary in impact, and identifies the personal and local fac-tors associated with this variation. Understanding the basis of this variation in disability outcomes is key to focus ef-forts to improve healthcare and work disability outcomes for LBP patients. A unique strength of this study is that the observed associations were independent of several im-portant predictors of work disability in LBP, including individual-level variables (e.g. age, early opioid prescribing, back surgery, etc.), neighborhood MHI, and state-level characteristics (WC policies and annual unemployment rate) identified through current literature and our ex-planatory models. Another important strength is that our study included a large national sample of occupational LBP cases, filed over a period of 7 years in 49 states, which are representative of private industry workers. This sample has similar distribution of demographic characteristics re-ported in prior studies examining occupational LBP [42– 44], and national occupational datasets with respect to dis-tribution of occupational injuries and associated medical costs [21]. Additionally, our dataset has comprehensive in-formation on medical and indemnity services, which en-abled us identify LBP cases using a list of specific and standardized ICD-9 codes.
Currently, the mechanism linking the predictor eMRI with health and financial low back pain outcomes is not clear. Some potential reasons are that not following guide-lines with one procedure maybe a marker for similar pre-scribing process with further procedures. More dynamics interpretations point to affecting patients’decision process by feeding their concern and anxiety, which results in requesting from their providers treatments that are more intensive and in a speedy manner [45, 46]. All of this would cause patients who reinforce their idea of having a serious disease, pressured providers willing to prescribe procedures and sick-leave with the intention to assure pa-tients they are being taken care of. Further research is needed to clarify these mechanisms, which may shed light on potential plausible interventions to improve health out-comes in patients with LBP.
Table 2Parameter estimates from the five multilevel regression models examining the associations of LOD with individual-level and state-level variables
Parameter Length of disability
Model 1 Model 2 Model 3 Model 4 Model 5
Intercept 3.835*** 3.880*** 3.268*** 3.269*** 3.346***
Gender
Female 0.078*** 0.075*** 0.040*
Malea
Age (years) 0.005*** 0.005*** 0.005***
Tenure (years) −0.004*** −0.004*** −0.004***
AWW/$100 0.017*** 0.013*** 0.013**
Industry type
Mining 0.452*** 0.445*** 0.443***
Construction 0.193*** 0.183*** 0.182***
Transportation 0.258*** 0.247*** 0.247***
Agriculture 0.090 0.083 0.081
Manufacturing 0.126** 0.118** 0.117**
Wholesale trade 0.084 0.076 0.076
Retail trade 0.127** 0.119** 0.118**
Services 0.101* 0.092* 0.091*
Public administration 0.077 0.069 0.068
Financea
Injury severity
More severe 0.086*** 0.085*** 0.085***
Less severea
Early opioid/100 mg MEA 0.014*** 0.014*** 0.014***
eMRI scan
Yes 0.426*** 0.435*** 0.402***
Noa
Lumbar spine surgery
Yes 0.719*** 0.715*** 0.712***
Noa
Litigation status
Yes 1.144*** 1.152*** 1.152***
Noa
Median household income ($) −0.007*** −0.007*** −0.007***
State physician density −0.001*** −0.001* −0.001** - < 0.001
State Orthopedic surgeons density −0.027 0.070 0.070 0.042*
MRI facility rate −0.078 −0.144*** −0.129*** −0.182***
Wage replacement rate 0.002 0.004 0.004 0.004
Waiting period 0.052*** 0.069*** 0.069*** 0.069***
Retroactive period 0.006** 0.006*** 0.006*** 0.006***
Treating provider change
Allowed 0.234*** 0.115*** 0.109*** 0.114***
Allowed once 0.001 −0.118** −0.116*** −0.114***
Not alloweda
Treating provider choice
Table 2Parameter estimates from the five multilevel regression models examining the associations of LOD with individual-level and state-level variables(Continued)
Parameter Length of disability
Model 1 Model 2 Model 3 Model 4 Model 5
Not-alloweda
State medical fee schedule
Yes 0.057* 0.100*** 0.100*** 0.098***
Noa
Unemployment rate 0.024** 0.013* 0.012* 0.011
MRI (yes) X State Orthopedic surgeons density MRI (yes) X State Orthopedic surgeons density
0.053***
MRI (yes) X Dr choice (yes) MRI (yes) X Dr choice (no)
0.099**
MRI (Yes) X male gender
MRI (Yes) X female gender −
0.047**
MRI (yes) X MRI facility density
MRI (no) X MRI facility density −
0.058**
Variance components
Within-state variability 1.393*** 1.390*** 0.914*** 0.910*** 0.910***
Between-state variability 0.072*** 0.035*** 0.026*** 0.025*** 0.025***
ICC 5% 2% 3% 3% 3%
Proportional reduction in between-state variability 51% 64% 65% 65%
Random slope
eMRI 0.011** 0.011**
Model fit statistic
-2LL 188,306 188,221*** 163,485*** 163,323*** 163,320*
BIC 188,310 188,229*** 163,493*** 163,342*** 163,339*
AWWAverage weekly wage,MEAMorphine equivalent amount,eMRIEarly magnetic resonance imaging,ICCIntraclass correlation coefficient,−2LL−2 log likelihood ratio,BICBayesian information criterion
*Indicator of statistical significancep<. 05; **p<. 01; ***p<. 001 a
Indicator of reference group
[image:7.595.58.540.504.717.2]Table 3Adjusted associations between individual-level and state-level variables with length of disability estimated by multivariable multilevel regression (model 5)
Variable Length of disability days
Parameter estimate of association
S.E. Difference in the geometric mean of LOD
95% CI p-value
Intercept 3.346 0.055 28.4 25.4, 31.7 <.001
Gender
Female 0.040 0.017 1.2 0.2, .02
Malea 2.2 2
Age 0.005 < 0.001 0.1 0.1, 0.2 <.001
Tenure −0.004 0.001 −0.1 −0.2,−0.1 <.001
AWW/$100 0.013 0.005 0.4 0.1, 0.6 .004
Industry
Mining 0.443 0.053 15.8 11.5, 20.6 <.001
Construction 0.182 0.048 5.7 2.6, 9.0 <.001
Transportation 0.247 0.044 7.9 4.9, 11.2 <.001
Agriculture 0.081 0.059 2.4 −1.0, 6.2 .167
Manufacturing 0.117 0.044 3.5 0.9, 6.4 .008
Wholesale trade 0.076 0.045 2.2 −0.4, 5.1 .096
Retail trade 0.118 0.045 3.6 0.9, 6.5 .009
Services 0.091 0.044 2.7 0.1, 5.5 .038
Public administration 0.068 0.048 2.0 −0.7, 5.0 .157
Financea
Injury severity
More severe 0.085 0.010 2.5 1.9, 3.2 <.001
Less severea
Early Opioid/100 mg MEA 0.014 0.002 0.4 0.3, 0.5 <.001
eMRI scan
Yes 0.402 0.022 9.4 8.5, 10.2 <.001
Noa
Lumbar spine surgery
Yes 0.712 0.022 29.5 27.1, 32.1 <.001
Noa
Litigation status
Yes 1.152 0.009 61.4 59.8, 63.1 <.001
Noa
Median household income ($) −0.007 0.002 −0.2 −0.3,−0.1 <.001
State physician density <−0.001 < 0.001 0.0 0.0,0.0 .063
State Orthopedic surgeons density 0.042 0.018 1.2 0.2, 2.3 .021
MRI facility rate −0.182 0.037 −4.7 −6.4,−2.9 <.001
Wage replacement rate 0.004 0.003 0.1 0.0, 0.3 .116
Waiting Period 0.069 0.007 2.0 1.6, 2.5 <.001
Retroactive Period 0.006 0.002 0.2 0.1, 0.3 <.001
Treating provider choice
Allowed 0.332 0.034 11.2 8.5, 14.0 <.001
Not alloweda
termination of wage replacement benefits does not neces-sarily indicate recovery and return to work, which may underestimate LOD. Additionally, WC administrative data lack information about injury severity and level of func-tional disability. However, we accounted for low back in-jury severity (more severe, less severe) using a validated list of ICD-9 codes used in prior studies [8,9,47]. In the current study, low back injury severity was a significant predictor of LOD. Additionally, a longer period between the beginning of symptoms and the first visit may be rep-resent either or both, a mild pain that extends for a long period or a mild pain that gets worse. It is possible that some patients who received an eMRI had had a longer period with LBP and, therefore, met the criteria to have an MRI. The extent of this potential misclassification is un-known and it is more likely dilute the positive association between eMRI and LOD. The fact that the association stills persists indicates that it is stronger than it appears. However, we adjusted for injury severity using ICD-9 codes and it would have been good to have objective clin-ical indicators of severity, which is difficult given pain be-ing a subjective experience.
Another limitation is that we had no data on other sig-nificant predictors of work disability duration in occupa-tional LBP, such as worker recovery expectations and fear-avoidance, type of occupation, physical demand of the job, and supervisor support [6, 7, 43, 48]. However, such variables could influence our findings if their distri-bution differ significantly between states.
Conclusion
This study found significant cross-state variations in the negative impact of eMRI for occupational LBP on LOD and provided insights into individual and contextual fac-tors associated with these variations. These variations were mainly explained by gender, state WC policy not-limiting initial treating provider choice, higher state orthopedic surgeon density, and lower state MRI facility density. The results suggest that local area characteris-tics, such as state WC policies and availability of certain types of healthcare play an important role in disability outcomes among workers with occupational LBP who receive eMRI. Targeted healthcare and work disability prevention interventions may improve work disability outcomes in patients with occupational LBP.
Supplementary information
Supplementary informationaccompanies this paper athttps://doi.org/10. 1186/s12891-019-2964-7.
Additional file 1: Table S1.List of ICD-9 Codes for Low Back and Non-specific Back Injuries or Disorders with code description according to low back injury severity.
Additional file 2: Table S2.Sources of census tract level and state level variables, including variable name, level of measurement, source, and link when applicable.
Abbreviations
[image:9.595.63.538.110.335.2]BLS:Bureau of Labor Statistics; eMRI: Early magnetic resonance imaging; ICD-9: International Classification of Diseases, Ninth Edition; LBP: Low-back pain; Table 3Adjusted associations between individual-level and state-level variables with length of disability estimated by multivariable multilevel regression (model 5)(Continued)
Variable Length of disability days
Parameter estimate of association
S.E. Difference in the geometric mean of LOD
95% CI p-value
Allowed 0.114 0.031 3.4 1.5, 5.5 <.001
Allowed once −0.114 0.033 −3.1 −4.7,−1.4 <.001
Not alloweda
State medical fee schedule
Yes 0.098 0.020 2.9 1.7, 4.2 <.001
Noa
Unemployment rate 0.011 0.006 0.3 0.0, 0.7 .066
MRI (yes) X State Orthopedic surgeons density MRI (No) X State Orthopedic surgeons densitya
0.053 0.014 1.5 0.7, 2.2 <.001
MRI (yes) X Dr choice (yes)
MRI (yes) X Dr choice (no)a 0.099 0.030 2.7 1.1, 4.2 .002
MRI (Yes) X male gender MRI (Yes) X female gendera
−0.047 0.019 −1.4 −2.6,−0.2 .002
MRI (yes) X MRI facility density
MRI (no) X MRI facility densitya −0.058 0.023 −1.7 −3.1,−0.3 .014
S.E.Standard error of parameter estimate of association,CIConfidence intervals,LODLength of disability,AWWAverage weekly wage,eMRIEarly magnetic resonance imaging,MEAMorphine equivalent amount
a
LOD: Length of disability; MHI: Median household income; SAS: Statistical Analysis System; WC: Workers’compensation
Acknowledgements
The authors would like to thank YoonSun Choi for invaluable assistance with statistical analyses.
Authors’contributions
MS, MC and GP designed the study. MS conducted the study’s statistical analyses and MC, HRM-W, JLW, GP provided feedback. MS drafted the manu-script and all authors substantially contributed to its contents. All authors read and approved the final manuscript.
Funding
This study was funded by the Liberty Mutual Research Institute for Safety. The parent company, Liberty Mutual Insurance, had no role in the design and conduct of the study; collection, management, analysis, and
interpretation of the data; preparation, review, or approval of the manuscript; and decision to submit the manuscript for publication.
The publication of this article was funded by the Qatar National Library. The funder had no role in study design, data collection and analysis, decision to publish, or preparation of the manuscript.
Availability of data and materials
The datasets used and analysed during the current study are available from the corresponding author on reasonable request with permission of Liberty Mutual, with some restrictions to protect confidentiality of individual data as required by law.
Ethics approval and consent to participate
The New England Institutional Review Board reviewed and approved this study.
Consent for publication Not applicable.
Competing interests
The authors declare that they have no competing interests.
Author details
1
Department of Public Health, College of Health Sciences, QU Health, Qatar University, P.O.Box: 2713, Doha, Qatar.2Regis College, 235 Wellesley St, Weston, MA, USA.3Liberty Mutual Research Institute for Safety, Hopkinton, MA, USA.4University of Massachusetts Medical School, 55 N Lake Ave, Worcester, MA, USA.
Received: 25 April 2019 Accepted: 22 November 2019
References
1. U.S. Bureau of Labor Statistics. Nonfatal occupational injuries and illnesses requiring days away from work, 2013. Washington DC: Bureau of Labor Statistics; 2014.
2. Driscoll T, Jacklyn G, Orchard J, Passmore E, Vos T, Freedman G, et al. The global burden of occupationally related low back pain: estimates from the global burden of disease 2010 study. Ann Rheum Dis. 2014;73(6):975–81. 3. Wynne-Jones G, Cowen J, Jordan JL, Uthman O, Main CJ, Glozier N, et al.
Absence from work and return to work in people with back pain: a systematic review and meta-analysis. J Occup Environ Med. 2014;71(6):448–56. 4. Hashemi L, Webster BS, Clancy EA. Trends in disability duration and cost of
workers’compensation low back pain claims (1988-1996). J Occup Environ Med. 1998;40(12):1110–9.
5. Costa-Black KM, Loisel P, Anema JR, Pransky G. Back pain and work. Best Pract Res Clin Rheumatol. 2010;24(2):227–40.
6. Steenstra IA, Verbeek JH, Heymans MW, Bongers PM. Prognostic factors for duration of sick leave in patients sick listed with acute low back pain: a systematic review of the literature. J Occup Environ Med. 2005;62(12):851–60. 7. Shaw WS, Pransky G, Fitzgerald TE. Early prognosis for low back disability:
intervention strategies for health care providers. Disabil Rehabil. 2001;23(18): 815–28.
8. Shraim M, Cifuentes M, Willetts JL, Marucci-Wellman HR, Pransky G. Length of disability and medical costs in low back pain: do state workers’compensation policies make a difference? J Occup Environ Med. 2015;57(12):1275–83. 9. Shraim M, Cifuentes M, Willetts JL, Marucci-Wellman HR, Pransky G. Regional
socioeconomic disparities in outcomes for workers with low back pain in the United States. Am J Ind Med. 2017;60(5):472–83.
10. Chou R, Qaseem A, Snow V, Casey D, Cross JT, Shekelle P, et al. Diagnosis and treatment of low back pain: a joint clinical practice guideline from the American College of Physicians and the American Pain Society. Ann Intern Med. 2007;147(7):478–91.
11. American College of Radiology. ACR Appropriateness Criteria®.https:// acsearch.acr.org/list. Accessed 19 Nov 2019.
12. Bernstein IA, Malik Q, Carville S, Ward S. Low back pain and sciatica: summary of NICE guidance. BMJ. 2017;356:i6748.
13. Stochkendahl MJ, Kjaer P, Hartvigsen J, Kongsted A, Aaboe J, Andersen M, et al. National Clinical Guidelines for non-surgical treatment of patients with recent onset low back pain or lumbar radiculopathy. Eur Spine J. 2018;27(1):60–75. 14. Webster BS, Cifuentes M. Relationship of early magnetic resonance imaging
for work-related acute low back pain with disability and medical utilization outcomes. J Occup Environ Med. 2010;52(9):900–7.
15. Webster BS, Choi Y, Bauer AZ, Cifuentes M, Pransky G. The cascade of medical services and associated longitudinal costs due to nonadherent magnetic resonance imaging for low back pain. Spine (Phila Pa 1976). 2014;39(17):1433–40. 16. Mahmud MA, Webster BS, Courtney TK, Matz S, Tacci JA, Christiani DC.
Clinical management and the duration of disability for work-related low back pain. J Occup Environ Med. 2000;42(12):1178–87.
17. Atlas SJ, Tosteson TD, Blood EA, Skinner JS, Pransky GS, Weinstein JN. The impact of workers’compensation on outcomes of surgical and nonoperative therapy for patients with a lumbar disc herniation: SPORT. Spine (Phila Pa 1976). 2010;35(1):89–97.
18. Webster BS, Cifuentes M, Foley G, editors. Geographic variation of early magnetic resonance imaging in work-related low back pain. Compensation research group annual conference. Hopkinton: Workers Compensation Research Group; 2010.
19. Pransky G, Foley G, Cifuentes M, Webster BS. Geographic variation in early MRI for acute work-related low back pain and associated factors. Spine (Phila Pa 1976). 2015;40(21):1712–8.
20. Paduda J. Workers’comp rates are up, but still no profit.http://www.joepaduda. com/2013/06/workers-comp-rates-up-still-profit. Accessed 21 Nov 2019. 21. Murphy PL, Sorock GS, Courtney TK, Webster BS, Leamon TB. Injury and
illness in the American workplace: a comparison of data sources. Am J Ind Med. 1996;30(2):130–41.
22. Cifuentes M, Willetts J, Wasiak R. Health maintenance care in work-related low back pain and its association with disability recurrence. J Occup Environ Med. 2011;53(4):396–404.
23. Young AE, Cifuentes M, Wasiak R, Webster BS. Urban-rural differences in work disability following occupational injury: are they related to differences in healthcare utilization? J Occup Environ Med. 2009;51(2):204–12. 24. Hashemi L, Webster BS, Clancy EA, Volinn E. Length of disability and cost of
workers’compensation low back pain claims. J Occup Environ Med. 1997; 39(10):937–45.
25. American Medical A. Current procedural terminology (CPT). Chicago: American Medical Association; 2002.
26. Yee CA, Pizer S, Fomenko O. Why surgery rates vary. Cambridge: Workers Compensation Research Institute; 2015.
27. Wennberg JE, Freeman JL, Culp WJ. Are hospital services rationed in New Haven or over-utilised in Boston? Lancet. 1987;1(8543):1185–9. 28. Bureau. USC. Statistical Abstracts of the United States 2002–2008.http://
census.gov/library/publications/time-series/statistical_abstracts.html. Accessed 21 Nov 2019.
29. American Academy of Orthopaedic Surgeons. Orthopaedic practice and medical income in the US 2004–2005. Rosemont: American Academy of Orthopaedic Surgeons; 2005.
30. American Academy of Orthopaedic Surgeons. Orthopaedic practice in the US 2005–2006. Rosemont: American Academy of Orthopaedic Surgeons; 2006. 31. SAS Institute I. SAS/STAT® 9.2 user’guide. Cary: SAS Institute, Inc.; 2008. 32. Snijders TAB. Power and sample size in multilevel linear models. In: Everitt
BS, Howell DC, editors. Encyclopedia of statistics in beha’vioral science, vol. 3. Chicester: Wiley; 2005. p. 1570–3.
34. Endean A, Palmer KT, Coggon D. Potential of magnetic resonance imaging findings to refine case definition for mechanical low back pain in epidemiological studies: a systematic review. Spine (Phila Pa 1976). 2011; 36(2):160–9.
35. Steffens D, Hancock MJ, Maher CG, Williams C, Jensen TS, Latimer J. Does magnetic resonance imaging predict future low back pain? A systematic review. Eur J Pain. 2014;18(6):755–65.
36. Berecki-Gisolf J, Clay FJ, Collie A, McClure RJ. Predictors of sustained return to work after work-related injury or disease: insights from workers’ compensation claims records. J Occup Rehabil. 2012;22(3):283–91. 37. Coggon D, Ntani G, Walker-Bone K, Palmer KT, Felli VE, Harari R, et al.
Epidemiological differences between localised and non-localised low back pain. Spine (Phila Pa 1976). 2017;42(10):740–747.
38. Wickizer TM, Franklin G, Fulton-Kehoe D, Gluck J, Mootz R, Smith-Weller T, et al. Improving quality, preventing disability and reducing costs in workers’ compensation healthcare: a population-based intervention study. Med Care. 2011;49(12):1105–11.
39. Cheadle A, Wickizer TM, Franklin G, Cain K, Joesch J, Kyes K, et al. Evaluation of the Washington state workers’compensation managed care pilot project II: medical and disability costs. Med Care. 1999;37(10):982–93.
40. Herzog R, Elgort DR, Flanders AE, Moley PJ. Variability in diagnostic error rates of 10 MRI centers performing lumbar spine MRI examinations on the same patient within a 3-week period. Spine J. 2017;17(4):554–61. 41. Roland M, van Tulder M. Should radiologists change the way they report
plain radiography of the spine? Lancet. 1998;352(9123):229–30. 42. Krause N, Dasinger LK, Deegan LJ, Brand RJ, Rudolph L. Alternative
approaches for measuring duration of work disability after low back injury based on administrative workers’compensation data. Am J Ind Med. 1999; 35(6):604–18.
43. Shaw WS, Pransky G, Patterson W, Winters T. Early disability risk factors for low back pain assessed at outpatient occupational health clinics. Spine (Phila Pa 1976). 2005;30(5):572–80.
44. National Institute for Occupational Safety and Health. Worker health charterbook, 2004.https://www.cdc.gov/niosh/docs/2004-149/(2004). Accessed 21 Nov 2019.
45. Little P, Dorward M, Warner G, Stephens K, Senior J, Moore M. Importance of patient pressure and perceived pressure and perceived medical need for investigations, referral, and prescribing in primary care: nested observational study. BMJ. 2004;328(7437):444.
46. Campbell EG, Regan S, Gruen RL, Ferris TG, Rao SR, Cleary PD, et al. Professionalism in medicine: results of a national survey of physicians. Ann Intern Med. 2007;147(11):795–802.
47. Webster BS, Bauer AZ, Choi Y, Cifuentes M, Pransky GS. Iatrogenic consequences of early magnetic resonance imaging in acute, work-related, disabling low back pain. Spine (Phila Pa 1976). 2013;38(22):1939–46. 48. Steenstra IA, Busse JW, Tolusso D, Davilmar A, Lee H, Furlan AD, et al.
Predicting time on prolonged benefits for injured workers with acute back pain. J Occup Rehabil. 2015;25(2):267–278.
Publisher’s Note