2018 International Conference on Physics, Computing and Mathematical Modeling (PCMM 2018) ISBN: 978-1-60595-549-0
Study on the Runoff Simulation of Urban Rainstorm
Based on SCS Model
Si CHEN, Sheng-mei YANG
*and Kun MA
Changjiang River Scientific Research Institute, 23 Huangpu Road, Wuhan 430010, China
*Corresponding author
Keywords: Urban rainstorm, SCS model, Runoff simulation.
Abstract. Rainstorms have been frequently occurred and caused serious urban waterlogging disaster in China recent years. A runoff simulation method has been explored based on the rainfall intensity formula, as well as the combination of Chicago Rainfall Process Line Formula and SCS model in this paper. Because of its heavy rainstorm, Tangxunhulake basin in Wuhan was selected as the study area and to simulate the runoff process in different return periods. The results show that the cumulative runoff ranges from 22.3 to 45.3 million m3, and the net increased storage volume ranges from 10.02to 32.87 million m3; the return flow period of more than 20 years would affect the surrounding urban areas and cause damage to some extent. The proposed method of this study is simple and reliable, and can provide a great reference for the waterlogging calculation in urban areas.
Introduction
In recent years, as the global climate changes and the urbanization process accelerates, severe meteorological events especially the urban flood disaster have become increasingly serious. The spatial and temporal distribution of rainfall is more uneven [1]. Urbanization mainly influences the runoff processes. It changes the underlying surface conditions, increases the runoff coefficient and the runoff time. These factors would increase frequency and intensity of heavy rainfall events[2]. A lot of researches have been carried out domestically and internationally for urban flood disasters. At present, one-dimensional pipe network model—SWMM model and two-dimensional hydraulic model—MIKE model, LISFLOOD model, etc. are frequently used by researchers. They are possible to achieve accurate simulation of rainstorms under the premise of complete conditions. However, the quantity parameters and complicated calculation process make the practical application difficult [3,4]. With the matter above, this paper explored a method based on the SCS model to make analysis of urban storm runoff process in different return periods.
Study Area
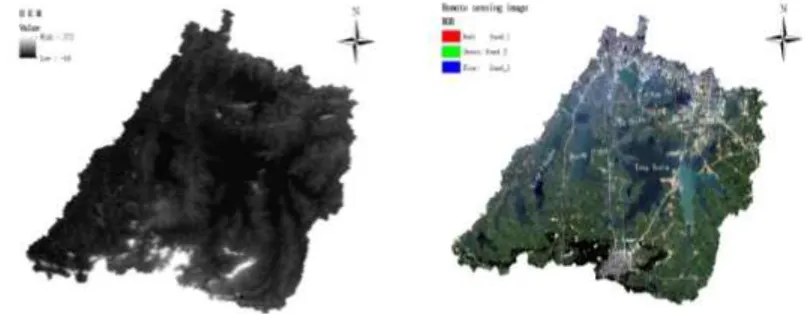
We select the Tangxunhulake basin as the study area. The catchment area is 457km2, located in the east of Wuhan City and surrounded by the Yangtze River embankment on the west. It belongs to the typical plain river network. Besides, the water system is crisscrossed and well developed. However, most of the ground elevations in the basin are lower than the water level of the Yangtze River in flood season, which makes it easy to cause flooding disasters. The research data mainly includes the watershed boundary data, digital elevation model (DEM), remote sensing image data and so on. The DEM and the corresponding data are shown in Fig. 1.
Method
Rainfall Intensity Simulation Curve
models conforms to the extreme value theory in the risky assessment research[5]. Therefore, we choose to design a rain model for the research. In 1957, Keifer and Chu put forward Chicago rainfall process line model based on the relationship of rainfall intensity, duration and frequency in the research of Chicago Pipeline Network[6]. In 1988, Guoping Ceng adopted a fuzzy identification method to study the Chicago rainfall process line. The analysis shows that the model is consistent with the characteristics of rainstorm in China. And it is applicable to any storm situation while the average rainfall intensity is different[7]. The storm intensity formula generally refers to the Water Supply and Drainage Design Manual, as shown in Eq. 1.
Figure 1. Study area of DEM and remote sensing image data of Tangxunhu Lake basin.
(1 lg ) ( )
n
A C p Q
b t (1) Where: Q is the rainfall intensity, L/s.hm2; A is the rainfall in different return periods, mm; Cis the variation parameters of rainfall; P is the rainfall return periods, a; t is the rainfall duration time, min; b and n are constant, which reflect the variation of design rainfall intensity with time. In the specific return period, the denominator is invariant, which is set as the constant a. The above equation can be simplified as Eq. 2.
( )
n
a i
b t (2)
The Chicago rainfall process model uses the rain-peak coefficient r(0<r<1) to describe the peak time of the rainstorm. The rain-peak coefficient divides the rainstorm into two parts: pre-peak and post-peak. After a proper transformation, the rainfall intensity at a certain moment could be obtained, see Eq. 3 and Eq. 4.
pre-peak: 1 (1 ) [ ] ( ) a b n b n t a b r i t b
r (3)
post-peak: 1 (1 ) [ ] 1 ( ) 1 a a n a n t a b r i t b
r (4)
Soil Conservation Service (SCS) model
scholars and researchers[8]. The basic principle of the SCS model is the relationship between the rainfall and runoff considers underlying surface conditions and the water balance equation. The Soil Conservation Bureau of the Ministry of Agriculture has analyzed the relationship between rainfall and runoff through a large amount of research data. The relationship is shown in Eq. 5.
( )
a
F R
S P I (5)
where P is the rainfall, mm;R is the runoff, mm; Ia is the initial loss of rainfall, mm; F is the late
loss of rainfall, mm; S is the maximum possible retention in the basin, mm.
In the process of runoff production, the empirical formula Ia 0.2S was introduced to the equation because of the difficulty in identifying the initial loss.In terms of the principle of water balance, the final relationship was obtained, see Eq. 6.
2
( 0.2 )
, 0.2 ( 0.8 )
P S
R P S
P S (6)
The maximum possible retention S in the basin is related to the curve number (CN). CN is a comprehensive parameter that reflects the characteristics of the basin before rainfall. It is connected with the degree of soil moisture, slope, vegetation, soil type, and land use in previous period[9]. According to the CN value matrix established in the study of Wuhan, the CN value of different types of land could be determined[10]. Based on the distribution of soil and soil types, the CN value could be obtained. The relationship between S and CN is shown in Eq. 7.
25400 254
S
CN (7)
Result and Discussion
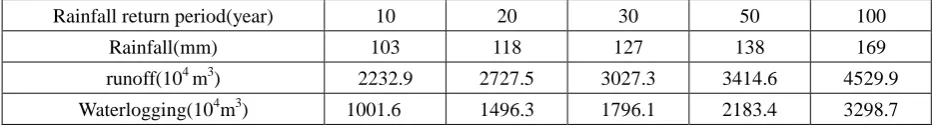
[image:3.595.109.494.613.776.2]The Chicago rainfall process model was used to obtain the rainfall intensity of 10, 20, 30, 50 and 100 years return periods. The rainfall intensity over time is shown in Fig. 2. It can be seen that the maximum rainfall intensity occurs at the middle moment during the entire rainfall process. At different return periods, the minimum rainfall intensity is close to 5mm/min and the maximum rainfall intensity is close to 8mm/min. They belong to heavy rain and extremely heavy rain separately. The rainfall amount during the different rainfall periods was obtained and the calculation results are shown in Table1. The supervised classification tool of ENVI was used to classify the soil type. We divided the soil types into six categories which consist of woodland, grassland, water area, towns, roads, and industrial and mining areas. The specific distribution of soil type is shown in Fig. 3. Based on the soil type classification results and the SCS runoff model, the runoff is calculated and the results are shown in Table 1.
Figure 3. Supervised Classification Based on Remote Sensing Images of Tangxunhu Lake Basin.
Table 1. Calculation of runoff during different rainfall periods.
Rainfall return period(year) 10 20 30 50 100
Rainfall(mm) 103 118 127 138 169
runoff(104 m3) 2232.9 2727.5 3027.3 3414.6 4529.9 Waterlogging(104m3) 1001.6 1496.3 1796.1 2183.4 3298.7
According to the rainfall intensity process line and the rainfall-runoff relationship model, the runoff range was calculated to be 22.3 to 45.3 million m3 in different return periods. Because of its special geographical location, the runoff could be pumped by pumping stations. The drainage pumping capacity of the only pump station at Tangxunhu Lake system is 142.5m3/s. Take this into consideration, the net increment in water storage volume ranges from 10.02 to 32.87 million m3. For small amount of waterlogging, if drainage is conducted and take diversion measures in time, waterlogging would subside. While heavy rain occurs, the lakes in the basin would reach at a relatively high water level. In such case, the efficiency of taking measure is not obvious. Slow drainage speed and long waterlogging time make it easy to submerge the surrounding urban areas and cause losses.
Conclusion
According to the SCS model and simulation results in the Tangxunhu lake basin, it can be concluded that the urban rainstorm runoff method based on the SCS model is rather simple and reliable. It could be widely used in other cities with serious waterlogging disaster. At the same time, the flow generation method based on the SCS model can provide reference value for the assessment of urban waterlogging disaster. In addition, there are numerous lakes in the Tangxunhu lake basin, the flood prevention and drainage could not be ignored. The method of the SCS model would be combined with other rainfall models to study the depth of submerge water in the future research.
Acknowledgement
[image:4.595.64.532.294.358.2]References
[1]A. Jha, Lamond J, Proverbs D, et al. Cities and Flooding: A guide to integrated urban flood risk management for the 21st Century[J]. Abhas Jha, 2013, 52(5):885-887.
[2]Boni SU, Hong Huang, Nan Zhang, Dynamic urban waterlogging risk assessment method based on scenario simulations [J]. J Tsinghua Univ (Sci & Technol), 2015, 55(6):684-690. (in Chinese)
[3]S. Jang, M. Cho, J. Yoon, et al. Using SWMM as a tool for hydrologic impact assessment[J]. Desalination, 2007, 212(1–3):344-356.
[4]D.S. Bisht, C. Chatterjee, Kalakoti S, et al, Modeling urban floods and drainage using SWMM and MIKE URBAN: a case study[J]. Natural Hazards, 2016, 84(2):1-28.
[5]J. Yazdi, S A. Neyshabouri, A Simulation-Based Optimization Model for Flood Management on a Watershed Scale[J]. Water Resources Management, 2012, 26(15):4569-4586.
[6]SCS. National Engineering Handbook [M]. USDA Soil Conservation Services. Washington, DC, 1971.
[7]P.A. Versini, E, Gaume, H, Andrieu, Application of a distributed hydrological model to the design of a road inundation warning system for flash flood prone areas.[J]. Natural Hazards & Earth System Sciences, 2010, 10(4):805-817.
[8]R.H. McCuen, A guide to hydrologic analysis using SCS methods [J]. A Guide to Hydrologic Analysis Using SCS Methods, 1982, 7(5):192.
[9]A.Akbari, A. Samah, F. Daryabor, Raster-based derivation of a flood runoff susceptibility map using the revised runoff curve number (CN) for the Kuantan watershed, Malaysia[J]. Environmental Earth Sciences, 2016, 75(20):1379.