2018 3rd International Conference on Computational Modeling, Simulation and Applied Mathematics (CMSAM 2018) ISBN: 978-1-60595-035-8
A Sleep Staging Method Using Multi-parameters
Xin-zui WANG
*, Tian-tian LV, Qian YU, Peng-fei JIA and Xiao CHEN
Suzhou Institute of Biomedical Engineering and Technology Chinese Academy of Sciences, Suzhou 215163, China
*Corresponding author
Keywords: EEG, ECG, Mean of RESP, DWT, Energy ratio, Sample entropy, SVM.
Abstract. Sleep staging is an important basis for the diagnosis of sleep disorders and other related diseases. An auto sleep staging method based on multi-parameter features fusion was proposed. First, using the Discrete Wavelet Transform (DWT) to filter the raw signals, obtain 8 features of sleep staging. Then the parameters of features were inputted to Support Vector Machine (SVM) for training and classification. Finally, using the cross-validation to model different samples for verifying the generalization ability. The results show that the accuracy of the method reach 93.08%, which is 9.39% higher than based EEG, and reached 85.25% with cross-validation, that indicated a better generalization ability.
Introduction
Currently, sleep disorders have been identified as a public risk disorder[1]. Sleep staging is an important gist of diagnose to study sleep disorders and related diseases. At present, many sleep staging methods have been proposed, these methods mainly extracted features of EEG by time domain and frequency domain, the nonlinear dynamic[2], and classified by using Artificial Neural Networks (ANN) or Support Vector Machine (SVM). However, with the increasing requirement for the accuracy of staging, the sleep staging method using EEG alone can no longer meet human needs, the researchers begin to explore the changing rules of sleep processes with other physiological signals[3].
This study aimed at the current sleep staging algorithm in the low accuracy, generalization ability and other shortcomings. A sleep staging algorithm based on multi-parameters features fusion was proposed. By extracting the features of EEG, EMG, ECG, Resp in the database of MIT – BIH, training and testing the parameters by using the SVM classifier. Then the three sleep staging methods of basing sleep EEG, sleep EEG and ECG, sleep multi-parameters were compared, in order to obtain the sleep staging method with more accurate and generalization ability.
Data Preprocessing
The MIT-BIH multi-channel sleep database was selected in this paper[4] . The sleep EEG, EMG, ECG, and Resp signals in this database were used as the original signals. A total of 16 subjects were recorded in this database, and the sample frequency of the data was 250Hz. In the 16 test objects, only slp32, slp41, slp45, slp48 testing individual contains the complete EEG, ECG, EMG (from jaw), Resp signal and sleep phase is complete. So selected samples of slp32, slp41, slp45, slp48 as experimental objects. All data was divided into sections per 30 seconds, and sleep staging is determined by experts according to the R&K standard, which is used to test the accuracy of the algorithm.
0 5 10 15 20 25 30 35 40 45 50 -1.0 0 1.0 Original EEG A m p/ V
0 5 10 15 20 25 30 35 40 45 50 -1.0 0 1.0 Filtered EEG A m p/ V
0 5 10 15 20 25 30 35 40 45 50 -1.0 0 1.0 Original EMG A m p/ V
0 5 10 15 20 25 30 35 40 45 50 -0.5 0 0.5 Filtered EMG A m p/ V
0 5 10 15 20 25 30 35 40 45 50 -1.0 0 1.0 Original ECG A m p/ V
0 5 10 15 20 25 30 35 40 45 50 -1.0 0 1.0 Filtered ECG A m p/ V
0 5 10 15 20 25 30 35 40 45 50 0 0.5 1.0 Original RESP A m p/ V
Number of data/*100
0 5 10 15 20 25 30 35 40 45 50 0 0.5 1.0 Filtered RESP A m p/ V
[image:2.595.106.485.74.207.2]Number of data/*100
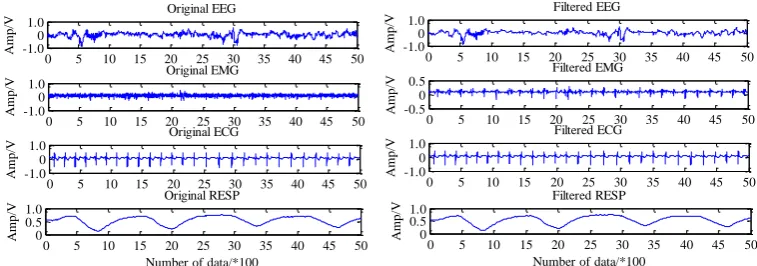
Figure 1. Denoising effect of EEG, EMG, ECG and Resp signals.
Feature Extraction and Classification Algorithm
Feature Extraction Algorithm
In this paper, a total of eight features were extracted from four physiological parameter signals, and the description of each signal feature was shown in table 1.
Table 1. Extract features summary table.
Signals EEG EMG ECG RESP
Feature type
Frequency domain Nonlinear feature
Frequency domain Nonlinear feature
Time Domain Feature
description
Energy ratio ,
, , Sample entropy e SampEn High frequency component energy
ratioh
Sample entropy c SampEn Mean r Mean
Mallat Decomposition Algorithm
Mallat decomposition algorithm is a fast algorithm for calculating wavelet transform. The algorithm, also known as tower algorithm, is decomposed by decomposition filters H and G.
Decomposition algorithm[5]:
0 1 1 2 2 i i k i i kA x( n ) x( n )
A x( n ) H ( n k )A x( n )
D x( n ) G( n k )D x( n )
(1)In the equation,x( n )is the original signal and i is decomposition layers,H and G is the wavelet decomposition filter,Ai is the approximate wavelet coefficient (low frequency)in the i-th layer, Di is the detailed wavelet coefficients (high frequency) in the i-th layer.
Characteristic Energy Ratio
The characteristic energy ratio is the ratio between the energy of the wavelet coefficient from the required layers and the energy of the wavelet coefficient from the total layers after decomposition.
Frequency range of alpha, beta, theta and delta waves is respectively 8~13Hz, 13~30 Hz,4~7 Hz, 1~4Hz. In this paper, we used “db3” wavelet base to decompose the EEG signals into 7-layer wavelet, where the third layer (D3) represented the beta waves, the fourth layer (D4) represented alpha waves, the fifth layer (D5) represented theta waves, the sixth(D6) and seventh (D7) layer represented delta waves. We calculated energy ratio between D3, D4, D5, D6 and D7 and 0~30 Hz, which got four frequency domain characteristics of EEG. There are respectively ,, and .
wavelet, which got wavelet coefficients from each layer that the first(D1) layer and second (D2) layer represent 30~125 Hz. The frequency domain features (h) were calculated by equation (2) and (3).
The Sample Entropy
sample entropy is defined as:
1 m
m N
B ( r ) SampEn( m,r ) ln
B ( r )
lim
(2)
when N is a finite value, sample entropy can be written as:
1
m m
SampEn( m,r ,N ) ln B ( r ) B ( r )
(3) To calculate sample entropy, m, r and N should be selected first, which m is the embedded dimension that is usually 1 or 2. R is the similar tolerance and the value is too large to lose a lot of detailed information. After extensive and analysis, the results are better when r= 0.2SD (SD is the standard deviation of the original data). In this study, r= 0.2SD is selected[6]. N is the data length, and it is concluded by experiments that N=1000 works well[6].
Support Vector Machine Classification Algorithm
The support vector machine (SVM) minimizes the empirical risk and confidence range by seeking the minimum structural risk and makes its classification more extensive. The basic idea of SVM is map data put into high-dimensional space, and then build the optimal classification hyperplane in the new space.
In this paper, radial basis kernel function is selected:
2
i i
K( x,x )exp( x x )
(4) 70% data was selected as training data, and the expert interpretation results in the database were taken as classification labels. And the training data and labels were input into the SVM classifier to obtain the classification model. The remaining 30% data was selected as testing data, the expert interpretation results in the database were taken as test labels. And the training data were input into the SVM classification model to get the classification results, compare classification results and the test labels, then, calculated the classification accuracy.
Experiments and Results
Feature Extraction Results
W N1 N2 N3 R 0 0.5 1.0 Sleep Stage S ampE n
W N1 N2 N3 R
0 0.5 1 Sleep Stage S ampE n
W N1 N2 N3 R
0 500 1000
Sleep Stage
AVE
W N1 N2 N3 R
0 0.5 1 α E ne rgy R at io
W N1 N2 N3 R
0 0.1 0.2 β E ne rgy R at io
W N1 N2 N3 R
0 0.2 0.4 θ E ne rgy R at io
W N1 N2 N3 R
0 0.5 1 δ E ne rgy R at io
W N1 N2 N3 R
[image:4.595.105.476.75.301.2]0 0.5 1 EMG E ne rgy R at io Sleep Stage
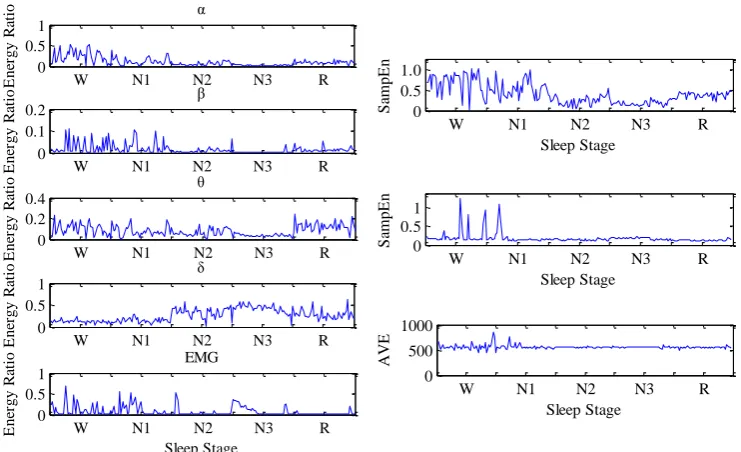
[image:4.595.76.514.351.445.2]Figure 2. The eight features of EEG, EMG, ECG and Resp signals. Table 2. The average of different features in each sleep stage. Features
Sleep Stage
h SampEne SampEnc Meanr
W 0.2228 0.0274 0.0963 0.1241 0.1140 1.3023 0.2675 5813.0 N1 0.1204 0.0272 0.0809 0.1514 0.0878 1.0757 0.1409 939.51 N2 0.0599 0.0097 0.0663 0.3356 0.0370 0.4795 0.1394 93.18 N3 0.0261 0.0027 0.0379 0.4216 0.0874 0.3451 0.1766 146.02
R 0.0950 0.0143 0.1260 0.2861 0.0102 0.7438 0.1299 256.33
The Classification Results
Extracted all night sleep data of slp32, slp41, slp45, slp48 samples, which is respectively 620 groups, 750 groups, 730 groups and 740 groups after eliminating the useless data. Obtained 2840 groups sample characteristics, of which 70% (1988) as the training sample were used to establish the SVM classification model, the remaining 30% (852) were used to test classification effect.
To verify the superiority of this method, three methods of comparative experiments were designed. Firstly, we used sleep classification method based on EEG. Then, we used sleep classification methods based on EEG and ECG. Lastly, we used sleep classification method based on multi-parameter feature fusion. The classification effect of the three methods is shown in table 3. Compared with sleep staging methods based on EEG, the improvement rate of the accuracy of the other two methods in each sleep stage is shown in table 4.
Table 3. Comparison of three different sleep staging methods.
Sleep Stage Training Samples Testing Samples
Comparison of three methods
EEG EEG,ECG Multi-parameters
Correct Accuracy Correct Accuracy Correct Accuracy
W 638 274 257 93.80 260 94.89 269 98.18
N1 378 162 105 64.81 109 67.28 140 86.42
N2 707 303 275 90.75 281 92.74 286 94.39
N3 125 53 37 69.81 35 66.04 43 81.13
R 140 60 39 65.00 41 68.33 55 91.67
[image:4.595.55.543.637.777.2]Table 4. The Increase rate of based on the EEG and ECG method and based on the multi-parameter method compared with based on the EEG sleep staging method.
Sleep Stage Methods
Increase rate /%
Total
W N1 N2 N3 R
EEG,ECG 1.09 2.47 1.99 -3.77 3.33 1.52
Multi-parameters 4.38 21.61 3.64 11.32 26.67 9.39
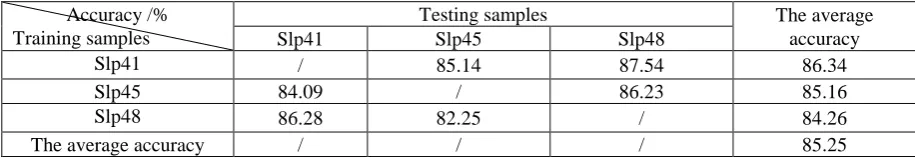
To verify the generalization ability of this method, cross-validation was used to train and test different samples. The sample slp32 has no REM period, it is easy to cause misjudgment, resulting in lower accuracy of test samples, so sample slp32 was excluded in this experiment. The experimental results are shown in table 5.
Table 5. The generalization ability test results of based on multi-parameter features fusion sleep staging method. Accuracy /%
Training samples
Testing samples The average
accuracy
Slp41 Slp45 Slp48
Slp41 / 85.14 87.54 86.34
Slp45 84.09 / 86.23 85.16
Slp48 86.28 82.25 / 84.26
The average accuracy / / / 85.25
In summary, the accuracy of sleep staging method based on EEG was 83.69%, that of sleep staging method based on EEG and ECG was 85.21%, that of sleep staging method based on the multi parameter accuracy was 93.08% in table 3. Therefore, the sleep staging method based on multi-parameter feature fusion designed in this paper can achieve a high accuracy of sleep staging.
It can be seen from table 3 and table 4 that the multi-parameter sleep staging method has great influence on sleep stages. Compared to sleep staging method based on EEG, the accuracy of sleep staging method based on EEG and ECG increased by 1.52%, the accuracy of sleep staging method based on multi parameter increased by 9.39%.
The generalization ability test results in table 5 shown that the cross-validation effect is ideal between different samples, and the average accuracy rate was 85.25%.
Conclusion
Sleep staging is the important objective indicators to study sleep disorders and related conditions. In order to improve the accuracy and generalization ability of sleep staging, in this paper, a method based on multi-parameter features fusion is proposed. The experimental results show that this sleep staging method based on EEG, ECG, EMG and respiratory signal fusion has obvious advantages in accuracy and generalization ability, significantly improves the accuracy of N1 and REM period compared to the method based on EEG sleep staging. This method can accurately complete sleep staging, meanwhile, it has certain generalization ability.
Acknowledgement
Fund project: Key national research and development program (No. 2017YFB0403802).
References
[1] Davies S K, Ang J E, Revell V L, et al. Effect of sleep deprivation on the human metabolome[J]. Proceedings of the National Academy of Sciences, 2014, 111(29): 10761-10766.
[image:5.595.68.526.253.332.2][3] Yang J,Yu M S, Wang H S, et al. A Non-EEG Approach to Sleep Analysis by Fusing Muti-Parameter Information[J].Chinese Journal of Biomedical Engineering, 2006, 25(3): 315-321.
[4] Goldberger Al, Amaral Lan, Glass L, et al. MIT-BIH Polysomnographic database. [DB/OL]. [2000-06-13]. http://circ. ahajournals.org/cgi/content/full/101/23/e215.
[5] Sun Y K, Wavelet Analysis and Application [M].Beijing: China Machine Press, 2005:10-40.