2019 International Conference on Computer Science, Communications and Multimedia Engineering (CSCME 2019) ISBN: 978-1-60595-650-3
Over-the-horizon Radar Impulsive Interference Detection with
Pseudo-MUSIC Algorithm
Tao LIU
*and Ruo-wei MEI
Electronic Engineering College, Chengdu University of Information Engineering, Chengdu, China
*Corresponding author
Keywords: Impulsive Interference, Interference detection, MUSIC, Over-the-horizon Radar.
Abstract. This paper studies a new method named pseudo-MUSIC to detect the impulsive interference (IMI) in the echo data measured by an over-the-horizon radar (OTHR). This is achieved by exploring the Doppler characteristics of the IMI and regarding the spectrum of IMI component as complex cosine signal. After simple clutter suppression for improving the signal-to-noise-ratio (SNR), the proposed pseudo-MUSIC algorithm can explicitly show the IMI-s by means of peaks over a nearly 0dB floor, so easily highlight the IMI-s positions. Experimental data are retrieved from the real OTHR radar system with high frequency surface wave (HFSW). The detection results verifies that the proposed method can figure out the IMI-s effectively. The pseudo-MUSIC algorithm innovatively features the detection on interference instead of target signal, which is rarely seen in other searches.
Introduction
OTHR, short for Over the horizon radar, is a kind of super-long-range alarming radar system, regularly operating in the band of 3-30MHz high frequency band. Besides, this type of radar uses linear frequency modulated continuous waveform (FMCW). It has an amazing capability of seeing beyond the line-of-sight or over the horizon area. This ability is achieved by ground-waves which are diffracted along the ground curvature, or by sky-waves that are refracted by the air ionosphere. The OTHR system can regularly cover area over 1000~3000km, and is broadly worked in ocean remote-sensing, marine ships surveillance, and aircrafts surveillance [1,2].
The high frequency (HF) Over-the-horizon radar usually operates in some very complicated environment containing such electromagnetic wave like clutters and the short-time interference with short duration named IMI. To be specific, the received signals are often integrated with strong ocean clutters. The ground clutter usually is shown as a narrow-band signal with Doppler frequency nearly to 0 Hz. So, ground clutter can be expressed as a constant in the echo signal. On the other hand, the ocean clutter is often expressed as two Bragg peaks corresponding to first-order scattering, and the surrounding continuum corresponding to high-order scattering. The two Bragg peaks often dominate the main components of the ocean clutter, because the amplitudes are usually two orders higher over the rest continuum [3]. More seriously, the OTHR is also subject to IMI-s which bring other strong noises featuring broad-band and high amplitude covering almost the entire range of Doppler spectrum. The common IMI noise can be made either man-made or by natural. There are three types of dominant IMIs. The first one is the echo signal of meteor trail mainly from the space or universe [2]. The second is the air lightning [4]. The third is the shortwave radio interference from human-being short-wave communication electromagnetic [3]. These IMI noises may be often 20~40dB higher over the thermal internal noise [5]. This decrease the radar sensitivity about 10dB, rendering it hard to track small targets for the OTHR [4].
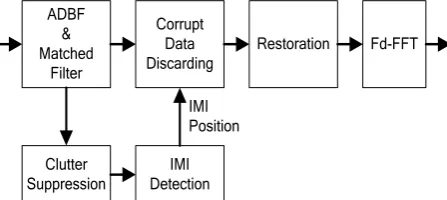
Filter”, the “IMI Detection” detects the IMI positions; the “Corrupt Data Discarding” deletes the corrupted data segments containing IMI-s; the “Restoration” restores the corrupted segments with linear prediction based on data from neighboring good data samples in order to keep the data continuity and coherency; finally the “Fd-FFT” extracts the Doppler information from the processed data.
ADBF & Matched
Filter
Corrupt Data Discarding
Restoration Fd-FFT
Clutter Suppression
IMI Detection
[image:2.595.185.409.141.241.2]IMI Position
Figure 1. Typical Block Diagram of IMI Detection and Suppression.
There are several temporal IMI suppression algorithms in existing literature. In [7] and [8], Huang (et al) and Xin (et al) proposed to utilize wavelet detection of singular value combing the amplitude thresholds to detect the IMIs respectively. Both algorithms can effectively detect the IMI-s but depend heavily on a complicated clutter pre-suppression which requires high computation cost. In [4], Barman (et al) described an IMI detection algorithm which only requires simple clutter pre-suppression. This goal is achieved by directly setting the Doppler shifts of the clutter to zero in the frequency-domain and transforming back to the time-domain with IFFT, among which the interference can be figured out by virtue of RMS threshold which is updated at each echo during the coherent-processing interval (CPI). Barnum’s method is especially simple for application. But this method utilizes an ideal filter of high-pass without transitional region, resulting in the long signal trails in the time domain. At last, if there is one IMI magnificently stronger than others, the long-extended trail from the former interference peak will nearly extend to the entire CPI. This phenomenon will submerge the spectrum peaks of other IMI-s, decreasing the probability of peaks measurement. This motivates us to explore alternatives to overcome the “long trail” problem in the Barman’s algorithm, while at the same time keep the advantage of simplicity such that only a simple “masking” process is required for the clutter pre-suppression.
Similar to the Barnum’s algorithm, we propose a new processing method. Firstly, we transform the echo signals to the Doppler or frequency domain by means of FFT, and then set the low-Doppler-shift section, corresponding to the ground and ocean clutters, to zero. Next, the IMI-s in the remaining spectrums are modeled as complex sinusoid signals, which can be measured by the Multiple Signal Classification (MUSIC) algorithm. This would produce a pseudo-spectrum in the original temporal domain which has sharp peaks for IMI positions and nearly 0dB floor for other amplitudes, making it very easy to determine the detection threshold. It is clear that, like the Barnum’s algorithm, the proposed method don’t need complex clutter suppression but an easy one in the frequency domain.
Unlike the traditional MUSIC algorithm which is widely used for spatial DOA or temporal target signal detection [10], here the MUSIC algorithm is applied in the frequency domain and thus termed as pseudo-MUSIC algorithm in this paper. It is interesting to point out that, while the MUSIC algorithm works well in high SNR environment, it has poor performance in presence of strong clutters or/and impulsive noises. Therefore, the MUSIC algorithm is normally not used for the purpose of target detection for OTHR. Besides, in the pseudo-MUSIC algorithm, with the MUSIC being applied in the frequency domain, the IMI-s can be detected like traditional targets such as the aircrafts. This actually describes a new application for target classification algorithms such as the MUSIC.
Signal Model
Suppose that in a CPI, OTHR sents out a batch of P coherent pulses. Suppose that OTHR array antenna has N elements, corresponding to N receiving channels. For each channel, the receiving echo is disposed successively by amplification, A/D sampling, and pulse compression. The antenna digital beam is pointing to a batch of directions which can survey the interest area. Among one digital beam, the N-channel data are arranged to 𝑃 × 𝐿 complex samples, making a so-called range-sweep matrix with P rows and L columns. L is the count of range cells, and P is the count of range sweeps inside a CPI. Each column with P-sample corresponds to a determined distance. Next, the coherent integration operation is processed on each column. Thus range-Doppler matrix is derived from the range-sweep matrix. For each element in the matrix, a threshold decision method is performed. In the range-Doppler matrix, if a detection is made in a certain matrix cell, the target can be detected at the direction corresponding to the steering direction [3].
A P-element vector of scalar samples in one azimuth-range bin inside a CPI is expressed as
𝑟(𝑡) = 𝑠(𝑡) + 𝑐(𝑡) + 𝑖(𝑡) + 𝑤(𝑡) 𝑡 = 0, ⋯ , 𝑃 − 1 (1) where 𝑠(𝑡) is the target signal, 𝑖(𝑡) the impulsive interference from external, 𝑐(𝑡) the ocean clutter and ground clutter, 𝑤(𝑡) the internal-noise which is regarded as spatially and temporally white.
An ideal target, with the radial velocity and the constant reflectivity inside one CPI can be expressed mathematically as a complex cosine signal 𝑠(𝑡) = 𝐴𝑠𝑒𝑗𝜔𝑑𝑡, where 𝜔
𝑑 = 2𝜋𝑓𝑑 is the
target’s Doppler-shift frequency.
The main spectrum components in ocean clutter are the first-order Bragg peaks, which are express by two complex cosine signals [3]. Besides, the ground clutter has a spectrum component, featuring very strong but close to nearly zero-Hertz. The ground clutter can be expressed as a complex number. At last, the clutter 𝑐(𝑛) is expressed as
𝑐(𝑡) = 𝑐𝑎𝑒𝑗(𝜔𝑐+𝜔𝐵)𝑡+ 𝑐
𝑟𝑒𝑗(𝜔𝑐−𝜔𝐵)𝑡+ 𝑐𝑔 (2)
where 𝜔𝐵 = 2𝜋𝑓𝐵 is the Bragg frequency, 𝜔𝑐 = 2𝜋𝑓𝑐 the Doppler shift indicating the ocean-currency speed, 𝑐𝑔 the ground clutter amplitude, 𝑐𝑎and 𝑐𝑟 the advance and recede first-order clutter amplitudes, respectively. Considering the ocean-currency radial speed is low and alters slowly over time, the Doppler shift 𝜔𝑐 is much lower than the Bragg frequency. So 𝜔𝑐 can be considered as nearly fixed among the whole CPI.
The impulsive interference from external is often modeled as an impulse. Because our main concern is to figure out the position of the impulsive interference, it is expressed by a Dirac function
𝛿(𝑡 − 𝑡0) with amplitude 𝐴𝑖 and position 𝑡0. Position is our main concern. With above analysis, the echo sample can be rewritten as
𝒓(𝒕) = 𝒄𝒂𝒆𝒋(𝝎𝒄+𝝎𝑩)𝒕+ 𝒄
𝒓𝒆𝒋(𝝎𝒄−𝝎𝑩)𝒕+ 𝒄𝒈+ 𝑨𝑺𝒆𝒋𝝎𝒅𝒕+ 𝑨𝒍𝜹(𝒕 − 𝒕𝟎) + 𝒘(𝒕)
Pseudo-MUSIC Algorithm
Pseudo-target and Pseudo-noise
The resolution to the interference detection in (3) is to identify whether there exists𝛿( ) impulse and to estimate parameter 𝑡0. The echo spectrum in (3) can be rewritten as
𝑅(𝑤) = 𝑐𝑎𝛿(𝜔 − 𝜔𝑐− 𝜔𝐵) + 𝑐𝑟𝛿(𝜔 − 𝜔𝑐 + 𝜔𝐵) +
𝑐𝑔𝛿(𝜔) + 𝛿(𝜔 − 𝜔𝑑) + 𝐴𝑖𝑒𝑗𝑤𝑡0 + 𝑤(𝜔) (4)
where 𝑐𝑎𝛿(𝜔 − 𝜔𝑐 − 𝜔𝐵) + 𝑐𝑟𝛿(𝜔 − 𝜔𝑐 + 𝜔𝐵) is the spectrum of ocean clutter, 𝑐𝑔𝛿(𝜔) the ground clutter spectrum, 𝛿(𝜔 − 𝜔𝑑) target signal spectrum,𝐴𝑖𝑒𝑗𝜔𝑡0 the external IMI spectrum,
With variables substitution𝜔 → 𝑡′, 𝑡 → 𝜔′, Eq.(5) can be rewritten as
𝑅(𝑡′) = 𝑐
𝑎𝛿(𝑡′− 𝑡𝑐′− 𝑡𝐵′) + 𝐶𝑟𝛿(𝑡′− 𝑡𝑐′ + 𝑡′) + 𝑐𝑔𝛿(𝑡′) + 𝛿(𝑡′− 𝑡𝑑′) + 𝐴𝑙𝑒𝑗𝜔0
′𝑡′
+ 𝑊(𝑡′) (5)
Eq. (4) is totally equivalent to (5) except that the variable symbol representation is a little different. Signal components in (5) can be considered as being for a new or generalized time domain. The noise component 𝑊(𝑡′) is dim and nearly fixed over the entire so-called time domain. Components with 𝛿( ) representation are all regarded as noises in the "time domain", named pseudo-noise. The complex cosine signal 𝐴𝑖𝑒𝑗𝜔0′𝑡′ is the "interest target signal of", called pseudo-target with
"frequency" 𝜔0′. Its measurement and parameter estimation is a common multi-signal-separation problem, and can be resolved by traditional MUSIC algorithm. In the case of more than one impulsive interference, (5) can be expressed as a sum of complex cosine parts ∑ 𝐴𝑖𝑘𝑒𝑗𝜔𝑘
′𝑛′
𝑘 with
distinct frequency 𝜔𝑘′. This still meets the requirements of MUSIC algorithm and can work perfectly. Actually, the MUSIC algorithm in the so-called "time domain" is applied in the frequency domain or Doppler domain. The MUSIC pseudo-spectrum is on the original time-domain. The pseudo-spectrum peaks give out the IMIs position.
Next, we define the pseudo signal-to-noise-ratio as 𝑆𝑁𝑅′= 𝑆′/𝑁′, where 𝑆′ is the pseudo-target power, 𝑁′ the rest components power in (5). If the 𝑆𝑁𝑅′ reaches high enough, the MUSIC method has two groups of eigenvalues separated obviously, which declares the existence of IMI. Searching for the pseudo-spectrum peaks can give out the parameter estimation of 𝜔0′, namely 𝑡0.
Clutter Suppression
In practice, the power for 𝑁′ is usually higher than that for 𝑆′ because of the energy of clutter which is greatly higher than IMI. This renders the 𝑆𝑁𝑅′ lower, and the MUSIC algorithm fails finding targets. An direct and simple resolution is to suppress the clutters before the pseudo-spectrum calculation.
Typical clutter-suppression methods with better effect often have higher computation cost. For instance, [9] describes an iteration-cancellation method. At every iteration, the highest remaining Doppler peak is modeled as a sinusoid and subtracted later. [8] described a method based on generalized moving target indicator (MTI) filter or subspace projection, featuring a defect of eigen decomposition for large-sized covariance matrix. Khan [11] proposed a method based on the Hankel rank reduction which needs multiple large-size matrix processing such as singular value decomposition and least square fitting.
From the clutter features shown in (2), we use a very simple clutter-suppression algorithm. The Doppler cells between −2𝑓𝐵 ∼ +2𝑓𝐵 are directly set to zero to get rid of the main clutter energy, including those from the first-order ocean clutters and the ground clutter. The remaining high-order ocean clutters with lower energy will bring less influence on the MUSIC detection performance. This masking operation is like the one in [4], except that different number of Doppler cells are masked. Although this type of simple mask method may also lead to longer temporal trail just as described in Section 1, this imposes little impact on the final detection results according to the experimental results.
Detection Algorithm Steps
The detection algorithm steps is listed as below:
1) Supposing a range cell have P samples, convert them to the frequency domain. 2) Mask the clutter cells, or set them to zero.
3) Make the Hankel matrix where 𝑁 ≫ 𝑆
𝑨 = [𝑿𝒌, 𝑿𝒌+𝟏, … 𝑿𝒌+𝒔−𝟏]
𝑿𝒌= [𝑥(𝑘), 𝑥(𝑘 + 1) … 𝑥(𝑘 + 𝑁 − 1)]𝑻
4) Compute the autocorrelation matrix 𝑹𝑥= 𝑨 ⋅ 𝑨𝐻
𝜆1 > 𝜆2 > ⋯ 𝜆𝑘 ≫ 𝜆𝑘+1⋯
The first k eigenvalues magnificently greater than the rest correspond to k IMIs in echo. The eigenvectors with smaller eigenvalues will span the noise subspace for MUSIC algorithm, aligning as matrix𝑆𝑛.
6) Search for MUSIC pseudo-spectrum peaks:
𝑃(𝜑) =𝑎𝐻𝑎(𝜑)𝑆𝐻(𝜑)𝑎(𝜑)
𝑛𝑆𝑛𝐻𝑎(𝜑) (6)
A sharp peak in (6) declares an IMI presence, and its peak position 𝜑 corresponds to the IMI position. The variable 𝜑 in traditional DOA MUSIC (6) is spatial angle, but in this case, it is the temporal position.
Experimental Results
The proposed pseudo-MUSIC algorithm in Section 3 is verified based on real data from a bistatic high-frequency OTHR radar operating at 3-30MHz band. The receiver is based on uniform linear array of antenna elements. The isolation between transmission sites and receiving sites allows bistatic with a linear frequency modulated continuous wave. Batches of experiment samples were captured at daytime in summer, during which the impulsive interference sorts were unknown and probably from both natural and man-made sources. Every CPI includes 256 FMCW sweeps, with center frequency determined in real-time by the frequency management system with operation mechanism being similar to that described in [12].
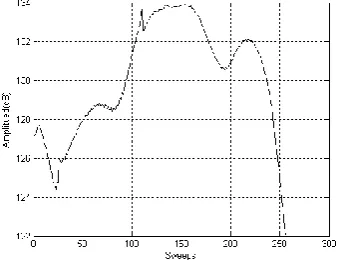
[image:5.595.213.383.458.588.2]Fig.2 illustrates the temporal waveform of 256 sweeps or pulse samples at a certain range-azimuth cell, which is output directly from the ADBF and the matched filter. A sharper peak is obviously centered at 110-th sample with the duration of about 10 data. Compared with the entire duration of 256, this duration of 10 data holds about 10/256 ≈ 4% of the CPI duration, which indicates that it is a typical IMI. But there is no other information for verification about its type.
Figure 2. Experimental data that are used in this method.
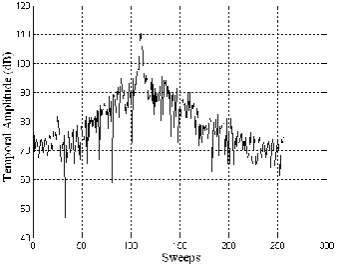
Figure 3. MUSIC spectrum of processed data.
[image:5.595.214.381.621.748.2]and N=241 so that the Hankel matrix can cover all 256 samples of CPI. There are two expected peaks in the processed pseudo-spectrum, centered at 25-th and 110-th sample, respectively. This indicates that there must exist two IMIs at these two positions. Although the clutter suppression is simple, it causes little effect on the detection performance of the pseudo-MUSIC: the peak is significantly sharp and the trail is little. Pseudo-spectra at non-interference position are almost suppressed to 0dB, which are filtered out as “noise” by MUSIC algorithm merits. This characteristic helps to determine the detection threshold. For example, a constant threshold over the whole CPI can be used, instead of the dynamic RMS threshold method which is refreshed at each position in one CPI[4]. We note that there is an unexpected peak at 1-th sample. Many batches of experiment samples indicate that there is always a fake peak at 1-th sample, which should be discarded manually.
[image:6.595.214.384.336.468.2]Comparison between Fig.3 and 4 shows the performance difference between the proposed pseudo-MUSIC method and the Barnum’s method [4]. In Fig.4, Barnum’s method shows a relatively obvious peak at the 110-th sweep just as Fig.3 does, indicating the strongest IMI in this CPI. At non-interference positions surrounding this peak, the amplitudes are still high because of the long trail. These almost submerge the peak at the 25-th sweep and make it undetectable. On the contrary, as is shown in Fig.3, the pseudo-MUSIC algorithm decreases the floor (non-interference samples) to almost 0dB and explicitly shows two expected IMI peaks. As a result, a constant detection threshold can be easily determined. This alleviates the computational cost brought by RMS.
Figure 4. Processing result with Barnum’s method.
Conclusion
A new method for time-domain impulsive interference detection in OTHR radar system is proposed in this paper. By virtue of the fact that the Doppler spectrum of impulsive interference can be modeled as complex cosine and applying the traditional MUSIC algorithm on the Doppler spectrum, the pseudo-spectrum can clearly indicate the IMI positions by means of sharp peak and at the same time suppress non-interference amplitude to almost 0dB. This makes it easy to determine the threshold for detection. The proposed algorithm depends little on the clutter pre-suppression. We experimentally show that this proposed algorithm significantly improves IMI detection performance against clutter and IMI influence.
Acknowledgment
This work is supported by Subsidies for Scientific Research Projects of Sichuan Education Department (18ZA0111)
References
[2] Liu Tao, etc, Fractal Features and Detection of Meteor Interference in OTHR, in 2006 CIE International Conference on Radar, Shanghai, China, 16-19 Oct. 2006, pp. 1-5.
[3] G.A.Fabrizio, A.B.Gershman, M.D.Turley, Robust adaptive beamforming for HF surface wave over-the-horizon radar, IEEE Trans. on AES, vol. 40, (April 2004) 510-525.
[4] J.R.Barnum, E.E.Simpson, Over-the-Horizon Radar Sensitivity Enhancement by impulsive noise excision, in IEEE National Radar Conference, 1997, pp. 252-256.
[5] Guo Xin, etc, Development of sky wave over-the-horizon radar, ACTA Aeronautica et Astronautica Sinica, vol. 23, (2002) 495-500.
[6] G.A.Fabrizio, G.J.Frazer, M.D.Turley, STAP For Clutter and Interference Cancellation in a HF Radar System, 2006 IEEE International Conference on Acoustics, Speech and Signal Processing , Vol. 4, May 2006, 1033-1036
[7] Huang Liang, etc, Suppressing instantaneous interference of high frequency ground wave radar. Chinese Journal of Radio Science, vol. 19, (2004) 166-170.
[8] Xing Meng-dao, etc, Transient Interference Excision in OTHR. ACTA Electronica Sinica, vol. 30, (2002) 823-826.
[9] B.Root, HF radar ship detection through clutter cancellation, Proceedings of the 1998 IEEE Radar Conference, 11-14 May 1998, pp. 281-286.
[10] Binwei Weng, Kenneth E. Barner, TR-MUSIC—A robust frequency estimation method in impulsive noise, Signal Processing, vol. 86, (July 2006) 1477-1487.
[11] Rafaat Khan, Desmond Power, and John Walsh, Ocean Clutter Suppression For An HF Ground Wave Radar, IEEE CCECE97, May 1997, pp. 512-515.