AMERICANINDUSTRIALHYGIENEASSOCIATIONJOURNAL 59:335–345 (1998) Ms. #735B
A
PPLIE
D
S
TUD
IE
S
Activity-Based Cost Management
Part II: Applied to a Respiratory
Protection Program
To demonstrate the relevance of activity-based cost management (ABCM) for the occupational
and environmental health community, the investigators used data generated by an ABCM model
of a respiratory protection program (RPP) to develop options for solving a business problem.
The RPP manager in this hypothetical but realistic business scenario is faced with a 25%
budget cut and a 10% increase in demand for RPP services. The manager’s dilemma is to
maintain the integrity of the RPP while absorbing a significant budget cut. Various cost savings
options are developed, and the assumptions under which these options operate are presented.
It is emphasized that the RPP manager’s primary responsibility is to assure worker health and
safety by first understanding the technical issues, merits, and implications of any cost-cutting
option that may be considered. It is argued that only then should the manager consider the
financial merits of the possible solutions to this business problem. In this way worker health
and safety, and environmental protection goals, can continue to be achieved in an economic
climate of cost cutting and downsizing.
Keywords: activity-based cost management, activity-based costing, activity-based
management, cost modeling, environmental and occupational health
I
n Part I in this issue (Am. Ind. Hyg. Assoc. J. 59:328–334) the principles and concepts of activity-based cost management (ABCM) were introduced. The purpose of this article is to demonstrate how ABCM can be used by managers and practitioners in occupational and environmental health organizations to make in-formed decisions when faced with difficult eco-nomic choices. Traditional cost accounting methods do not provide managers with timely and accurate cost data for making management planning and control decisions. Instead, ABCM is offered as a tool that managers can use to solve complex budgetary and business problems by (1) defining the work activities performed in an en-vironmental, safety, and health (ES&H) depart-ment; and (2) quantifying the costs of develop-ing and deliverdevelop-ing ES&H products and services. In this way ES&H managers can use a new cost management method to justify investments in an ES&H department to assure the health and safe-ty of workers.A hypothetical but realistic business problem that an ES&H manager must solve is presented. The initial focus of this article is on applying the principles and concepts of ABCM in the de-sign of a cost model. Then different solutions are developed and presented for solving the business problem. The assumptions under which each solution operates are discussed, which is a standard practice in any economic or policy analysis. The ABCM model was created as a way to understand ES&H costs and the drivers of those costs. The data generated by an ABCM model can be used to manage and con-trol ES&H activities and their associated costs. Ultimately, decisions must be made by manag-ers by first undmanag-erstanding the technical issues, merits, and implications of any cost reduction that may be considered. Only then should the ES&H manager consider the financial aspects of any possible solution to the problem presented in this article.
A
UTHORSMichael T. Brandt
a,bSteven P. Levine
bDean G. Smith
cHarry J. Ettinger
aBradford F. Gallimore
aaLos Alamos National
Laboratory, Environmental, Safety and Health Division, Los Alamos, NM 87545;
bErb Environmental
Management Institute and World Health Organization Collaborating Center, School of Public Health, University of Michigan, Ann Arbor, MI 48109-2029;
cDepartment of Health
A
PPLIE
D
S
TUD
[image:2.612.317.568.73.365.2]IES
TABLE I. Steps in Designing and Building an ABCM Model
Initiation
Business need for ABCM data is recognized Problem to be solved is defined
Time period to be examined is defined
Design Architecture
Business Process Mapping
Major work activities are identified and defined Business process is mapped
Process drivers are identified and defined Cost Tracing
Available budget resources are identified Resource cost drivers are identified and defined Budget resources are traced into activities Activity cost drivers are selected and defined Products and services are identified and defined
Costs are traced and/or assigned into products and services
Cost Computation and Analysis
Costs are calculated using ABC software Activity, product, and service costs are examined Data is examined based on locus of interest
Implementation and Action
Fact-based managerial decisions are made Changes are implemented
TABLE III. Operations Data and ABCM Model Design Assumptions
Annual Production LevelsA,B
Schedule, train and face-fit respirator users full-face masks580 classes (800 users) half-face masks515 classes (150 users) Test and certify masks
full-face51000 half-face5200
Test maintain, and repair masks full-face53000
half-face5700 Issue masks to users
full-face5180 batches (4500 masks) half-face560 batches (1500 masks) Respirator inventory
full-face53300 990 new masks purchased annually
half-face5700 210 new masks purchased annually
Assumptions
The respiratory protection program is an overhead function funded by a tax on operating (revenue producing) departments. The RPP is not taxed.
The RPP covers all costs of providing respirators to users. Users do no pay for the product and service directly.
Thirty percent of all respirators in the inventory are replaced annual-ly.
Salaries include fringe benefits (vacation, sick leave, insurances of 30%).
The model is a retrospective view of the expenditures that occurred in the program during one fiscal year.
The business process and costs are stable.
Each mask in the inventory is issued more than once. The fixed costs associated with each training class are equal. The fixed costs associated with each batch of respirators are equal.
[image:2.612.50.298.365.704.2]AThis is a fictitious example designed to illustrate ABCM concepts and principles. BAll cost and production data and assumptions are simplified for this exercise.
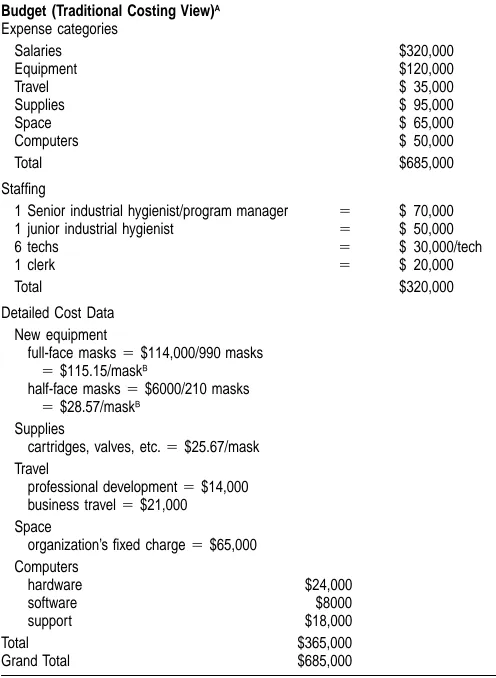
TABLE II. Resource Data
Budget (Traditional Costing View)A
Expense categories Salaries Equipment Travel Supplies Space Computers
$320,000 $120,000 $ 35,000 $ 95,000 $ 65,000 $ 50,000
Total $685,000
Staffing
1 Senior industrial hygienist/program manager 5
1 junior industrial hygienist 5
6 techs 5
1 clerk 5
$ 70,000 $ 50,000 $ 30,000/tech $ 20,000
Total $320,000
Detailed Cost Data New equipment
full-face masks5$114,000/990 masks
5$115.15/maskB
half-face masks5$6000/210 masks
5$28.57/maskB
Supplies
cartridges, valves, etc.5$25.67/mask Travel
professional development5$14,000 business travel5$21,000 Space
organization’s fixed charge5$65,000 Computers
hardware $24,000
software $8000
support $18,000
Total $365,000
Grand Total $685,000
AResources assigned to activities become cost elements, which are collected in cost pools that reflect similar cost behavior patterns.
BRepresents cost paid per unit to supplier. Volume discounts are not considered in developing cost savings options.
DESIGNING AN ABCM MODEL OF A
RESPIRATORY PROTECTION
PROGRAM (RPP)
T
he purpose of ABCM is to define the current operational be-havior of a business process by revealing business process in-formation and cost data that is obscured by traditional cost ac-counting methods. The following discussion will present the steps needed to design and build an ABCM model using an RPP as an example. Building an ABCM model involves creating an architec-ture that describes how costs are traced from a budget through activities to products and services, and how activities are linked together as a business process. The cost tracing view of the model will quantify what things cost, and the process view will describe why and how things cost what they do. The steps required to construct an ABCM model are summarized in Table I.An ABCM model was designed using the assumptions and the data summarized in Tables II and III. The methodology used to design the ABCM model was developed through a detailed ex-amination by the authors of the accounting and managerial sci-ences literature and case study research.(1–8) Each step needed in
il-A
PPLIE
D
S
TUD
IE
[image:3.612.49.562.60.139.2]S
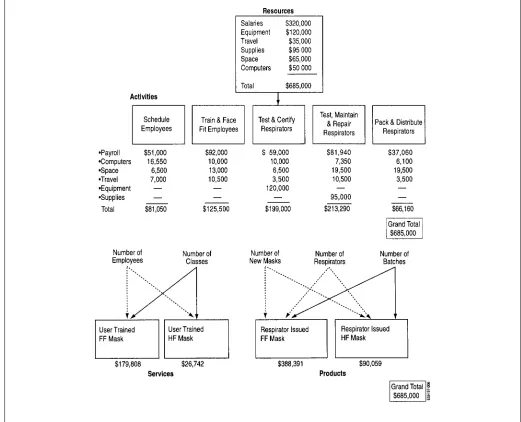
FIGURE 1. A process map shows how and where work is done and at what cost
lustrating key concepts and principles of ABCM and its applica-bility to occupational and environmental health. The data gener-ated are used to illustrate how the RPP manager can make fact-based decisions that will help achieve worker health and safety goals while solving a complex budget and business problem.
Initiation
Assume for the purpose of this model and discussion that the cur-rent budget of an RPP was reduced by 25% ($171,250) for the next fiscal year and the demand for respirators was projected to grow by 10% (from 950 to 1045) in the next fiscal year. These conditions establish a clear business need for understanding the technical need for and the cost of this program: the manager is faced with the dilemma of providing more service with fewer fi-nancial resources while maintaining the technical integrity of the RPP.
Design Architecture
Business Process Mapping
To begin constructing an ABCM model requires identifying and defining major work activities and linking them with one another through business processes mapping. A business process is a se-quence of logically related activities that use resources to create a product or service of value to a customer.(9–11)Business processes
are not constrained by departmental boundaries. Because business processes typically cross organizational boundaries, they are best defined and illustrated by mapping the activities that comprise the process. Business process mapping involves creating a map or flow-chart of activities and illustrating the relationships between those activities. Processes are mapped using information collected dur-ing a facilitated meetdur-ing in which representatives of the depart-ments involved (1) identify process drivers (causes of work), (2) identify process outputs (products and services), (3) define work activities and the relationships among the activities, (4) identify the departments responsible for performing each activity, and (5) identify the budget resources required by each activity.
Work activities, which are one step in a business process, must be carefully identified and defined. The designer of an ABCM model must work with the managers, supervisors, and key em-ployees to determine the amount of detail that will be incorpo-rated into the model. The detail must satisfy the desired use of the data. If activities are narrowly defined, too many activities will be identified and the model will become unnecessarily complex. Activities consume budget resources and describe the work per-formed in the business process. Selecting the RPP activities in-volves identifying each significant step in the process for qualifying employees to wear respirators and for issuing half-face and full-face mask respirators. For example, as shown in Figure 1, ‘‘Sched-ule Employees’’ is an activity. By identifying and defining activities
it is possible to understand what action is performed, how, and why it is used to create a product or deliver a service.
Process activities are caused by some action or existing condi-tion in the workplace. In this model, work is triggered in the business process when health protection regulations are applied, potential health hazards are recognized, or existing respirator users request a product or service. The five activities identified in this process are represented as a highly simplified sequence to issue respirators and deliver face fitting and training services (see Figure 1). This diagram does not reflect the fact that some of the activities can occur simultaneously. Nor does it reflect other process com-plexities. Behind each activity are other activities or subprocesses that support each major activity shown in Figure 1. For example, a setup activity supports the training and fitting activity. Setup involves calibrating an aerosol test chamber for face fitting, assem-bling training materials, and preparing all of the required docu-mentation for enrolling employees in the RPP.
Cost Tracing
The next step in the design of an ABCM model involves identi-fying the budget resources available to perform the work of the program. Table II shows the traditional cost accounting view of the budget for the program. The available resources in the budget serve as the starting point for tracing costs through the ABCM architecture. Portions of different resources are traced to each ac-tivity, and the cost associated with each portion is known as a cost element. This is important because the assigned elements of cost reflect the actual amount of budget resources required to perform each activity. Cost elements are collected in a pool for each activity and summed to determine the total cost of all resources used by each activity. The cost elements and cost pools for this model are shown under each activity in Figure 2.
Ideally, resources are traced to activities based on a causal re-lationship between a resource and an activity. A causal rere-lationship is present where a resource is shown to be directly consumed by the activity.(9,12)Resource cost drivers are used to trace and
mea-sure the consumption of resources by activities. The meamea-sure se-lected to trace resources to activities should reflect, as closely as possible, the causes of the consumption by the activity. Resources and their costs are traced to activities only if they are used by the activity. The objective of tracing resources is to identify the activ-ities that occupy a worker’s time and to determine the amount of other resources (materials, supplies, etc.) required to perform the activity. Examples of resource cost drivers include percentage of time spent performing a task by individual workers in different labor categories, a standard charge per square foot of space oc-cupied, and kilowatt hours metered for utilities consumed.
man-A
PPLIE
D
S
TUD
[image:4.612.46.567.63.485.2]IES
FIGURE 2. Resources traced into activities, products, and services
agement records. Costs are then traced based on a direct link be-tween the resource and the activity. ABCM designers often use estimates to assign labor and other resources to activities because job ticket and other data sources are either not available, incom-plete, or accuracy is questionable. Estimates of resource use can be gathered by interviewing knowledgeable managers, supervisors, and key employees about where and how much of their time is spent performing specific activities. The type and amount of other resources needed to perform work activities can also be collected during these interviews. The interviews may be conducted one-on-one or in a group.
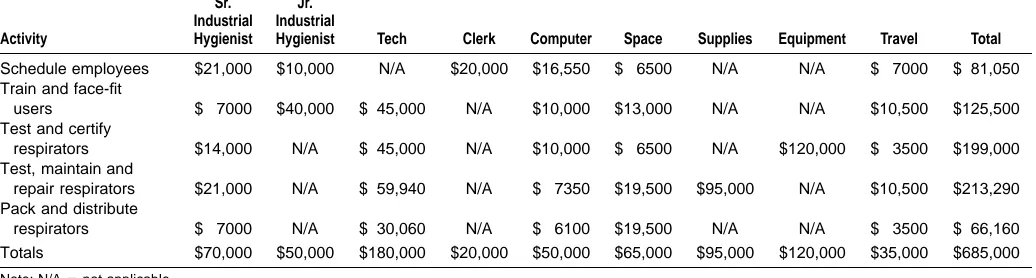
In this model the resource cost driver used to assign labor re-sources from the budget is simply an estimate of the percentage of time each employee performs an activity. The cost of each of the eight employees in the RPP is traced from the budget into each of the activities identified in the business process. The cost associated with each unit of labor (for each individual in each labor category) is multiplied by the time percentage estimate. For ex-ample, 30% of the senior industrial hygienist’s time and salary of $70,000 (including fringe benefits) is devoted to the activity titled
‘‘Schedule Employees,’’ which traces $21,000 in labor cost to this activity (seeTable IV). Tracing individual salary levels is necessary because of the wide differences in salaries as shown in Table II, which also improves the accuracy of the cost tracing.(12)The
re-mainder of labor costs are similarly traced to each of the activities in the business process. Each other remaining resource (comput-ers, space, supplies, travel, and equipment) is also traced to activ-ities. Figure 2 and Table IV show where the $685,000 of available resources were assigned into the five identified activities of the respiratory protection process.
A PPLIE D S TUD IE S
TABLE IV. Summary of Costs: Resources Traced to Business Process Activities
Activity Sr. Industrial Hygienist Jr. Industrial
Hygienist Tech Clerk Computer Space Supplies Equipment Travel Total
Schedule employees Train and face-fit
users Test and certify
respirators Test, maintain and
repair respirators Pack and distribute
respirators $21,000 $ 7000 $14,000 $21,000 $ 7000 $10,000 $40,000 N/A N/A N/A N/A $ 45,000 $ 45,000 $ 59,940 $ 30,060 $20,000 N/A N/A N/A N/A $16,550 $10,000 $10,000 $ 7350 $ 6100 $ 6500 $13,000 $ 6500 $19,500 $19,500 N/A N/A N/A $95,000 N/A N/A N/A $120,000 N/A N/A $ 7000 $10,500 $ 3500 $10,500 $ 3500 $ 81,050 $125,500 $199,000 $213,290 $ 66,160
Totals $70,000 $50,000 $180,000 $20,000 $50,000 $65,000 $95,000 $120,000 $35,000 $685,000
Note: N/A5not applicable.
used to produce products and deliver services. Reviewing the de-velopment of each step in designing an ABCM model and pop-ulating the model with data is important for increasing the accu-racy of the cost determinations.
One of the more difficult tasks associated with constructing the architecture of an ABCM model is defining the products produced and the services delivered. ES&H professionals typically do not think of their work in terms of products and services. Again, this information is generally gathered by interviewing key employees, supervisors, and managers about the output from individual work activities and the business process. In this model the service deliv-ered involves training and fitting medically qualified employees with respirators. Two types of products are produced and issued to qualified users: full-face and half-face mask respirators. These masks are assembled, tested, maintained, and repaired as part of the work activities of the RPP.
As shown in Figure 2, the costs associated with each activity are traced by an activity cost driver to a product or service based on the unique consumption patterns of the product or service for individual activities. The activity cost drivers (1) reflect a causal relationship between an activity and the product or service pro-duced, (2) measure how often activities are performed, and (3) reflect the level of effort required to complete an activity.(12,13)If
the product or service did not demand and consume an activity, it will not be assigned a cost from that activity. The literature offers three characteristics that should be considered in selecting activity cost drivers.(5,9,12)Each activity cost driver should (1) be simple to
understand, easy to measure, and have the data available; (2) close-ly correlate with or measure the use of activity resources directclose-ly by a product or service; and (3) encourage performance improve-ment by influencing manageimprove-ment behavior.
Selecting an activity cost driver and the number of activity cost drivers are two crucial design decisions that must be made to quantitatively link product and service costs with individual activ-ities. As shown in Figure 2, the number of employees is selected as the activity driver to measure the consumption of resources in the activity titled ‘‘Train and Fit Employees,’’ by the two services titled ‘‘User Trained FF Mask’’ and ‘‘User Trained HF Mask.’’ This cause-and-effect assignment assumes that the activity has only one cause—the number of employees—that drives the activity cost to the service. If an activity is defined too broadly, an ABCM model designer will have difficulty selecting an activity cost driver that best measures the use of resources by an activity. If an ABCM model designer discovers that some activities have costs that cannot be adequately explained using a single cost driver, then the activity should be divided into smaller supporting activities. In this way,
single activity cost drivers can be identified that closely measure the actual use of activity resources by a product or service, which will improve the accuracy of costing products and services.
Selecting an appropriate number of activity cost drivers must be balanced with the cost of designing and maintaining the ABCM model. The objective is to balance the model’s complexity be-tween too many and too few activity cost drivers. In simpler mod-els several activities may be combined into one high-level activity. The activity is then measured by an activity cost driver that is not as closely correlated with resource consumption. Such a driver is not the most accurate mathematical basis for tracing costs, but it may not be economically feasible or practical to collect the sup-porting data for the most appropriate measure.(12)The
disadvan-tage of using high-level activities and activity cost drivers with low correlation to resource consumption is that they represent an im-perfect compromise between ABCM model simplicity and the re-sulting distortion in product or service cost.(3,13)Finally, finding
quantitative causal relationships between products and activities is not always possible. In fact, the many activity cost drivers rely on estimated percentage distributions of the level of effort required to produce a given product.(9)As before, this information can be
developed through interviews with managers, supervisors, and key employees.
Cost Computation and Analysis
At this point the model design is complete. This ABCM model has been designed to help the manager understand where and how much money is being spent in the budget to produce the products and services they offer. The resource costs have been assigned to activities using resource cost drivers. Activity costs have been linked to the products and services using activity cost drivers. Once each of the drivers linking resources to activities and activ-ities to products and services is constructed, and the data is en-tered into the model, the software will calculate the costs for ac-tivities and products and services. The analysis of the data and its use in decision making are discussed in the next section.
THE ABCM MODEL AND POSSIBLE
SOLUTIONS TO THE BUSINESS PROBLEM
Primacy of Worker Health and Safety in Decision Making
A
PPLIE
D
S
TUD
IES
problem. The dilemma presented in this paper is not uncommon in business, industry, and government today. The purpose of this section is to describe the economic options available to the man-ager of the RPP. Certain assumptions are made to bound the con-ditions under which each solution suggested could work. But the dilemma remains: how will this manager continue to deliver pro-fessionally and technically sound respiratory protection services under the proposed economic conditions, which could affect the integrity of the RPP and, possibly, the health and safety of the worker.
Cutting any ES&H budget can result in unintended and neg-ative side effects. The manager in this scenario may select an op-tion to save money that could inadvertently result in costing more money to the organization. For example, under a worst case sce-nario, worker health and safety could be compromised by shifting a certain percentage of workers from full-face mask respirators to face mask respirators because the margin of safety that a half-face mask provides is less than a full-half-face mask. In this scenario, money could be saved in the short run, but in the long run the organization could spend more money than the amount saved if that decision results in an ill or injured worker. Ultimately, it is the responsibility of the manager to first protect worker health and safety by considering the technical merits of each option and then consider the financial merits.
Cost Analysis: Strategies for Reducing Costs
The data generated in this ABCM model identifies/quantifies the causes of work activities and their associated costs. Central to the analysis of the data are transactions, which are activities that gen-erate cost. Controlling activities should be the focus of manage-ment decisions. Reducing or eliminating the causes of activities can result in cost reductions. But a manager cannot reduce costs effectively without understanding the drivers of a business process and the drivers of each activity. Managers should focus on elimi-nating activities that do not optimize the production of ES&H products and services, as long as worker health and safety and environmental protection is not compromised. Any cost savings generated can be accumulated to offset a budget reduction. If the cost savings are significant enough, the resources saved can be redirected to other ES&H programs that support worker health and safety.
Through the analysis of the data generated, ABCM will be shown to be useful in providing information needed to manage and reduce the existing work load and cost as a way to solve the business problem presented earlier in this paper. The discussion to follow is framed in terms of what the manager of the RPP now knows as a result of building this ABCM model, including:
n activity causes,
n how and why resources are used,
n activity costs, and
n product and service costs.
Options will be presented and discussed for the RPP manager to reduce costs by
n eliminating or changing the causes of activities,
n reducing the demand for products and services, and
n streamlining and optimizing the way in which activities are per-formed.
Business Problem
The manager has the dilemma of providing service to 95 new respirator users while absorbing a budget cut of $171,250. A typ-ical response by a service organization to such economic pressure
would be to select one or more of the following immediate short-term responses: cease hiring, freeze overtime and salary increases, offer early retirement, or downsize the work force. The primary focus of these responses is to eliminate the costs associated with labor resources and presumably become more efficient. Such a re-sponse typically assumes that the surviving employees will perform the work of the eliminated workers. But the labor costs are a symp-tom of the problem (high process cost), not the root cause. Alter-native solutions can be developed to avoid short-term fixes such as reducing labor costs through layoffs, but not changing the way in which work is performed; such options are discussed below.
Budget Resource Analysis
The first step in the analysis of ABCM data is to understand which budget resources are being used, by which activities, and why the resources are required. Figure 2 and Table IV show where the resources have been traced into activities and which cost elements are assigned to each activity. From these data the RPP manager can begin to examine each cost element to determine why these costs are present. For instance, payroll represents the total cost of all labor (including fringe benefits) assigned to each activity. The activity titled ‘‘Test and Certify Respirators’’ has 25% of all tech-nicians and 20% of a senior industrial hygienist traced to it for a total payroll cost of $59,000 (see Table IV). Other expenses traced to this activity include 100% of equipment costs because part of this activity requires procuring new respirators, 10% of the total space expense of the program, and 20% of the total cost for com-puter support and equipment. One additional cost element, travel, is assigned to this activity for professional development.
By examining the details of how resources are traced into each activity and by questioning why the resources are required, the RPP manager can assess whether they are actually needed. For example, the cost of purchasing new respirators is based on the assumption that 30% of the inventory of 4000 respirators (3300 full-face masks and 700 half-face masks) will be replaced annually. In this scenario 1200 respirators are replaced annually. The deci-sion about the replacement of respirators is not based on the con-dition of the respirator, but on the age of the mask. Because of the budget reduction the RPP manager can elect to save a portion of the $120,000 expense for new masks by replacing only those respirators that cannot be repaired or certified as providing the required level of protection. Assuming that only 25% of each type of respirator in the existing inventory actually need to be replaced, the manager can save $30,000 by replacing 300 masks instead of the 1200 usually purchased, which is a 75% savings in purchase costs (refer to Table V). The money saved can be used to poten-tially make up the shortfall of more than $170,000 related to the 25% budget reduction. The same analysis can be performed for each cost element in each activity. Similar decisions can be made about redirecting resources, particularly labor resources, to other activities within the RPP or deployed to other ES&H activities.
Business Process Analysis
A
PPLIE
D
S
TUD
IE
[image:7.612.47.301.64.231.2]S
TABLE V. Options and Projected Cost Savings
Options
Projected Savings (Shortfall)
Reduce annual purchase of new respirators by
75% $30,000.00A
Change demand for respirators increase 10%
decrease 10%
($42,934.30)B
$42,954.30
Scheduling by employees using the Web $24,316.20C
Eliminate test and certify respirators activity $79,000.00
Create a self-managed team $70,000.00
Convert full-face mask users to half-face mask users
decrease 25% increase 25%
$21,471.84D
($4588.74)E
A–ERefer to the calculation appendix for computation information.
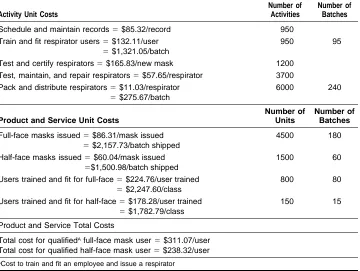
TABLE VI. As a Manager, What Do You Know About Costs?
Activity Unit Costs
Number of Activities
Number of Batches
Schedule and maintain records5$85.32/record 950
Train and fit respirator users5$132.11/user
5$1,321.05/batch
950 95
Test and certify respirators5$165.83/new mask 1200
Test, maintain, and repair respirators5$57.65/respirator 3700
Pack and distribute respirators5$11.03/respirator
5$275.67/batch
6000 240
Product and Service Unit Costs
Number of Units
Number of Batches
Full-face masks issued5$86.31/mask issued
5$2,157.73/batch shipped
4500 180
Half-face masks issued5$60.04/mask issued
5$1,500.98/batch shipped
1500 60
Users trained and fit for full-face5$224.76/user trained
5$2,247.60/class
800 80
Users trained and fit for half-face5$178.28/user trained
5$1,782.79/class
150 15
Product and Service Total Costs
Total cost for qualifiedAfull-face mask user5$311.07/user
Total cost for qualified half-face mask user5$238.32/user
ACost to train and fit an employee and issue a respirator
used (even with engineering controls in place), such as in asbestos removal; (2) air sampling results indicating that the airborne level of a contaminant exceeds a health protection standard or guideline and engineering controls are not feasible; and (3) existing respi-rator users reentering the process for periodic training and refit-ting. Knowing why these factors cause activities to occur is im-portant for understanding why respirator use is projected to grow by 10% in the next fiscal year.
The RPP manager needs to examine the basis of the projected 10% increase in demand for products and services in the next fiscal year. The RPP manager can examine and evaluate the existing demand for respiratory protection. Existing respirator users who no longer require respiratory protection should be removed from the registry of qualified users, where possible. This decision must be made between the RPP manager and line managers with em-ployees currently enrolled in the RPP. Users with a continuing
need for respiratory protection, as demonstrated by documented airborne hazard levels and other factors, must be kept in the gram. But when users are technically shown not to need this pro-tection, the RPP manager should consider removing them from the program or finding another way to recover the cost for pro-viding this service. This can be done by back-charging the re-questing department.
Reducing the number of employees requiring respiratory pro-tection will reduce the total cost of the program by the unit cost of each activity. For example, Table VI shows the unit cost of each activity. If the number of respirator users can be reduced by just 10% or by approximately 95 users, approximately $42,934.30 in process costs can be saved. This savings is achieved by a reduction in a major cause of work: the need to schedule, fit and train, certify, repair, and issue respirators to users. Thus, by eliminating a portion of one of the causes of work activities in a business process, costs can be avoided and funding saved in each activity in the process.
Activity Analysis
Instead of trying to manage and control costs, the manager should focus on managing activities and their drivers to control costs. Activities are examined because they are easily understood, contain the elements of cost, are demanded by a product or service, and can be affected and changed. In this way the root cause of an activity can be identified and changed, which will change the as-sociated cost by affecting the type and amount of budget resources traced to it. The basic logic used to analyze activities can be sum-marized as follows.
(1)Identify and define each significant activity in a business pro-cess.
(2)Understand why and how the activity is performed.
[image:7.612.50.410.469.740.2]A
PPLIE
D
S
TUD
[image:8.612.313.566.63.232.2]IES
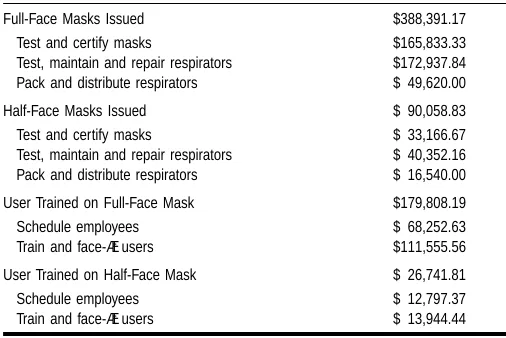
TABLE VII. Activity Costs Traced to Products and Services
Full-Face Masks Issued $388,391.17
Test and certify masks
Test, maintain and repair respirators Pack and distribute respirators
$165,833.33 $172,937.84 $ 49,620.00
Half-Face Masks Issued $ 90,058.83
Test and certify masks
Test, maintain and repair respirators Pack and distribute respirators
$ 33,166.67 $ 40,352.16 $ 16,540.00
User Trained on Full-Face Mask $179,808.19
Schedule employees Train and face-fit users
$ 68,252.63 $111,555.56
User Trained on Half-Face Mask $ 26,741.81
Schedule employees Train and face-fit users
$ 12,797.37 $ 13,944.44 (4)Determine whether the activity can be changed (reduced,
elim-inated, or optimized) without adversely affecting worker health and safety or environmental protection, or negatively affecting the business process.
(5)Determine whether the frequency of an activity can be reduced while maintaining the integrity of the ES&H program and the effectiveness of the business process.
(6) Where possible, quantitatively link activities to a product or service using an activity cost driver.
(7)Determine whether the overhead expenses associated with each activity are acceptable.
As shown in Table VI, such an analysis will provide information about the costs associated with each activity in the process. This analysis will also identify activities critical to worker health and safety and business process management, and create alternatives for management consideration and action.
In this model the actual cost of these overhead expenses has been traced to activities using an estimate as a resource cost driver. Actual costs are those historic costs that occur in a defined period of time. Using these costs to populate the ABCM model, the RPP manager can examine individual activities to search for cost sav-ings. For example, the RPP manager could create self-managed work teams to eliminate the need for daily supervision, reducing the amount of space occupied, and reducing travel costs by only approving travel essential for maintaining the integrity of the pro-gram. If the RPP were transformed into a self-managed work team (assuming an appropriate level of technical oversight), the senior industrial hygiene labor resource could be redeployed to other ES&H activities for an overhead savings of $70,000. This cost sav-ings would be reduced by the amount of time that the senior in-dustrial hygienist provided oversight to the self-managed team.
Another place to start activity analysis is with a high-cost activ-ity such as testing and certifying respirators. The basis for testing and certifying respirators after they arrive from a supplier can be rethought. Instead of testing and certifying each respirator pur-chased, which costs $199,000 for this activity, the manager can require that his or her supplier test and certify each respirator as a condition of purchase. Assuming that the price of the respirators does not change with this added requirement and that 1200 res-pirators continue to be purchased annually, the manager can elim-inate the testing and certifying activity and save $79,000 in labor, computer, space, and travel costs. With this option it would be prudent to replace the extensive testing and certifying activity with a statistical quality assurance check of the respirators received. The cost of such a program would then be subtracted from the $79,000 savings indicated above to determine the net savings of eliminating the testing and certifying activity from the process and replacing it with a quality assurance activity.
The scheduling activity should also be examined because it feeds employees into the business process and creates costs throughout the process. Perhaps a new technology can be used to reduce or eliminate scheduling costs. It may be feasible to create a home page for the respiratory protection program on the World Wide Web to give users the ability to schedule themselves for class-es, based on the schedule and availability shown on the computer. If, for example, the scheduling activity could be transferred to electronic scheduling with a savings of 30% in the total annual activity cost (after programming costs are considered), $24,316.20 could be saved in the first year. In subsequent years the cost for maintaining the home page on the Web and administration costs could be reduced from the $56,733.80 invested in the first year to set up and administer the electronic scheduling. If the number of existing respirator users can be decreased and the projected
growth in demand can be limited, additional process costs can be saved.
Overhead costs can be identified as a separate activity or they can be included as the cost of each activity in the business process. In either case, overhead costs must be factored into the final cost of products and services to develop their ‘‘fully loaded’’ costs. Each of the activities in this model has at least two cost elements that can be considered as overhead costs. The cost elements iden-tified in Table IV as overhead expenses include space, travel, and the labor of the senior industrial hygienist who serves as the man-ager and supervisor of the RPP. This is not an all-inclusive list of overhead costs, but only a partial list to illustrate how these ex-penses can be handled in an ABCM model. In some ABCM mod-els, overhead expenses are collected in an activity referred to as a program sustaining activity. In such cases the overhead cost would then need to be assigned to either the activity costs or the products and services produced using a resource cost driver.
Managers can also develop insight into how products and ser-vices consume activities by examining activity cost drivers. To sim-plify this model it is assumed that each one of the identified ac-tivity cost drivers shown in Figure 2—number of employees, num-ber of new masks, numnum-ber of respirators, and numnum-ber of batches— represents a close correlation between production costs and the product produced and the service delivered. This is an important point because the accuracy of product and service costs improves as the correlation between the consumption of an activity implied by a cost driver and the actual consumption increases.(3,13)
A
PPLIE
D
S
TUD
IE
S
costs can be reduced. Cost savings options that could be explored include combining the two classes into one, increasing the class size, decreasing the frequency of class offerings, using self-training videos, or developing a traveling training capability.
A manager can also choose to save costs by examining the unit cost of a product or service. For example, if the manager can determine that a portion of the current full-face mask users can be switched to half-face masks while maintaining an accept-able protection factor, then $21,471.84 can be saved (see Taccept-able V). This savings is based on the assumption that only equipment cost is affected by switching 25% of the existing respirator users from full-face to half-face respirators. As a result, full-face mask costs will decrease by $28,557.20, while half-face mask costs will increase by $7058.06 to $13,085.06 (see calculation Appendix). The money saved can also be applied toward the budget shortfall or redirected toward other ES&H activities. These possible pro-jected savings are presented to illustrate how the ABCM analysis can be used to generate data that can be used to make decisions.
Products and Services Analysis
The products and services produced by the RPP are shown in Figure 2. Table VII shows how activity costs have been traced to products and services. The resultant unit cost results for each product and service produced is shown in Table VI. These fig-ures are based on 4500 full-face masks being issued and 1500 half-face masks being issued. Activity costs have been traced to the products and services produced only if the product or service used a portion of the resources assigned to an activity. Table VII shows the cost contributed by each activity to the cost of the product or service produced. This information is useful in de-termining how changing the cost of an activity can influence the total and unit costs of a product or service downstream in the business process. For instance, it was suggested earlier in the article that the scheduling activity could be placed on the Web for a savings of $24,316.20. Assuming that the proportion of respirator users would remain unchanged, the same proportion of scheduling costs would be driven to each product and service produced. The ABCM modeling software can be used to ex-amine ‘‘what if ’’ scenarios. For example, the new total cost ac-tivity figure of $56,733.80 (from $81,050) for scheduling em-ployees would reduce the unit costs for training and fitting users in full-face masks and half-face masks from $224.76/full-face mask user to $199.16/user, and from $178.28/half-face mask user to $152.68/user. These results demonstrate the impact that changing an upstream activity in a business process can have on a product or service produced.
Implementation and Action: Utility of ABCM in ES&H Management
Essential to the development of alternatives to solve any business problem are assumptions. In this case the manager must carefully examine and understand the assumptions made in generating each cost savings shown in Table V and the calculation Appendix before making recommendations to solve the business problem. The con-ditions under which each assumption operates must be clearly un-derstood before a decision is made, particularly when two alter-natives are selected. Some of the alteralter-natives listed in Table V, such as eliminating the activity labeled ‘‘Test and Certify Respirators,’’ could possibly affect only a single activity without any impact on other activity costs downstream in the business process. Other cost saving options listed in Table V, such as changing the demand for respirators, affect the cost of other activities downstream in the
business process. The manager must also be aware of possible un-intended negative consequences of any option selected. However, if the manager cannot find $170,000 in cost savings, then the long-term future of the RPP program, as it currently exists, is in doubt.
The initial focus of this article is on applying the principles and concepts of ABCM in the design of a computer model. Then dif-ferent solutions are developed and presented for solving the busi-ness problem. The assumptions under which each solution oper-ates are discussed, which is a standard practice in any economic or policy analysis. The ABCM model was created as a way to un-derstand ES&H costs and the drivers of those costs. The data generated by an ABCM model can be used to manage and control ES&H activities and their associated costs. Ultimately, decisions must be made by managers by first understanding the technical issues, merits, and implications of any cost reduction that may be considered. Only then should the ES&H manager consider the financial aspects of any possible solution to the problem presented in this article.
If the underlying rules and beliefs governing the work of the existing business process are challenged, then the work activities can be freely examined to identify their root causes. In this case the focus of the first three options listed in Table V is on managing activities, not costs. Eliminating the need for an activity or chang-ing the way in which an activity is performed may affect not only the cost of an individual activity, but also the costs of the entire business process. For example, scheduling employees on the Web is projected to save approximately $24,000 in the first year alone. But the RPP manager cannot precisely project the impact of this change on enrollment in the RPP. Regardless of whether enroll-ment increases or decreases as a result of this change, the cost impact will cascade through the business process because this ac-tivity feeds respirator users through the remainder of the process and drives work in each activity, which generates costs.
Another cost saving option, creating self-managed work teams as shown in Table V, attempts to address the overhead cost asso-ciated with the management and supervision provided by the se-nior industrial hygienist. By creating teams that manage their own performance and work toward goals established by management, oversight by the senior industrial hygienist can be substituted for daily supervision, which is costly. This labor resource can be re-directed toward other ES&H activities requiring a senior-level professional.
The next option shown in Table V addresses the 10% increase in demand for respirators. This increase will result in a funding shortfall in this activity of approximately $42,934.30. The shortfall exists because the total number of respirator users increases from 950 to 1045. There is a resultant increase in the total cost of each activity in the business process by 95 additional users as shown in the calculation appendix. Conversely, a savings of $42,934.30 can be realized if 95 users are removed from the RPP.
A
PPLIE
D
S
TUD
IES
CONCLUSIONS
E
S&H departments and programs are increasingly under pres-sure to justify the costs associated with their work activities and to provide the same level of service or more with reduced financial resources. Some ES&H organizations have decreased the number of ES&H professionals on staff and introduced other cost-cutting measures. Traditional cost accounting methods do not provide managers with timely and accurate cost data for making manage-ment planning and control decisions. A new and emerging busi-ness tool, ABCM, is offered to ES&H managers as a method to solve complex budgetary and business problems by quantifying the costs of developing and delivering ES&H products and ser-vices. ABCM can also be used to manage and control ES&H work activities and thereby control the costs associated with the activity transactions.Under the business scenario presented in this article, the ABCM model yields data and information to help an ES&H man-ager better quantify the cost of work activities to show how fund-ing is befund-ing used, quantify the cost of products and services, and understand why these costs occur. The data were analyzed and assumptions were made to generate cost savings options for the RPP manager to consider. This exercise demonstrates the value of ABCM as a business tool: the manager can choose between vari-ous cost-saving options to solve the business problem presented. ABCM has been shown to yield profound knowledge about how work is performed as a business process and about the associated costs.
ABCM is an important business and cost management devel-opment for occupational and environmental health because the method
n focuses management attention on the location of major costs of ES&H work;
n improves a managers understanding of the relationship between activities and costs;
n identifies the location and magnitude of problems and oppor-tunities for cost savings and process improvements; and
n improves management understanding about costs by removing the distortion resulting from simplistic cost allocations.
With such information ES&H managers can demonstrate how they can use business and cost management principles, concepts, and language to communicate with senior-level business managers to justify financial investments by an organization in ES&H pro-grams. In this way the core mission of any ES&H department or program—assuring the health and safety of workers, and prevent-ing environmental degradation—can be better served.
ACKNOWLEDGMENTS
T
he authors wish to acknowledge the support of Dennis J. Er-ickson, Thomas G. Gunderson, and Margaret J. Gosling of the Environmental, Safety, and Health Division; Jim Gourdoux of the Facilities, Safeguards, and Security Division at the Los Alamos Na-tional Laboratory; and Gary Cokins of ABC Technologies, Inc. for his mentorship in activity-based costing.REFERENCES
1. Cooper, R.:The rise of activity-based costing—Part One: What is an activity-based cost system?J. Cost Manag. 2(2):45–54 (1988). 2. Cooper, R.:The rise of activity-based costing—Part Two: When do
I need an activity-based cost system? J. Cost Manag. 2(3):41–48 (1988).
3. Cooper, R.: The rise of activity-based costing—Part Three: How many cost drivers do you need, and how do you select them?J. Cost Manag. 3(1):34–46 (1989).
4. Cooper, R.:The rise of activity-based costing—Part Four: What do activity-based cost systems look like? J. Cost Manag. 3(2):38–49 (1989).
5. Norkiewicz, A.:Nine steps to implementing ABC.Manag. Account. 75(4):28–33 (1994).
6. Kreuze, J.G., and G.E. Newell:ABC and life-cycle costing for en-vironmental expenditures.Manag. Account. 75(2):38–42 (1994). 7. Brooks, P.L., L.J. Davidson, and J.H. Palmides:Environmental
compliance: you better know your ABCs. Occup. Haz. pp. 41–46 (1993).
8. Willits, S.D., and R. Giuntini:Helping your company ‘‘go green.’’
Manag. Account. 75(2):43–47 (1994).
9. Cokins, G.: Activity-Based Cost Management: Making it Work, A Managers Guide to Implementing and Sustaining an Effective ABC System. Chicago: Irwin Professional Publishing, 1996. pp. 18–28. 10. Rummler, G.A., and A.P. Brache:Improving Performance, How to
Manage the White Space on the Organization Chart, 2nd ed. San Fran-cisco: Jossey-Bass Publishers. 1995. pp. 1–63.
11. Harrington, H.J.: Business Process Improvement: The Breakthrough Strategy for Total Quality, Productivity, and Competitiveness. New York: McGraw-Hill, Inc., 1991. pp. 1–24, 86–113.
12. Brimson, J.A.:Activity Accounting, An Activity-Based Costing Ap-proach.New York: John Wiley & Sons, 1991. pp. 46–97.
13. O’Guin, M.C.:The Complete Guide to Activity-Based Costing. Engle-wood Cliffs, NJ: Prentice Hall, 1991. pp. 21–27.
APPENDIX
Calculations Supporting Table V
AReplace 25% of the 1,200 repspirators purchased annually.
Annual Budget for Respirator Purchase
5($114,000/990 FF*)3(990325%)5$28,500.00 Full Face
5($6,000/210 HF*)3(210325%)5 $ 1,500.00 Half Face $30,000.00
*Currently, 990 FF and 210 HF masks are puchased.
B(95 employees3$85.32/record)1(95 users3$132.11/user)
1(95 respirators3$165.83/respirator)195 respirators
3$57.65/respirator*)1(95 respirators3$11.03/respirator)
5$42,934.30*
*Based on the current activity volume (i.e. number of activity units performed). Ignores step function costs.
C(950 employeese3$85.32/employee scheduled)330% savings. DCurrently, 990 FF users325% reduction5248 fewer FF users.
$115.15/FF mask*3248 masks5$28,557.20 savings on FF The number of HF mask costs grows as follows:
210 HF existing users1248 new HF users5458 HF masks 248 HF masks3$28.57/HF mask*5$7,085.36.
$114,000228,557.205$85,442.80 Full Face $6,0001$7,085.36 5$13,085.36 Half Face
$98,528.16 New total cost for masks Current Equipment Budget5 $120,000.00
2$ 98,528.16 $ 21,471.84 Savings *Existing unit cost per masks purchased.
E210 existing HF users325%553 HF users switch to FF masks
53 fewer HF users3$28.57/HF mask*5$1,514.21 savings 53 new FF3$115.15/FF mask*5$6,102.95
New cost FF mask5$114,000.00
1$ 6,102.95 $120,102.95 New cost HF mask5$6,000.00
2$1,514.21 $4,485.79
New equipment cost5$124,588.74, which is a $4,588.74 short-fall