0095-1137/95/$04.0010
Copyrightq1995, American Society for Microbiology
Multicenter Evaluation of Arbitrarily Primed PCR for Typing of
Staphylococcus aureus Strains
ALEXVANBELKUM,1* JAN KLUYTMANS,1WILLEMVANLEEUWEN,1RENE BAX,2WIM QUINT,2
EDITH PETERS,3AD FLUIT,3,4CHRISTINA VANDENBROUCKE-GRAULS,3ADRIAAN
VAN DENBRULE,5
HANS KOELEMAN,5WILLEM MELCHERS,6JACQUES MEIS,6ABDESLAM ELAICHOUNI,7
MARIO VANEECHOUTTE,7FRANCOISE MOONENS,8NICOLE MAES,8
MARC STRUELENS,8FRED TENOVER,9ANDHENRI VERBRUGH1
Department of Bacteriology, University Hospital Dijkzigt, 3015 GD Rotterdam,1Department of Molecular Biology, Diagnostic
Center SSDZ, 2600 GA Delft,2Eijkman-Winkler Institute for Medical and Clinical Microbiology, University Hospital
Utrecht, 3508 GA Utrecht,3U-Gene Research BV, 3584 CJ Utrecht,4Department of Medical Microbiology, Free
University Hospital, 1081 HV Amsterdam,5and Department of Medical Microbiology, University
Hospital Nijmegen, 6500 HB Nijmegen,6The Netherlands; Department of Clinical Biology,
University Hospital, B-9000 Gent,7and Unite´ d’Epidemiologie, Hoˆpital Erasme,
1070 Brussels,8Belgium; and Nosocomial Pathogens Laboratory Branch,
Centers for Disease Control and Prevention, Atlanta, Georgia 303339
Received 2 December 1994/Returned for modification 16 January 1995/Accepted 22 February 1995
Fifty-nine isolates ofStaphylococcus aureusand a single strain ofStaphylococcus intermediuswere typed by
arbitrarily primed PCR (AP-PCR). To study reproducibility and discriminatory abilities, AP-PCR was carried out in seven laboratories with a standardized amplification protocol, template DNA isolated in a single institution, and a common set of three primers with different resolving powers. The 60 strains could be divided into 16 to 30 different genetic types, depending on the laboratory. This difference in resolution was due to differences in technical procedures (as shown by the deliberate introduction of experimental variables) and/or the interpretation of the DNA fingerprints. However, this did not hamper the epidemiologically correct clustering of related strains. The average number of different genotypes identified exceeded those of the more traditional typing strategies (F. C. Tenover, R. Arbeit, G. Archer, J. Biddle, S. Byrne, R. Goering, G. Hancock, G. A. Hebert, B. Hill, R. Hollis, W. R. Jarvis, B. Kreiswirth, W. Eisner, J. Maslow, L. K. McDougal, J. M. Miller, M. Mulligan, and M. A. Pfaller, J. Clin. Microbiol. 32:407–415, 1994). Comparison of AP-PCR with pulsed-field gel electrophoresis (PFGE) indicated the existence of strains with constant PFGE types but variable AP-PCR types. The reverse (constant AP-PCR and variable PFGE patterns) was also observed. This indicates additional resolution for combined analyses. It is concluded that AP-PCR is well suited for genetic analysis and moni-toring of nosocomial spreading of staphylococci. The interlaboratory reproducibility of DNA-banding patterns and the intralaboratory standardization need improvement.
Numerous procedures for comparison of bacterial isolates have been developed (for reviews, see references 2, 11, 13, and 15). These procedures are important in investigations of strain origin, clonal relatedness among strains, and epidemiology. For Staphylococcus aureus, it has been demonstrated that most of the typing procedures can be applied successfully to obtain epidemiologically useful data. Tenover et al. (22) compared 12 typing strategies and concluded that DNA-based typing meth-ods and immunoblotting are best suited for epidemiological analyses. With the exception of biotyping, which appeared to produce too many subtypes, no single technique proved overtly superior or inferior. When all procedures were compared, un-related strains were grouped with differing frequencies. This comparative analysis of typing procedures provides a reference scheme for rating novel typing strategies against the more established methods.
Recently, a large number of reports describing the use of PCR for genetic typing of medically important microorganisms (for surveys, see references 23 and 26) have appeared. By arbitrarily amplifying variable regions in the bacterial genome
(arbitrarily primed PCR [AP-PCR]), isolate-specific DNA fin-gerprints can be obtained in a rapid and reproducible manner. In most cases, these analyses are not accompanied by detailed comparisons with the results of alternative typing procedures. For S. aureus, for instance, several studies have compared AP-PCR with only a single other technique (20, 21, 24, 25).
The present study was undertaken to determine the repro-ducibility and discriminatory abilities of AP-PCR when com-pared with other staphylococcal typing procedures. To this end, the S. aureus strains that were studied previously by Tenover et al. (22) were typed in multiple AP-PCR assays with three different arbitrary primers, guided by a standard ampli-fication protocol and performed independently in seven differ-ent laboratories.
MATERIALS AND METHODS
Bacterial strains and description of isolates.Fifty-nine isolates of S. aureus
were included in this study. All isolates were identified and confirmed to be S.
aureus by standard biochemical methods (12). The strains have been described
before (22), and 40 of them were derived from five well-documented outbreaks. The 19 additional isolates are epidemiologically unlinked. A single isolate of S.
intermedius was included.
The 60 strains were divided into three groups (SA, SB, and SC), some of whose key features are summarized below (Table 1). Group SA contains the strains involved in outbreaks that occurred in two nursing homes (strains labeled NH1 and NH2). Strain SA-04 is ATCC 12600 (American Type Culture Collection,
* Corresponding author. Mailing address: Department of Bacteriol-ogy, University Hospital Dijkzigt, Dr. Molewaterplein 40, 3015 GD Rotterdam, The Netherlands. Phone: 31-10-4635813. Fax: 31-10-4633875.
1537
on May 15, 2020 by guest
http://jcm.asm.org/
TABLE 1. General survey of phenotypic and genotypic typing data in comparison with the results from the multicenter study on AP-PCR-mediated DNA fingerprinting for 60 Staphylococcus strains Strain a Out- break b Ox rc Phage type
Anti- bio- gram
Bio- type AP-PCR datasets d Plas- mid e Ribo- type f PFGE FIGE Im-muno- blot MLEE IS g
Coagu- lase PCR
h RFLP type Ia Ib II III IV V VI VII SA-16 NO S NR I INT i HEH FEF HEG GDH FDF FDG GFG DDC NP de I VII K F NH 0.0 NH:NH:NH:NH SA-04 NO S 6/47/54/75 B A2B BBB BBB BBB BBB BBB BBC BCC BBA2 B fi E IV D E NH 2.1 NH:X:4:NH SA-12 NO R 47/54/75/77/83A G A3B AAA AAA AAA AAA AAA AAA AAA AAA1 NP bb J IC2 A A5 C 9.0 I:A:1:NH SA-18 NO R 47/54/75/77/83A J A3B AAA AAA AAA AAA AAA AAA ABA AAA1 I bb J IC3 A2 A3 C 9.0 I:A:1:NH SA-20 NO R 47/54/75/77/83A K A3B AAA AAA AAA AAA AAA AAA ABB EAA1 J bb J IC1 A1 A1 C 9.0 I:A:1:NH SA-06 NO I NR C A3B CAC AAC CAC CAC AAA AAB ABB AAA1 C aa C III A4 A4 B 9.0 II:NH:1:a SA-07 NO S 53/ 1 D H4 DAD AAC DAC AAD CAA AAD CBA AAA1 D bc B V C A2 NH 9.0 NH:NH:1:NH SA-08 NO R 54/75/77/81 E I2B ECE CCD ECD DBE DBC CBE DDD CB 9 B E ed G IIA E1 D1 D 7.0 I:NH:6:NH SA-11 NO R NR F A2B ECF CCD ECE DBF DBD CBF DDE CB 9 B E gd F IIB E2 D2 G 7.0 II:NH:6:NH SA-01 NH1 R 54/77 A1 A1B AAA AAA AAA AAA AAA AAA AAA AAA1 A aa1 K1 IB A1 A1 A 9.0 I:A:5:a SA-09 NH1 R 54/77 A A1B AAA AAA AAA AAA AAA AAD ABA AAA1 NP aa1 K2 IB A1 A1 A 9.0 I:A:5:a SA-03 NH1 R 47/54/75/77 A2 A3B AAA AAA AAA AAA AAA AAB ABB AAA1 NP aa A IA A A1 C 9.0 I:A:1:NH SA-13 NH1 R 54/77 A3 A1B AAG AAA AAA AAA AAA AAA AAA AAA1 G aa A IA A3 A2 A 9.0 I:A:1:a SA-14 NH1 S 54/75/77 H B1B GDG EDE GDF FCG -CE ECA FEF ACA3 H ci H VI E3 C NH 9.0 NH:NH:1:NH SA-19 NH1 R 54/77 A4 G1B AAA AAA AAA AAA AAA AAB ABB EAA1 A aa1 K3 IB A1 A1 A 9.0 I:A:1:a SA-17 NH2 R 54/75/77 A C3B AAA AAA AAA AAA AAA AAB ABB EAA1 A aa A IA A A1 A 9.0 I:A:1:a SA-02 NH2 R 75/77 A A3B AAA AAA AAA AAA AAA AAA AAA AAA1 A aa A IA A A1 A1 9.0 I:A:1:b SA-15 NH2 R 77 A A3B AAA AAA AAA AAA AAA AAA AAB AAA1 A aa A IA A1 A5 A1 9.0 I:A:1:a SA-05 NH2 R 77 A A3B AAA AAA AAA AAA AAA AAB ABB AAA1 A aa A IA A A1 A 9.0 I:A:1:a SA-10 NH2 R 77 A A3B FAA DAA FAA EAA EAA DAA EAA JAA1 A aa D ID A1 B A 9.0 I:A:1:a SB-07 NO S 6/47/54/75 C A2B BBB BBB BBB JBB BBH -BC BCC BBA1 D ci D IIB3 D 9 B3 NH 2.1 NH:X:4:NH SB-03 I R 75/ 1 A C4 AAA AAA AFA HEA AE-AEA HGA EEA1 C aa A IA A6 A1 E 9.0 I:A:1:a SB-05 I R 75/ 1 A A4 AAA AAA AFA HEA AEA AEA HGA EEA1 C aa A IA A6 A1 E 9.0 I:A:1:a SB-10 I R 75/ 1 A A4 AAA AAA AFA HEA AEA AEK HGA HEA1 C aa A IA A6 A1 E 9.0 I:A:1:a SB-12 I R 75/ 1 A C4 AAA AAA AFA HEA AEL AEK HGA AAA1 C aa A1 IA A6 A1 E 9.0 I:A:1:a SB-15 I R 75/77/83 A C4 AAA AAA AFA HEA AEL AEA HGA AAA1 C aa A IA A6 A1 E 9.0 I:A:1:a SB-19 I R 75/ 1 A A4 AAA AAA AFA HEA AEL AEA HGA AAA1 C aa A IA A5 A1 E 9.0 I:A:1:a SB-20 I R 75/ 1 A A4 AAA AAA AFA HEA AEL AEK HGA AAA1 C aa A IA A5 A1 E 9.0 I:A:1:a SB-01 NO R 75/77 A A4 AAA AAA AFA HEA AEA AEA HGA EEA1 A aa A1 IB1 A5 A1 E 9.0 I:Y:1:a SB-16 NO R 75/77/83A A A4 AAA AAA AFA HEA AEL AEA HGA AAA1 A aa A1 IB1 A5 A1 E 9.0 I:Y:1:a SB-18 NO R 75/ 1 A C4 AAA AAA AFA HEA AEL AEA HGA AAA1 J aa A IA A7 A1 E1 9.0 I:A:1:a SB-17 NO I 96 E B3B LDL JIM NJM OCQ LCO KCM NKM ACA6 I fj E IV G A2 NH 6.0 NH:NH:1:NH SB-14 NO R 47/54/75/77/83A A1 A3B AAG AHL AAL HAP AAN AAA AAF AAA3 H ea A2 IB2 A5 A3 D 9.0 I:A:1:NH SB-08 NO S 95 B1 C4 JGJ HBI JHI KGM IGI IGI JII GFG E dd1 F III E5 C NH 2.0 NH:NH:1:NH SB-02 II S 3A/55 B B1B IFI GFH IGH IFK GFG HFH IHH FBD B bb B IIA D1 B1 NH 6.0 NH:NH:7:NH SB-04 II S 3A/55 B D1B IFI GFH IGH IFL HFG -FH IHH FBD B bb B IIA D1 B1 NH 6.0 NH:NH:7:NH SB-06 II S 3A/55 B B1B IFI GFH IGH IFK HFG HFH IHH FBD B bb B IIA D1 B1 NH 6.0 NH:NH:7:NH SB-11 II S 3A/55 B B3B FFK GFK LGK MFO KHK JFL LHK ABE G b1b C IIB2 D2 B1 NH 14.0 NH:NH:7:NH SB-09 NO S 3A D D3B BFI IDJ KIJ LBN JBJ BBJ KJJ HBE F bb B IIA D1 B1 NH 6.0 NH:Z:7:NH SB-13 NO S 3A B2 D3B KFI GGJ MIJ NBN RBM BBJ MIL ABF G bb B1 IIB1 E6 B2 NH 6.0 NH:NH:7:NH
on May 15, 2020 by guest
http://jcm.asm.org/
SC-03 NO S 6/47/54/75 C A2B BBB BJB BBB JBB OBP LBC BCP ABA4 C ai C III D B NH 2.1 NH:NH:4:NH SC-01 III R 75 A A1B MFB BJB OBB PBB MBP LBB OLN ABA4 A ab A IA F A1 F 10.0 I:A:4:a SC-04 III R 75 A A1B MFB BJB OBB PBB MBP LBB OLN ABA4 D ab A IA F A1 F 10.0 I:A:4:a SC-05 III R NR A1 A1B MFB BJB OBB PBB -BP LBB OLN ABA4 D ab A IA F A1 F 10.0 I:A:4:a SC-09 III R 75 A A1B MFB BJB OBB PBB MBP LBN OCN IBA5 D ab A IA F A1 F 10.0 I:A:4:a SC-11 III R 75 E A1B MFB BJB OBB PBB MBP LBN OCN IBA5 NP ab A IB F A1 NH 10.0 I:A:4:NH SC-12 III R 75 A2 A1B MFB BJB OBB PBB MBP LBN OLN IBA5 A ab A IA F A1 F 10.0 I:A:4:a SC-14 III R 75 A2 B2B MFB BJB OBB PBB MBP LBN OLN IBA5 A ab A IA F A2 F 10.0 I:A:4:a SC-15 III R 75 A A1B MFB BJB OBB P-B MBP LBN OCN IBA5 D b2b A IA F A1 F 10.0 I:A:4:a SC-17 III R 75 A A1B MFB BJB OBB P-B MBP LBN JIN IBA5 A ab A IA F A1 F 10.0 I:A:4:a SC-20 III R 75 A A1B MFB BJB OBB PB-MBP LBN JIN IBA5 D ab A IA F A1 F 10.0 I:A:4:a SC-08 NO S NR B B3A JHD HKI JHI KGM PII MGI JIH GFG E b1g B1 II E7 A3 NH 2.0 NH:NH:1:NH SC-02 IV S 52/52A/80/47/54 83A/84/95 B E1B NGJ HKI JHI KGM NII MGI JIO GFG B bg B II E7 C1 NH 2.0 NH:NH:1:NH SC-06 IV S 95 B J1B JHD HKI JHI KGM PJI MGI JIH GFG B bg B II E7 C1 NH 2.0 NH:NH:1:NH SC-07 IV S 95 D I1A JHD HKI JHI KGM PJI MGI JIQ GFG B bg B II E7 C1 NH 2.0 NH:NH:1:NH SC-10 IV S 52A/79/80/47/54 75/77/83A/95 B I2A JHD HKI JHI KGM -II MGI JIH GFG B bg B II E7 C1 NH 2.0 NH:NH:1:NH SC-13 IV S 95 B1 I1B JHD HKI JHI KGM NII MGI JII GFG B bg B II E7 C1 NH 2.0 NH:NH:1:NH SC-16 IV S 95 B1 I1B JHD HKI JHI KGM PJI MGI OLI GFG B ag B II H D1 NH 2.0 NH:NH:1:NH SC-18 IV S 95 F I3B JHD HKI JHI KGM PJI MGI OLI GFG B bg B II E7 C1 NH 2.0 NH:NH:1:NH SC-19 IV S 95 B1 D1A JHD HKI JHI KGM PII MGI JOI GFG B bg B II E7 D2 NH 2.0 NH:NH:1:NH No. of types j 3 1 9 1 1 1 5 2 01 61 82 13 02 12 81 9 1 0 1 5 1 1 7 7 6 8 8 1 7 aThe strain numbers that are underlined are three isolates of a single ATCC strain. bNO, not in epidemiologically related cluster; I to IV, outbreak number; NH1/2, nursing home pseudo-outbreak. cOx r, oxacillin susceptibility test result. dColumns numbered Ia through VII give surveys of the AP-PCR data as determined in the dif ferent institutions. The three-letter code summarizes the typing results per primer used (first digit, primer 1; second digit, primer 7; third digit, primer E2). Data represented by a capital letter given in a certain column may be dif ferent from the same character in another column. Underlining in the AP-PCR datasets indicates minor dif ferences in DNA staining intensities. ePlasmid, plasmid restriction profile. NP, no plasmids. fRibotyping results obtained with Hin dIII and Cla I, respectively. gIS, insertion sequence. NH, no hybridization. hCoagulase PCR, coagulase gene PCR typing. iINT, S. intermedius biotype. jIn the cumulative number of types, subnumbers are counted as a single type number.
on May 15, 2020 by guest
http://jcm.asm.org/
Rockville, Md.). This set also contains a number of independent isolates from the Centers for Disease Control and Prevention, the S. intermedius strain, and three isolates of phage type 47/54/75/77/83A. These latter strains were isolated in three different American states during three different years.
Group SB contains strains from outbreaks I and II, eight unrelated strains, and, again, S. aureus ATCC 12600 (SB-07). Strains from outbreak I are methi-cillin resistant and were isolated at the Iowa Veterans Affairs Medical Center (18). Outbreak II was related to a contaminated anesthetic (6).
Group SC contains strains from outbreaks III and IV, an unrelated control, and ATCC 12600 (SC-03). Outbreak IV was again anesthetic related (6), al-though it differed from outbreak II. Outbreak III was caused by 10 methicillin-resistant strains in the Sepulveda Veterans Affairs Medical Center, Sepulveda, Calif. (9).
Bacterial typing studies.All isolates were typed previously by a number of
procedures (22). Antibiograms and biotypes were determined, and bacterio-phage sensitivity was assayed. Restriction fragment length polymorphisms (RFLP) were screened by using enzymatic digestion of plasmid DNA, variable-gene probes, or DNA probes derived from insertion elements (IS mapping). DNA macrorestriction fragments were separated by field inversion gel electro-phoresis (FIGE) and pulsed-field gel electroelectro-phoresis (PFGE). Multilocus en-zyme electrophoresis (MLEE) and immunoblotting were also performed, as were ribotyping and restriction enzyme analysis of PCR fragments derived from the staphylococcal coagulase gene.
PCR multicenter study design.Participants were from seven institutions: two
Belgian institutes (Hoˆpital Erasme, Brussels; and University Hospital of Ghent, Ghent), and five Dutch hospitals (University Hospital Nijmegen, Nijmegen; University Hospital Utrecht, Utrecht; Diagnostic Centre SSDZ, Delft; Free University Hospital, Amsterdam; and University Hospital Dijkzigt, Rotterdam). The study was coordinated at the Dijkzigt Hospital, where the AP-PCR assays were performed in duplicate by two individuals following slightly different ex-perimental protocols. All participants had experience in performing AP-PCR. This guarantees intralaboratory reproducibility of the assays. For this reason, the participants were also allowed to process the S. aureus DNA samples according to their own, optimized AP-PCR protocol. Results are presented anonymously, and datasets are numbered from I through VII (sets Ia and Ib derive from the coordinating laboratory).
To prevent interlaboratory variation due to different DNA extraction proto-cols, bacterial DNA, and not the organisms, was distributed from the coordinat-ing center to the participatcoordinat-ing laboratories. Primers were aliquoted in Rotterdam as well and shipped together with the DNA preparations. In this way, the variables of bacterial cultivation, DNA isolation, and primer quality were con-trolled. This implies, however, that the results obtained during this study may differ from those that would have been obtained if bacterial strains, rather than DNA, had been distributed. DNA amplification was performed in the different laboratories with the locally available equipment and PCR ingredients. Gels containing the amplified DNA were photographed, and the results were inter-preted locally according to the researchers’ individual standards. Generally, differences in the number of bands indicated a novel type. Variations in band-staining intensities were disregarded. Interpretation was performed without
knowledge of epidemiological relatedness. The fingerprint types were trans-formed in a cumulative three-letter code (one letter per type per primer) and sent to Rotterdam, where a comparative analysis was carried out. Results were studied with respect to reproducibility of the DNA fingerprints (and the accom-panying interpretation and strain grouping), relation to the results obtained by other typing procedures, and epidemiological value. When possible, data were further analyzed with Gelcompar Software (Applied Maths, Kortrijk, Belgium). Pictures were digitized with a Hewlett-Packard HP ScanJet IIc document scan-ner. After conversion and visual normalization, the data were analyzed. Degrees of homology were determined by Dice comparisons, and clustering correlation coefficients were calculated by the unweighted pair group method with arithmetic averages (UPGMA).
AP-PCR.A description of the three PCR-related procedures is given below.
This protocol served as a reference manual. Specific deviations from this proto-col are summarized per institute in Table 2.
(i) Cultivation of bacteria and isolation of DNA.Bacteria were grown in
suspension in brain heart infusion broth for 18 h at 378C. Approximately 100ml of a bacterial pellet was suspended in 150ml of 25 mM TriszHCl (pH 8.0)–50 mM glucose–10 mM EDTA. Lysostaphin (75ml of a 100-mg/ml solution) was added, and the mixture was incubated at 378C for 1 h. Spheroplasts were lysed by the addition of 1 ml of 4 M guanidinium isothiocyanate–50 mM TriszHCl (pH 6.4)–3 mM EDTA–1% (wt/wt) Triton X-100. To immobilize and purify the DNA, 50ml of a Celite suspension (0.2 g/ml; Janssen Pharmaceuticals, Beerse, Belgium) was added. The entire mixture was shaken for 15 s and incubated at room temperature for 10 min. After centrifugation, the supernatant was dis-carded; the pellet was washed once with 1 ml of lysis buffer, twice with lysis buffer without EDTA and Triton X-100; twice with 70% ethanol in water, and, finally, once with acetone. The Celite pellet was dried in vacuo. Between 100 and 400ml of 10 mM TriszHCl (pH 8.0)–1 mM EDTA was added, and DNA was eluted by incubation at 568C for 10 min, interrupted by short periods of vortexing. The supernatant containing the DNA was separated from the Celite by centrifuga-tion. The DNA concentration was determined by spectrophotometry at 260 nm, and the DNA was stored at2208C. Stock solutions of bacterial DNA were adjusted to a concentration of 5 ng/ml.
(ii) PCR.When Tth polymerase (SuperTaq; HT Biotechnology, Cambridge,
[image:4.612.63.557.83.243.2]United Kingdom) was used, the amplification conditions described below guar-anteed optimal performance for this particular enzyme. The use of other en-zymes usually required modification of the buffer conditions used during PCR (Table 2) and may lead to different AP-PCR results. PCR was performed with a buffer system containing 10 mM TriszHCl (pH 9.0), 50 mM KCl, 2.5 mM MgCl2, 0.01% gelatin, 0.1% Triton X-100, 0.2 mM deoxynucleoside triphosphates (dNTPs), 50 pmol of primer, and 0.2 U of the Tth polymerase, to which DNA was added (50 ng per amplification). The PCR mixtures were overlaid with 100ml of mineral oil. Cycling was performed in Biomed PCR machines (Model 60) and consisted of the following steps: predenaturation at 948C for 4 min followed by 35 cycles of 1 min at 948C, 1 min at 258C, and 2 min at 748C. Amplified DNA was stored at2208C. The primers used to discriminate S. aureus strains were 1 (GGTTGGGTGAGAATTGCACG), 7 (GTGGATGCGA), and ERIC2 (E2) (AAGTAAGTGACTGGGGTGAGCG) (24, 25, 28).
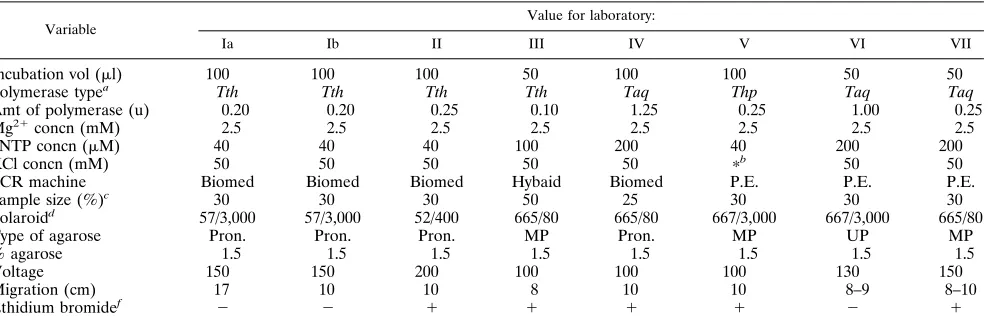
TABLE 2. Survey of experimental variables with respect to PCR fingerprinting performed in the different participating laboratories
Variable Value for laboratory:
Ia Ib II III IV V VI VII
Incubation vol (ml) 100 100 100 50 100 100 50 50
Polymerase typea Tth Tth Tth Tth Taq Thp Taq Taq
Amt of polymerase (u) 0.20 0.20 0.25 0.10 1.25 0.25 1.00 0.25
Mg21concn (mM) 2.5 2.5 2.5 2.5 2.5 2.5 2.5 2.5
dNTP concn (mM) 40 40 40 100 200 40 200 200
KCl concn (mM) 50 50 50 50 50 pb 50 50
PCR machine Biomed Biomed Biomed Hybaid Biomed P.E. P.E. P.E.
Sample size (%)c 30 30 30 50 25 30 30 30
Polaroidd 57/3,000 57/3,000 52/400 665/80 665/80 667/3,000 667/3,000 665/80
Type of agarose Pron. Pron. Pron. MP Pron. MP UP MP
% agarose 1.5 1.5 1.5 1.5 1.5 1.5 1.5 1.5
Voltage 150 150 200 100 100 100 130 150
Migration (cm) 17 10 10 8 10 10 8–9 8–10
Ethidium bromidef 2 2 1 1 1 1 2 1
a
Thp (Thermoperfect DNA polymerase; Integro, Zaandam, The Netherlands); Tth (Supertaq; Sphaero Q, Leiden, The Netherlands); Taq (Taq polymerase; Cetus,
Emeryville, Calif.). bp
, in this case no KCl was present; instead, 50 mM (NH4)2SO4was included.
c
The sample size indicates the amount of the amplification reaction that has been separated electrophoretically. d
The description of the photographs includes the type and the sensitivity in ASA values. e
Pron. (Pronarose; Hispanagar, Burgos, Spain); MP (multipurpose agarose; Boehringer Mannheim); UP (Ultra Pure Agarose, Gibco/BRL, Breda, The Netherlands). f
The presence (1) or absence (2) of ethidium bromide during the electrophoresis is indicated.
on May 15, 2020 by guest
http://jcm.asm.org/
FIG.
1.
AP-PCR
for
the
60
staphylococcal
strains
used
in
this
study.
This
figure
is
a
survey
of
the
experimental
results
belonging
to
dataset
Ia.
From
left
to
right,
the
strains
are
numbered
as
in
Table
1.
Dif
ferent
primers
are
used
in
the
three
dif
ferent
rows.
The
outer
lanes
in
all
nine
panels
contain
molecular
length
markers,
whose
sizes
are
indicated
on
the
right.
The
interpretation
of
the
banding
patterns
is
given
in
Table
1
in
column
Ia.
on May 15, 2020 by guest
http://jcm.asm.org/
(iii) Electrophoresis.Amplification products were separated by electrophore-sis in 5-mm-thick 1.5% agarose gels (Hispanagar; Sphaero Q, Leiden, The Netherlands). Gels were run in 0.53Tris-borate-EDTA (TBE) at a constant current of 100 mA for 2 h. Prior to electrophoresis, samples were mixed with a fivefold-concentrated layer mix consisting of 50% glycerol in water and 0.8 mg of bromophenol blue per ml. Then 35ml of the amplified material was loaded on the gel, and a molecular weight marker was run in parallel with the AP-PCR samples. Gels were stained after electrophoresis by addition of 10ml of ethidium bromide (10 mg/ml) to a total volume of 300 ml of 0.53TBE. The gels were photographed with a Polaroid MP4 Landcamera and Polaroid 57 High Speed films, with an exposure time of 0.125 to 0.25 s (diaphragm F5.6). Table 2 surveys the differences among the electrophoresis conditions as applied in the different laboratories.
RESULTS
PCR fingerprinting. An overview of the typing results is
given in Table 1. The AP-PCR data are displayed in separate columns, one per participating research center, except for the coordinating laboratory, where the assays were performed in duplicate (Ia and Ib). Figure 1 gives an example of a complete set of gel pictures obtained for the 60 strains with the three AP-PCR primers. Table 3 displays the number of genotypes that were detected in the participants’ laboratories. When primer 1 was used, the overall number of types varied from 10 to 17, with a mean of 14 types. The mean numbers for primers 7 and E2 were 9 and 14, respectively. With this set of strains, the discriminatory power of primers 1 and E2 is over 60% higher than that of primer 7.
The overall number of DNA bands generated per primer does not correspond to the number of detectable genotypes. Dataset IV, displaying 30 different genocodes (Tables 1 and 3) was produced from a relatively small number of DNA frag-ments synthesized: seven, five, and seven fragfrag-ments for primers 1, 7, and E2, respectively. These are smaller numbers than those found by the group describing the smallest number of genotypes (dataset Ib, with 16 types deduced from fingerprints consisting of 9, 9, or 11 bands for individual fingerprints). The maximum number of bands was observed when primer 1 was used. The mean score for this primer, averaged among the groups, is 11.4 DNA fragments. For primers 7 and E2, these numbers are 6.6 and 9.6 fragments, respectively. There is no apparent variation in the average length of the fragments, as demonstrated by a survey of the cumulative results obtained by application of primer 1 (Fig. 2). Although most of the types were found in all the laboratories, some additional bands gave rise to additional genotypes.
Discordant results can be observed. The data obtained with primer E2 seemed to be the most variable (results not shown). When the overall number of combined genocodes is
consid-ered, major differences among laboratories are encountered. The number of types varies between 16 and 30, with a mean of 22 types identified.
When the lengths of the DNA fragments generated by the individual PCR tests were investigated, primer 1 was found to generate amplicons with an overall length of approximately 11,000 bp. For primers 7 and E2, these values are 4,000 and 5,500 bp, respectively. These differences are not reflected in the overall number of detectable PCR types (which is 14 for both primers 1 and E2). Primer 7, which detected the smallest number of types, is also associated with the shortest cumulative length of the DNA fragments synthesized. There is an appar-ent variation in the number and size of fragmappar-ents generated per primer species. For primer 1, this number varies from 6.4 to 11.4 on average. The numbers for primers 7 and E2 are 3.7 to 6.6 and 6.0 to 9.6, respectively. In general, fragments vary in length from 0.15 to over 2 kbp.
Epidemiological considerations.Analysis of the strains from
outbreak IV illustrates that the data obtained by five of seven laboratories group these isolates into a homogeneous genotype that is not encountered in the rest of the collection, with the exception of a single strain (SC-08). These data are similar to those obtained by oxacillin susceptibility testing, plasmid typ-ing, ribotyptyp-ing, PFGE, FIGE, immunoblotttyp-ing, IS mapptyp-ing, PCR typing and RFLP mapping (22). Two of the seven labo-ratories detected three to six different types in this group of eight bacterial isolates. The results collected for the strains from outbreak III are similar. In this case, four of seven data-sets demonstrated the homogeneity of this subgroup. Three participants identified two or three different types. Interest-ingly, in two of these laboratories, where the same subtypes are established, the differences were limited to data obtained by only one of the PCR primers. Again, the PCR data are in general agreement with those obtained by the other typing techniques. The four strains from outbreak II are split into two types: three are identical (five of seven laboratories) or very similar (two of seven laboratories), whereas a single strain (SB-11) appears to be different. The other datasets confirm this observation. Results with strains from outbreak I and the nursing home (NH1 and NH2) conform to those of the other typing procedures. Since 19 non-outbreak-related strains are included in the collection, this implies that the resolution of PCR fingerprinting varies from approximately 50% to nearly 90%, since between 9 and 16 unique types were identified depending on the institution. It is assumed that all 19 non-outbreak-related strains are indeed genetically independent.
Typeability and reproducibility.All strains were typeable by
PCR. Four of seven laboratories obtained 100% typeability; negative results seen by other participants were due to techni-cal inadequacy not related to bacterial genome structure. The overall mean level of typeability was 99.5%. This makes PCR-mediated typing preferable in principle over phage typing, plasmid typing, some of the RFLP approaches, and IS map-ping, which all leave an appreciable percentage of strains un-typed.
Discriminatory power.PCR fingerprinting was not able to
detect differences between strain SA-12, SA-18, and SA-20. These strains are also identical by phage typing, ribotyping, PFGE, and IS mapping. Since these strains were derived from diverse origins, it seems likely that certain clones of S. aureus spread easily and remain genotypically constant. On the other hand, several other strains belonging to the same phagovar are differentiated by the PCR tests. As has been argued previously (25), PCR fingerprinting provides additional discrimination over that provided by phage typing.
[image:6.612.58.298.101.235.2]The participants who detected the smallest number of types
TABLE 3. Number of genetic variants detected with the individual PCR primers as independently documented by the
seven participating laboratories
Participating center
No. detected
with primer: Overall no.
No. of unique strains
1 7 E2
Ia 14 8 11 20 13
Ib 10 11 11 16 9
II 15 10 13 18 12
III 16 7 17 21 16
IV 17 10 16 30 15
V 13 7 14 21 11
VI 15 12 17 28 15
VII 10 7 12 19 11
Mean 14 9 14 22 13
on May 15, 2020 by guest
http://jcm.asm.org/
(n 5 16) clustered 37 of 40 epidemiologically linked strains (including the NH1 and NH2 strains) correctly; however, 8 of the 20 unrelated isolates could not be distinguished from strains within the outbreak groups. When the dataset display-ing the maximal number of PCR types (n530) was evaluated, 29 of 40 strains were clustered. This is not an improvement when compared with the least discriminative data. Among the 20 unrelated strains, six genotypes were detected which were also found among the epidemiologically linked strains. Appar-ently, the rise in the absolute number of detectable PCR gen-otypes adversely affects the correlation with the epidemiolog-ical data.
Comparison with PFGE.PFGE is currently considered to be
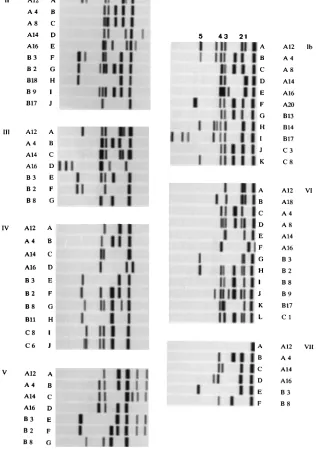
[image:7.612.148.464.87.536.2]one of the most reliable and reproducible typing procedures, allowing the detection of a high degree of DNA polymorphism (15). PCR and PFGE data were compared; the results are described in Table 4. First, the PCR codes for the two groups detecting the largest (dataset IV) and the smallest (dataset Ib) number of types were simplified. The three-letter code was condensed into a single digit, and new types were defined only when more than one individual AP-PCR assay gave a different result. In case of a single change (from AAA to AAC, for instance) subtypes were defined. The results for set Ib were rearranged into 11 types and 5 subtypes, and the data for set IV FIG. 2. Survey of unique PCR fingerprints as generated by amplification of staphylococcal DNA by primer 7. In panels Ib through VII, a survey of the unique banding patterns as observed by the various participants is represented schematically. Strain numbers and single-character PCR genocodes are indicated alongside the separate panels, as in Table 1. The migration distance of the DNA fragments in panels Ib, VI, and VII is different from those in panels II to V. For reasons of comparison, some of the common bands are identified with a number (1 through 5) above the panels. Dataset Ia has not been included in this comparison; in dataset VII, pattern B9has been omitted because of its similarity to pattern B.
on May 15, 2020 by guest
http://jcm.asm.org/
defined 15 types and 9 subtypes. PFGE recognized 11 types (A through K) and 5 subtypes, equaling the numbers detected in the set Ib experiments. Nearly full epidemiological agreement exists between these latter data and PFGE results. The only difference occurs for the NH1 outbreak: PFGE found three instead of the expected two types (isolate 14 is also recognized as a deviant type by other procedures). The set IV data sub-divide strains from outbreak I and IV and, as such, give rise to an overestimation of the number of types.
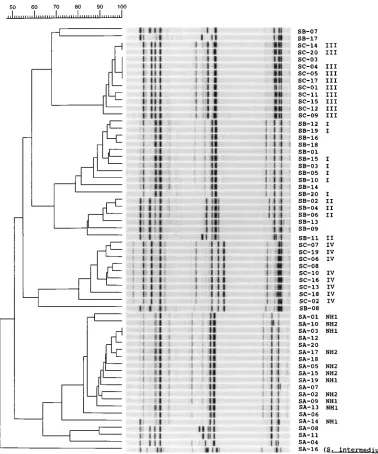
Gelcompar analysis.Gelcompar analysis of the results was
disappointing. Of eight datasets, only four were accessible to scanning reproduction. Of these four datasets, only one could be used for successful phylogenetic analysis. The other three composite pictures could not be analyzed because of lack of contrast, excessive smiling of the gels, and low-resolution pho-tography. In the single instance in which an interpretable phy-logenetic tree could be constructed, it appeared that the result was in agreement with visual inspection and epidemiological data (Fig. 3). The four sets of outbreak-related strains were clustered with homology percentages from 79 up to 93%, when data gathered with the three primers were combined. Clearly, Gelcompar analysis is heavily influenced by electrophoretic and photographic artifacts.
DISCUSSION
Approximately 5 years ago, PCR-mediated procedures en-abling genome scanning by random amplification of polymor-phic DNA were discovered (29, 31). AP-PCR can be used for genetic characterizations and comparisons even among closely related bacterial species and isolates (1, 20, 21, 24–26, 28, 30). The procedure is used with increasing frequency, facilitated by general applicability and high speed. However, only a limited number of studies have compared the effectiveness of AP-PCR typing with that of other microbiological typing procedures (4, 7, 16, 19–21, 24, 25). In the field of staphylococcal typing, numerous studies describe conventional or molecular elucida-tion of clonality or epidemiological relatedness. Recently, this was combined in a comparative study on typing of a large panel of S. aureus isolates (22).
The overall conclusion from the present data is that AP-PCR adequately clusters strains isolated from given outbreaks. On the other hand, considerable differences between the re-sults from different laboratories have been encountered. This is reflected by the number of isolates that are identified by a unique genotype. This number varies from 9 to 16, and partic-ipants who detect more than one type among epidemiologically clustered strains score relatively highly in this respect. It has to be emphasized that during this study, several of the experi-mental parameters were standardized. In this respect, it is noteworthy that a relatively high degree of heterogeneity be-tween laboratories was encountered as a result of this limited number of additional variables (Table 2). Including the DNA isolation protocol in the multicenter approach would most probably have led to an even lower degree of interlaboratory reproducibility.
[image:8.612.60.293.92.692.2]In the single multicenter AP-PCR typing study that has been described to date (17), the time- and cost-effectiveness of PCR typing were investigated. This study demonstrated that success-ful AP-PCR depends heavily on the optimal use of PCR pro-tocols (see, for instance, reference 5). For this reason, it was decided not to study the intralaboratory reproducibility of the AP-PCR tests. These items have been addressed in previous studies (7, 21, 23–26). However, the fact that epidemiological clusters of strains generate identical DNA-banding patterns upon DNA amplification is evidence of at least a reasonable
TABLE 4. Comparison of PCR fingerprinting and PFGE on the basis of simplified genetic codes for the PCR assaya
Strain
PCR code Simplified code
PFGE code
Ib IV Ib IV
A16 FEF FDF 1 1 I
A4 BBB BBB 2 2 E
A12 AAA AAA 3 3 J
A18 AAA AAA 3 3 J
A20 AAA AAA 3 3 J
A6 AAC AAA 3a 3 C
A7 AAC CAA 3a 3a B
A8 CCD DBC 4 4 G
A11 CCD DBD 4 4a F
A1 AAA AAA 3 3 K1
A9 AAA AAA 3 3 K2
A3 AAA AAA 3 3 A
A13 AAA AAA 3 3 A
A14 EDE -CE 5 5 H
A19 AAA AAA 3 3 K3
A17 AAA AAA 3 3 A
A2 AAA AAA 3 3 A
A15 AAA AAA 3 3 A
A5 AAA AAA 3 3 A
A10 DAA EAA 3b 3b D
B7 BBB BBH 2 2a D
B3 AAA AE- 3 3c A
B5 AAA AEA 3 3c A
B10 AAA AEA 3 3c A
B12 AAA AEL 3 6 A1
B15 AAA AEL 3 6 A
B19 AAA AEL 3 6 A
B20 AAA AEL 3 6 A
B1 AAA AEA 3 3c A1
B16 AAA AEL 3 6 A1
B18 AAA AEK 3 6 A
B17 JIM LCO 6 7 E
B14 AHL AAN 7 3d A2
B8 HBI IGI 8 8 F
B2 GFH GFG 9 9 B
B4 GFH HFG 9 9a B
B6 GFH HFG 9 9a B
B11 GFK KHK 9a 10 C
B9 IDJ JBJ 10 11 B
B13 GGJ RBM 11 12 B1
C3 BJB OBP 2a 13 C
C1 BJB MBP 2a 13a A
C4 BJB MBP 2a 13a A
C5 BJB -BP 2a 13a A
C9 BJB MBP 2a 13a A
C11 BJB MBP 2a 13a A
C12 BJB MBP 2a 13a A
C14 BJB MBP 2a 13a A
C15 BJB MBP 2a 13a A
C17 BJB MBP 2a 13a A
C20 BJB MBP 2a 13a A
C8 HKI PII 2a 14 B1
C2 HKI NII 8a 14a B
C6 HKI PJI 8a 15 B
C7 HKI PJI 8a 15 B
C10 HKI -II 8a 14a B
C13 HKI NII 8a 14a B
C16 HKI PJI 8a 15 B
C18 HKI PJI 8a 15 B
C19 HKI PII 8a 14 B
a
The datasets Ib and IV have been simplified by changing three-letter codes into one-letter codes. New types were defined when at least two characters from the three-letter code had changed; single assay changes result in subtyping (a through d). Strain numbering is as in Table 1.
on May 15, 2020 by guest
http://jcm.asm.org/
degree of intralaboratory reliability. Upon reamplification of some of the DNA samples, as performed in two of the partic-ipating laboratories, AP-PCR profiles appeared to be repro-ducible.
Reproducibility was affected by the nature of the primer used and the identity of the intratube thermoprofile. Isolates SA-04, SB-07, and SC-03, all of which were S. aureus ATCC 12600, were included in the three sets of strains to evaluate the reproducibility of AP-PCR. Only one of the participating lab-oratories unequivocally identified all three strains to belong to a single genotype. It must be emphasized that the other typing procedures also detected gross differences among these three particular isolates. It has been demonstrated previously that genetic variability as measured by PCR can be a consequence
[image:9.612.113.491.69.523.2]of repeated conservation and ‘‘reviving’’ of strains; this is prob-ably due to replication defects or the absence or presence of lytic phages (3). This might be an explanation for the extensive variability encountered among the ATCC strains. PFGE, for instance, corroborates the PCR data in six of seven PCR data-sets by designating genotypes E, D, and C. Plasmid types are also very different: B, D, and C are the indexes. This, in com-bination with other experimental results, may be indicative of intrastrain heterogeneity or sampling error. Computerized cor-rection of AP-PCR artifacts is currently under development (13, 14). It is particularly important to implement this ap-proach, which takes reproducibility and erroneous amplifica-tion into account, when multicenter studies are performed. However, on the basis of the results of the present study, it is FIG. 3. Gelcompar analysis of dataset Ia. The pictures shown in Fig. 1 have been digitized by scanning procedures. All three AP-PCR DNA-banding patterns have been combined into one single lane. The degree of homology was subsequently calculated by Dice comparisons, and correlation coefficients were determined by the unweighted pair group method with arithmetic averages. The strain code as presented in Table 1 is shown on the right, together with the deduced three-digit genocode (column Ia, Table 1) and the epidemiological clustering.
on May 15, 2020 by guest
http://jcm.asm.org/
expected that interinstitute standardization will be very hard to achieve.
PCR typing is currently restricted to laboratories with ap-propriate equipment and experimental expertise. In this re-spect, the applicability of AP-PCR is as yet limited. It is clear from the present study that generation and interpretation of PCR data are likely to vary among laboratories. The percent-age of variant types identified can be on the order of 27 to 50%, based on the application of three PCR tests and a single DNA-processing protocol. The variables that still exist be-tween laboratories (Table 2) must be responsible, at least in part, for these large discrepancies. From the duplicate exper-iments performed in Rotterdam, it was concluded that gel electrophoresis is a major cause of experimental variability; this has been confirmed by a recent report (10). An increase in electrophoresis time led to improved separation, which in turn enabled successful digitization and Gelcompar analysis. It is also acknowledged that the present study suffers from the fact that DNA isolation and primer quality were standardized. If this had not been the case, differences between laboratories may have been even larger.
AP-PCR shares characteristics with the genome-scanning capacities of electrophoretic techniques such as PFGE and FIGE. These last two procedures identify epidemiological re-lations for staphylococci that are in good agreement with the present data (Table 4). Recently, guidelines for interpretation of PFGE patterns for outbreak investigations were proposed by an American working group (8). Since these rules have been used to define staphylococcal subtypes in the collection used in the previous and present studies (22), our PCR data may enable the development of similar rules for the definition of PCR subtypes. The rules should be based either on differences within the banding pattern generated during a single PCR or on differences in composite genocodes as presented in Table 1 and simplified in Table 4. The present study indicates that differences in the combined results of multiple AP-PCR assays are better indicators of genetic variability than are the results of individual assays. It is clear, however, that PFGE subtypes do not fully match the subtypes as defined by PCR. It is ad-visable to perform model studies starting with PFGE-uniform strains on the one hand and PCR-uniform strains on the other hand. For studies such as these, it is also important to start the analysis with a collection comparable to the set of strains in this study: it should provide a mixture of unique, solitary isolates together with epidemiologically well-defined clusters.
Our data demonstrate that PCR fingerprinting deserves a position among the procedures that are well suited for the epidemiological analysis of S. aureus. The procedure seems particularly appropriate for the high-speed typing of nosoco-mial isolates. This conclusion was also drawn previously (2); on the basis of theoretical considerations, it was suggested that AP-PCR is a cost-effective procedure as well. It is necessary to test multiple primers, since differences in discriminatory power are to be expected. Strain-specific amplicons can be generated quite easily, even among clonally related isolates of S. aureus. With the exclusion of subtype numbering for the other typing strategies, AP-PCR generates the largest number of individual types. It exceeds the resolution of PFGE, which detects 11 types and 5 subtypes. Only phage typing and RFLP mapping approach the average number of types detectable by AP-PCR. It must be emphasized, however, that the generation of exces-sive numbers of types introduces the possibility that the rela-tionship between the AP-PCR data and epidemiological char-acteristics will start to deteriorate.
Finally, we recommend establishing collections like the one used in this and the previous study (22) for other
microorgan-isms as well. The availability of these strains enables the indi-vidual researcher to establish the value of newly developed typing tools or to use these strains as internal controls in typing studies. Well-documented collections or experimental proto-cols can be used for standardization of typing procedures (27), an initiative important for the development of international standards on genetic relatedness or clonality among patho-genic microorganisms.
REFERENCES
1. Akopyanz, N., N. O. Bukanov, T. U. Westblom, S. Krurovich, and D. E. Berg. 1992. DNA diversity among clinical isolates of Helicobacter pylori detected by PCR-based RAPD fingerprinting. Nucleic Acids Res. 20:5137–5142. 2. Bingen, E. 1994. Applications of molecular methods to epidemiologic
inves-tigations of nosocomial infections in a pediatric hospital. Infect. Control Hosp. Epidemiol. 15:488–493.
3. Brikun, I., K. Suziedelis, and D. E. Berg. 1994. DNA sequence divergence among derivatives of Escherichia coli K-12 detected by PCR-based RAPD fingerprinting. J. Bacteriol. 176:1673–1682.
4. Brousseau, R., A. Saint-Onge, G. Prefontaine, L. Masson, and J. Cabana. 1993. Arbitrary primer polymerase chain reaction, a powerful method to identify Bacillus thuringiensis serovars and strains. Appl. Environ. Microbiol.
59:114–119.
5. Caetano-Anolles, G., B. J. Bassam, and P. M. Gresshoff. 1994. Buffer com-ponents tailor DNA amplification with arbitrary primers. PCR Methods Applic. 4:59–61.
6. Centers for Disease Control. 1990. Postsurgical infections associated with an extrinsically contaminated intravenous anaesthetic agent—California, Illi-nois, Maine, Michigan, 1990. Morbid. Mortal. Weekly Rep. 39:426–433. 7. Elaichouni, A., G. Verschraegen, G. Claeys, M. de Vleeschouwer, C. Godard,
and M. Vaneechoutte.1994. Pseudomonas aeruginosa serotype O12 outbreak
studied with arbitrary primer PCR. J. Clin. Microbiol. 32:666–671. 8. Goering, R. V. 1994. Defining inter-isolate relationships between bacterial
isolates by use of PFGE of DNA macrorestriction fragments, abstr. F19. In Abstracts of the International Meeting on Bacterial Epidemiological Mark-ers.
9. Goetz, M. B., M. E. Mulligan, R. Kwok, H. O’Brien, C. Caballes, and J. P.
Garcia.1992. Management and epidemiologic analyses of an outbreak due
to methicillin resistant Staphylococcus aureus. Am. J. Med. 92:607–614. 10. He, G., C. S. Prakash, R. L. Jarret, S. Tuzun, and J. Qiu. 1994. Comparison
of gel matrices for resolving PCR amplified DNA fingerprint profiles. PCR Methods Applic. 4:50–51.
11. Jarvis, W. R. 1994. Usefulness of molecular epidemiology for outbreak investigations. Infect. Control Hosp. Epidemiol. 15:500–503.
12. Kloos, W. E., and W. D. Lambe, Jr. 1991. Staphylococcus, p. 222–227. In A. Balows, W. J. Hausler, K. L. Herrman, H. D. Isenberg, and H. J. Shadomy (ed.), Manual of clinical microbiology, 5th ed. American Society for Micro-biology, Washington, D.C.
13. Lamboy, W. F. 1994. Computing genetic similarity coefficients from RAPD data: the effects of PCR artifacts. PCR Methods Applic. 4:31–37. 14. Lamboy, W. F. 1994. Computing genetic similarity coefficients from RAPD
data: correcting for the effects of PCR artifacts caused by variation in ex-perimental conditions. PCR Methods Applic. 4:38–43.
15. Maslow, J. N., M. E. Mulligan, and R. D. Arbeit. 1993. Molecular epidemi-ology: the application of contemporary techniques to typing bacteria. Clin. Infect. Dis. 17:153–162.
16. Mazurier, S., A. Audurier, N. Marquet-Van der Meer, S. Notermans, and K.
Wernars.1992. A comparative study of randomly amplified polymorphic
DNA analysis and conventional phage typing for epidemiological studies of
Listeria monocytogenes isolates. Res. Microbiol. 143:507–512.
17. Penner, G. A., A. Bush, R. Wise, L. Domier, K. Kasha, A. Laroche, G. Scoles,
S. J. Molnar, and G. Fedak.1993. Reproducibility of random amplified
polymorphic DNA (RAPD) analysis among laboratories. PCR Methods Applic. 2:341–345.
18. Pfaller, M. A., D. S. Wakefield, R. Hollis, M. Fredrickson, E. Evans, and
R. M. Massanari.1991. The clinical microbiology laboratory as an aid in
infection control. The application of molecular techniques in epidemiologic studies of methicillin-resistant Staphylococcus aureus. Diagn. Microbiol. In-fect. Dis. 14:209–217.
19. Ralph, D., M. McClelland, J. Welsh, G. Baranton, and P. Perolat. 1993.
Leptospira species categorized by arbitrarily primed polymerase chain
reac-tion (PCR) and by mapped restricreac-tion polymorphisms in PCR-amplified rRNA genes. J. Bacteriol. 175:973–981.
20. Saulnier, P., C. Bourneix, G. Prevost, and A. Andremont. 1993. Random amplified polymorphic DNA assay is less discriminant than pulsed-field gel electrophoresis for typing strains of Staphylococcus aureus. J. Clin. Microbiol.
31:982–985.
21. Struelens, M., R. Bax, A. Deplano, W. Quint, and A. van Belkum. 1993. Concordant clonal delineation of methicillin-resistant Staphylococcus aureus by macrorestriction analysis and polymerase chain reaction genome
on May 15, 2020 by guest
http://jcm.asm.org/
printing. J. Clin. Microbiol. 31:1964–1970.
22. Tenover, F. C., R. Arbeit, G. Archer, J. Biddle, S. Byrne, R. Goering, G.
Hancock, G. A. Hebert, B. Hill, R. Hollis, W. R. Jarvis, B. Kreiswirth, W. Eisner, J. Maslow, L. K. McDougal, J. M. Miller, M. Mulligan, and M. A.
Pfaller.1994. Comparison of traditional and molecular methods of typing of
Staphylococcus aureus. J. Clin. Microbiol. 32:407–415.
23. Van Belkum, A. 1994. DNA fingerprinting of medically important microor-ganisms by PCR. Clin. Microbiol. Rev. 7:174–184.
24. Van Belkum, A., R. Bax, and G. Prevost. 1994. Comparison of four geno-typing assays for epidemiological study of methicillin resistant
Staphylococ-cus aureus. Eur. J. Clin. Microbiol. Infect. Dis. 13:420–424.
25. Van Belkum, A., R. Bax, P. Peerbooms, W. Goessens, N. van Leeuwen, and
W. Quint.1993. Comparison of phage typing and DNA fingerprinting by
PCR for discrimination of methicillin-resistant Staphylococcus aureus iso-lates. J. Clin. Microbiol. 31:798–803.
26. Van Belkum, A., and J. Meis. 1994. Polymerase chain reaction mediated DNA fingerprinting in bacterial epidemiology. Clin. Infect. Dis. 18:1017– 1018.
27. Van Embden, J. D. A., M. D. Cave, J. T. Crawford, J. W. Dale, K. D.
Eisenach, B. Gicquel, P. W. M. Hermans, C. Martin, R. McAdam, T. M.
Shinnick, and P. M. Small.1993. Strain identification of Mycobacterium
tuberculosis by DNA fingerprinting: recommendations for a standardized
methodology. J. Clin. Microbiol. 31:406–409.
28. Versalovic, J., T. Koeuth, and J. R. Lupski. 1991. Distribution of repetitive DNA sequences in eubacteria and application to fingerprinting of bacterial genomes. Nucleic Acids Res. 19:6823–6831.
29. Welsh, J., and M. McClelland. 1990. Fingerprinting genomes using PCR with arbitrary primers. Nucleic Acids Res. 18:7213–7218.
30. Welsh, J., C. Pretzman, D. Postic, I. Saint-Girons, G. Baranton, and M.
McClelland.1992. Genomic fingerprinting by arbitrarily primed polymerase
chain reaction resolves Borrelia burgdorferi to three distinct phyletic groups. Int. J. Syst. Bacteriol. 42:370–377.
31. Williams, J. G. K., A. R. Kubelik, K. J. Livak, J. A. Rafalski, and S. V.
Tingey.1990. DNA polymorphisms amplified by arbitrary primers are useful
as genetic markers. Nucleic Acids Res. 18:6531–6535.