Ectopic expression of KCNE3 accelerates
cardiac repolarization and abbreviates the QT
interval
Reza Mazhari, … , Raimond L. Winslow, Eduardo Marbán
J Clin Invest.
2002;
109(8)
:1083-1090.
https://doi.org/10.1172/JCI15062
.
Regulatory subunit KCNE3 (E3) interacts with KCNQ1 (Q1) in epithelia, regulating its
activation kinetics and augmenting current density. Since E3 is expressed weakly in the
heart, we hypothesized that ectopic expression of E3 in cardiac myocytes might abbreviate
action potential duration (APD) by interacting with Q1 and augmenting the delayed rectifier
current (I
K). Thus, we transiently coexpressed E3 with Q1 and KCNE1 (E1) in Chinese
hamster ovary cells and found that E3 coexpression increased outward current at potentials
by ≥ –80 mV and accelerated activation. We then examined the changes in cardiac
electrophysiology following injection of adenovirus-expressed E3 into the left ventricular
cavity of guinea pigs. After 72 hours, the corrected QT interval of the electrocardiogram was
reduced by
~
10%. APD was reduced by >3-fold in E3-transduced cells relative to controls,
while E-4031–insensitive I
Kand activation kinetics were significantly augmented. Based on
quantitative modeling of a transmural cardiac segment, we demonstrate that the degree of
QT interval abbreviation observed results from electrotonic interactions in the face of limited
transduction efficiency and that heterogeneous transduction of E3 may actually potentiate
arrhythmias. Provided that fairly homogeneous ectopic ventricular expression of regulatory
subunits can be achieved, this approach may be useful in enhancing repolarization and in
treating long QT syndrome.
Article
Genetics
Find the latest version:
http://jci.me/15062/pdf
Introduction
Long QT (LQT) syndrome is associated with cardiac arrhythmias and sudden cardiac death (1). LQT syn-drome is characterized by QT interval prolongation on the electrocardiogram (ECG). This syndrome can be familial, as either an autosomal recessive or a dom-inant trait, or acquired (1). While myocardial ischemia and cardiomyopathy are among the heart diseases that cause LQT syndrome, use of medica-tions such as antibiotics can also lead to it (2). Muta-tions in genes encoding ion channels, leading to abnormal channel function, are the main cause of the heritable form of this disorder (3). Among these genes are pore-forming potassium channel α sub-units KCNH2 (encoding HERG) and KCNQ1 (encod-ing KvLQT1) (3). KCNH2 and KCNQ1 (Q1) are responsible for rapidly activating delayed rectifier potassium currents (IKr) and slowly activating delayed
rectifier potassium currents (IKs), respectively. While
the majority of mutations linked to LQT syndrome are associated with α subunits, genetic lesions in
accessory subunits, such as the KCNE family of pep-tides, also contribute to LQT syndrome. For example, mutations in both KCNE1 (4) (encoding MinK) and KCNE2 (5) (encoding MinK-related peptide 1 [MiRP1]), which regulate IKs and IKr in the heart,
respectively, have been linked to LQT syndrome in patients. Unfortunately, therapeutic approaches for correction of electrical abnormalities associated with LQT syndrome are limited and not very effective.
Recently, Schroeder et al. (6) reported that KCNE3 (encoding MiRP2) could coassemble with Q1 in cul-tured cells and result in a rapidly activating, constitu-tively open channel. KCNE3 (E3) is abundantly expressed in skeletal muscle (7), kidney, and intestine (8), while it is weakly expressed (if at all) in the heart (6, 9). It has been postulated that E3 has a role in reg-ulating chloride secretion in epithelia through cystic fibrosis transmembrane conductance regulators (10). Abbott et al. showed that E3 plays a major role in reg-ulating skeletal muscle function, and mutations in E3 are associated with periodic paralyses (7). Since there
Ectopic expression of KCNE3 accelerates cardiac
repolarization and abbreviates the QT interval
Reza Mazhari,
1,2H. Bradley Nuss,
1,2Antonis A. Armoundas,
1,2,3Raimond L. Winslow,
2,3and Eduardo Marbán
1,2,31Department of Medicine,
2Institute of Molecular Cardiobiology, and
3Whitaker Biomedical Engineering Institute and Center for Computational Medicine and Biology,
Johns Hopkins University, Baltimore, Maryland, USA
Address correspondence to: Eduardo Marbán, Institute of Molecular Cardiobiology, Johns Hopkins School of Medicine, 720 Rutland Avenue, Ross Building 844, Baltimore, Maryland 21205, USA.
Phone: (410) 955-2776; Fax: (410) 955-7953; E-mail: [email protected].
H. Bradley Nuss’s present address is: Cardiology Research Group, University of Maryland School of Medicine, Baltimore, Maryland, USA.
Received for publication January 16, 2002, and accepted in revised form March 11, 2002.
Regulatory subunit KCNE3 (E3) interacts with KCNQ1 (Q1) in epithelia, regulating its activation kinetics and augmenting current density. Since E3 is expressed weakly in the heart, we hypothe-sized that ectopic expression of E3 in cardiac myocytes might abbreviate action potential dura-tion (APD) by interacting with Q1 and augmenting the delayed rectifier current (IK). Thus, we transiently coexpressed E3 with Q1 and KCNE1 (E1) in Chinese hamster ovary cells and found that E3 coexpression increased outward current at potentials by ≥–80 mV and accelerated acti-vation. We then examined the changes in cardiac electrophysiology following injection of aden-ovirus-expressed E3 into the left ventricular cavity of guinea pigs. After 72 hours, the corrected QT interval of the electrocardiogram was reduced by ∼10%. APD was reduced by >3-fold in E3-transduced cells relative to controls, while E-4031–insensitive IKand activation kinetics were sig-nificantly augmented. Based on quantitative modeling of a transmural cardiac segment, we demonstrate that the degree of QT interval abbreviation observed results from electrotonic inter-actions in the face of limited transduction efficiency and that heterogeneous transduction of E3 may actually potentiate arrhythmias. Provided that fairly homogeneous ectopic ventricular expression of regulatory subunits can be achieved, this approach may be useful in enhancing repo-larization and in treating long QT syndrome.
is a low abundance of E3 in the cardiac tissue, we hypothesized that ectopic expression of E3 in cardiac myocytes might abbreviate action potential duration (APD) by interacting with Q1 and augmenting the delayed rectifier current. Our results show that aden-oviral gene delivery of E3 results in an increase in out-ward current, abbreviates APD in cardiac myocytes, and shortens the QT interval of the ECG in trans-duced animals. However, quantitative modeling points out potential pitfalls of such an approach if transduction is inhomogeneous.
Methods
The work presented was performed in accordance with NIH guidelines for the care and use of laboratory ani-mals and the guidelines of the Animal Care and Use Committee of the Johns Hopkins University.
Plasmid and adenovirus construction. Human KCNE3 cDNA (GenBank accession no. AF302494) was obtained by RT-PCR (GIBCO BRL; Invitrogen, Carls-bad, California, USA) from human RNA and cloned into the multiple cloning site of the expression vec-tor pCGI (11) (pCGI-KCNE3) and adenovirus shuttle vector AdCGI (AdCGI-KCNE3). Both of these vectors are bicistronic constructs (through an internal ribo-some entry site) driven by a cytomegalovirus pro-moter and carrying green fluorescent protein (GFP) as a reporter. Detailed methods of adenovirus vector construction have been described previously (12–14). Briefly, adenovirus vectors were generated using Cre-lox recombination of purified Ψ5 viral DNA and shuttle vector AdCGI-KCNE3 (13). The recombinant vectors were plaque-purified, expanded, and purified using cesium chloride gradients, yielding concentra-tions of about 8 × 10¹⁰plaque-forming units (PFUs)
per milliliter.
Transient transfections. Chinese hamster ovary (CHO) K1 cells (American Type Culture Collection, Manassas, Virginia, USA) were transiently transfected with KCNQ1 (kindly provided by M. Sanguinetti, Universi-ty of Utah, Salt Lake CiUniversi-ty, Utah, USA) or KCNQ1-KCNE1 (kindly provided by G.F. Tomaselli, Johns Hopkins University) and pCGI-KCNE3 (when indicat-ed), with 1 µg total cDNA using Lipofectamine-Plus (GIBCO BRL; Invitrogen), following the manufactur-er’s instructions. GFP-positive cells were studied with-in 24–36 hours of transfection.
In vivo and ex vivo transductions. Adenovirus (AdCGI-KCNE3; 90–100 µl, equivalent to ∼109 PFUs) was
injected, at a rate of about 50–80 µl/s using a 30-gauge needle, in the left ventricular cavity of isoflurane-anes-thetized female guinea pigs (280–340 g), while the aorta and pulmonary artery were clamped for 50–60 seconds (15). This resulted in 10–20% cardiomyocyte transduction efficiency in the left ventricular wall as determined by fraction of green cells after enzymatic cell isolation. In some experiments, as indicated, fresh-ly isolated rabbit left ventricular myocytes were trans-duced in vitro using the same virus, while cultured in
M199 media with 2% FBS, 1% streptomycin/penicillin (all GIBCO BRL; Invitrogen). The myocytes were washed with virus-free medium after 1 hour and incu-bated at 37°C and 5% CO2(16).
Current and action potential recordings. Sixty-five to sev-enty-two hours after in vivo injection, myocytes from the left ventricles of guinea pigs were isolated using enzymatic digestions as described previously (12). Action potentials were recorded from the ex vivo trans-duced rabbit cells within 24–36 hours after transduc-tion. Membrane currents and action potentials were recorded using whole-cell patch clamp, in GFP-posi-tive myocytes. Cells were bathed in solution contain-ing (in mmol/l): 140 NaCl, 5.4 KCl, 1 MgCl2, 10
HEPES, 10 glucose, pH 7.4 (adjusted with NaOH). For current or action potential recordings, 0.1 or 2 mmol/l CaCl2, respectively, was added to the bath solution. For
delayed rectifier potassium current (IK) recordings, 0.2
mmol/l CdCl2and 0.5 mmol/l BaCl2were added to the
bath solution; IKrwas blocked, as indicated, with 5 µmol/l E-4031. Sodium currents were inactivated in the native cells by using holding potentials of –40 mV. Borosilicate glass pipettes were pulled and fire-pol-ished to final tip resistances of 4–5 MΩwhen filled with pipette solution containing (in mmol/l): 140 K-glutamate, 1 MgCl2, 10 HEPES, 5 EGTA, 4 MgATP,
pH 7.3 (adjusted with KOH). This resulted in a liquid junction potential of –18 mV; here, results are not cor-rected for this value, unless stated otherwise. Uncom-pensated capacitance currents in response to small hyperpolarizing voltage steps were recorded for off-line integration as a means of measuring cell capaci-tance. All CHO-cell recordings were obtained at room temperature, while experiments on cardiomyocytes were performed at 37°C.
Voltage protocols used in this study are described in the text where necessary; action potentials were initiat-ed by a short depolarizing current pulse (2 ms, 100–300 pA, 10–15% over the threshold) using the voltage-fol-lower mode while sampling at 2 kHz.
ECGs. Body surface ECGs were recorded within 2 hours after operation (baseline) and 65–72 hours (day 3) after adenovirus injection, under similar con-ditions, as previously described (12). Measured QT intervals were corrected (QTc) for heart rate using the square-root method as described previously (17).
Mathematical modeling. A detailed description of the model of electrical propagation in ventricular tissue has been published previously (18). The geometry of the integrative model used here was assumed, for sim-plification, to be a three-dimensional fiber (3 × 70 × 3 nodes, with 0.2 mm resolution), representing a trans-mural segment of the left ventricular wall (see Figure 6a). At each node, an experimentally derived detailed biophysical model of the cardiac action potential was used to represent each myocyte (19). IKs(20),
data, with a smooth transition between the layers, to simulate in vivo action potential morphology and duration accurately (see Figure 6, a and b). This model resulted in transmural repolarization time (activation time + time to 90% repolarization) and APD patterns that match in vivo findings accurately (see Figure 6b). Ionic current associated with Q1-E3 coexpression, based on experimental observations, was added as a new current in a certain percentage of the nodes with-in the geometry, to simulate the approximate observed transduction efficiency (see Figure 6a). For solutions as a function of time, the associated differential equa-tions were solved using parallel computational meth-ods, with three 375-MHz processors for 400 millisec-onds simulation time to capture activation and repolarization (18).
Statistical analysis. All the data shown are mean ± SEM. ANOVA was used for statistical analysis along with post-hoc analyses taking into consideration repeated measurements, and P< 0.05 was considered to indicate statistical significance.
Results
KCNE3-KCNQ1 coassembly. To determine the effects of E3 on Q1 functional properties, we transiently trans-fected CHO cells with Q1 alone, Q1 and E3, or Q1, E3, and KCNE1 (E1). Compared with Q1 alone,
addi-tion of E3 increased the rate of activaaddi-tion; outward currents were augmented by an average of 4.8-fold at all voltages higher than –60 mV (P< 0.05) (Figure 1, a and b). In native cells, it is believed that the Q1-E1 complex forms IKs(22); thus we tested the effects of
E3 on Q1, coexpressed with E1. As in the absence of E1, addition of E3 resulted in currents that activated quickly and remained open throughout the pulse (Figure 1a). In addition, E3 coexpression resulted, on average, in a 2.8-fold higher current measured at the end of the activation pulse at voltages higher than − 80 mV (P < 0.05) (Figure 1c). Addition of E3 also resulted in an acceleration in deactivation compared with Q1, with or without E1 present (Figure 1a). Moreover, there was no difference in currents associ-ated with Q1-E3 coassembly, with or without E1 present. For example, potassium current at the end of the test pulse to 40 mV was 1.1 ± 0.1 nA for Q1-E3, compared with 1.1 ± 0.3 nA for Q1-E1/E3 coexpres-sion (Figure 1, b and c).
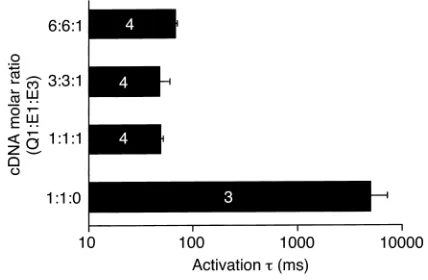
To test whether the latter results depend critically on the stoichiometry of expression, we used three differ-ent cDNA molar ratios in the transidiffer-ent transfections. As shown in Figure 2, activation times were approxi-mately two orders of magnitude smaller when E3 was present, independent of the cDNA molar ratios used. The activation time constant was significantly larger at the highest Q1/E1/E3 cDNA molar ratio (6:6:1) than at the lowest ratio of 1:1:1 (P< 0.05), while there was no statistical difference between the other groups when E3 was present. These findings demonstrate that Q1 is highly sensitive to E3, independent of E1’s presence. Ex vivo expression of KCNE3 in native cells. Preliminary studies were done on isolated rabbit myocytes that were transduced in primary culture by AdCGI-KCNE3 to determine the effects of E3 on APD. Time to 90% repo-larization (APD90) was significantly reduced to 225 ± 39
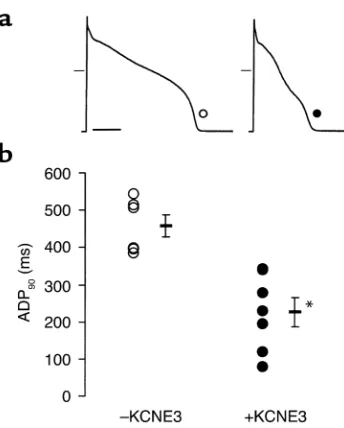
[image:4.576.59.288.53.277.2]milliseconds (range 78–340) in the E3-transduced myocytes (n= 6), compared with 457 ± 29 milliseconds
Figure 1
[image:4.576.316.530.526.666.2]KCNQ1-KCNE3 coexpression in CHO cells. (a) Original current traces of KCNQ1 alone (Q1), KCNQ1-KCNE3 (Q1/E3), KCNQ1-KCNE1 complex (Q1/E1), and KCNQ1/KCNE1/KCNE3 (Q1/E1/E3) record-ed with 2-second (upper panels) or 4-second (lower panels) voltage steps from –80 to 40 mV, followed by a repolarization to –50 mV for 0.3 seconds. Vertical scale bars = 0.2 nA; horizontal scale bars = 0.5 seconds; dash marks designate zero current. (band c) Currents at the end of depolarizing pulses (arrows in left panels of a) for Q1 alone (open circles, n= 4), Q1/E3 (filled circles, n= 4), Q1/E1 (open squares, n= 3), and Q1/E1/E3 (filled squares, n= 4).
Figure 2
Effects of KCNE3 on activation kinetics of IKin transfected CHO cells.
(P< 0.05) in control cells (n= 7), while time to 50% repolarization (APD50) was reduced from 222 ± 43
mil-liseconds to 128 ± 30 milmil-liseconds (P< 0.05) at 1 Hz pacing rate (Figure 3). Similar results were obtained for 0.5 and 2 Hz pacing rates (data not shown). There was no change in the resting membrane potential between the two groups (–65.6 ± 1.0 vs. –64.5 ± 1.7 mV, E3-trans-duced vs. control).
In vivo expression of KCNE3. To investigate the effects of E3 expression on action potential repolarization, E3 was injected into the left ventricles of guinea pigs. Ectopic expression of E3 in cardiac myocytes resulted in an augmentation in action potential repolarization and therefore a reduction in APD (Figure 4). APD90
was reduced significantly from 287 ± 19 milliseconds in control myocytes (n= 7) to 98 ± 8 milliseconds in E3-transduced myocytes (n= 6) (P< 0.05) at 1 Hz pac-ing rate. Likewise, APD50was reduced from 250 ± 19
milliseconds in control cells to 65 ± 8 milliseconds in E3-transduced myocytes (P< 0.05). Similar trends were observed for both APD50and APD90at 0.5 and 2 Hz
pacing rates (data not shown). Expression of E3 did not alter the resting membrane potential of cardiac myocytes (–71 ± 1 vs. –68 ± 2 mV, control vs. E3-trans-duced), or the cell capacitance (110 ± 8 vs. 101 ± 5 pF, control [n= 9] vs. E3-transduced [n= 8]).
Since coexpression of E3 with HERG reduced HERG current in oocytes (6), we anticipated that E3 might interact with HERG to reduce IKrdensity in
cardiomy-ocytes. We tested this idea indirectly by examining the effects of an IKrblocker (E-4031) (23) on APD in
con-trol and E3-transduced myocytes. We found that the
addition of 5 µmol/l E-4031 to the bath solution had no significant effect on APD in E3-transduced myocytes (APD90of 98 ± 8 milliseconds when E-4031
was absent compared with 108 ± 10 milliseconds when it was present) (Figure 4b). Conversely, E-4031 increased APD50and APD90by approximately 87 and
88 milliseconds, respectively, in control cells (Figure 4b). The finding that E3-transduced cells are resistant to E-4031 suggests that E3 may functionally interact with HERG in cardiac myocytes to reduce IKr;
never-theless, the acceleration and enhancement of Q1 cur-rent predominates and produces net abbreviation of the action potential.
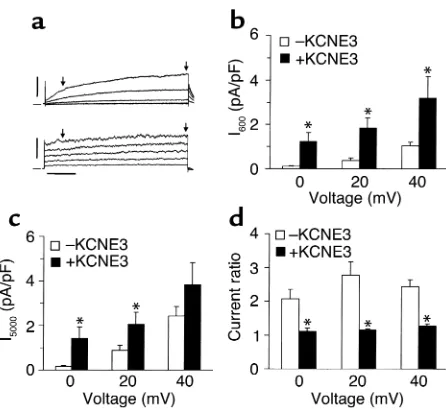
To test this notion and specifically to determine whether the abbreviation in APD is due to an increase in IKs, we recorded currents in E3-transduced myocytes
in the presence of 5 µmol/l E-4031 to block IKr. As in
CHO cells, expression of E3 in native cardiomyocytes increased both the density and the rate of activation of IKs(Figure 5). IKsdensity measured after 600
[image:5.576.81.253.49.263.2]millisec-onds of activation was on average sixfold larger in E3-transduced myocytes than in control myocytes (Figure 5b), while it was about fourfold larger after 5000 mil-liseconds of activation (Figure 5c). Rate of activation, determined by the ratio of currents at 5000 millisec-onds to 600 millisecmillisec-onds of activation, was signifi-cantly increased in E3-transduced myocytes compared with control cells (Figure 5d). This ratio was close to unity in the E3-transduced cells, indicating the pres-ence of a time-independent current presumably as a result of interaction between Q1 and E3 in native cells.
Figure 3
Effects of KCNE3 on APD; ex vivo transduction of rabbit ventricular myocytes in primary culture. (a) Representative traces of action poten-tial and (b) pooled data of APD90from control (–KCNE3, n= 7, open
[image:5.576.330.513.428.646.2]symbols) and E3-transduced (+KCNE3, n = 6, filled symbols) myocytes, at 1 Hz pacing cycle. Scale bar = 0.1 seconds; dash marks designate 0 mV. *P< 0.05 vs. control.
Figure 4
Effects of KCNE3 on APD; in vivo transduction of guinea pig ven-tricular myocytes. (a) Representative traces of action potential in control (–KCNE3) and E3-transduced (+KCNE3) myocytes. (b) Pooled data of APD90from control and E3-transduced myocytes, in
Consistent with action potential recordings in isolat-ed E3-transducisolat-ed myocytes, the QT interval of the ECG in E3-transduced animals was abbreviated significantly compared with baseline (QTc of 158 ± 4 milliseconds at baseline vs. 143 ± 4 milliseconds at day 3, n= 6; P< 0.05). In these animals, RR interval was also shortened from 232 ± 4 milliseconds at baseline to 207 ± 5 milliseconds at day 3 (P< 0.05), with no change in PR interval. There was no observable change in the T wave or QRS-com-plex morphology. To ensure that these observations were not a consequence of adenoviral exposure itself and were entirely due to the presence of E3, we trans-duced two guinea pigs with AdCGI adenovirus, which is the same construct as AdCGI-KCNE3 but lacking the E3 gene. In neither animal did we observe changes in the QT or RR interval (e.g., QTc of 149 ± 10 and 154 ± 7 mil-liseconds, for baseline and 72 hours after injection, respectively), indicating that shortening of QT interval in animals transduced with adenovirus carrying E3 reflects an underlying reduction in APD in the E3-trans-duced cardiomyocytes.
While APDs measured in the E3-transduced myocytes were reduced on average by 66%, we only observed a 10% reduction in QT interval (QTc) in
[image:6.576.66.289.52.257.2]transduced animals. This discrepancy between reduc-tions in APD in isolated cells and QT interval of the ECG is primarily due to the transduction efficiency. In these studies, we estimated a 10–20% transduction rate — as determined by percentage of GFP-trans-duced cells after isolation. Therefore, one would expect that action potential abbreviations in isolated cells would not translate to similar percentages of QT interval abbreviation on the ECG, simply due to the
Figure 5
Effects of KCNE3 on IK; in vivo transduction of guinea pig ventricular
myocytes. (a) Original current traces of E-4031–insensitive delayed rectifier currents (i.e., IKs) recorded with 5-second depolarizing steps
[image:6.576.319.507.350.732.2]from –20 to 60 mV in 20-mV increments, followed by a repolarizing pulse to –50 mV for 0.3 seconds, with 10-second repetition cycles in a control (upper panel) and an E3-transduced (lower panel) myocyte. Horizontal scale bar = 1 second; vertical scale bar = 2.5 and 5.0 pA/pF for upper and lower panels, respectively. (band c) Current densities after 600 milliseconds (b) and 5000 milliseconds (c) activation (arrows in a) at three different voltages in control (–KCNE3, n= 8) and E3-transduced (+KCNE3, n= 8) cells. (d) Ratio of current densi-ties at 5000 milliseconds relative to 600 milliseconds of activation. *P< 0.05 vs. control (–KCNE3).
Figure 6
Mathematical model of action potential propagation in left ventric-ular tissue. (a) Upper panel: Geometry of the cable model used, based on a portion of the left ventricular wall. Middle panel: Repre-sentative action potential traces in endocardial (Endo), midwall (Mid), and epicardial (Epi) “myocytes” (or nodes). Action potential propagation was initiated at the endocardial surface, in a 3 × 3 area. Lower panel: The corresponding ECG. Horizontal scale bars = 0.1 seconds. (b) Predicted relation between repolarization time (Repol.; activation time + APD90) and APD90calculated at each layer from the
electrical coupling between E3-transduced and non-transduced myocytes. To check for quantitative con-sistency in this argument, we used a mathematical model of cardiac action potential propagation in the heart (18), where a variable percentage of the nodes or “myocytes” possessed an additional ionic current modeled to mimic that associated with Q1-E3 coassembly (Figure 6a). The baseline model repro-duces transmural repolarization time (APD90+
con-duction time) and action potential durations (APD90)
measured experimentally (24). We found that, similar to our experimental observations, a 15% uniform transmural transduction rate resulted in 14% reduc-tion in the simulated QT interval in the model (Fig-ure 6c), which is within one SEM of our experimental observations. More importantly, the model showed that, in order to achieve a reduction in QT interval comparable to the APD abbreviation seen in isolated cells (66%), a transduction rate of approximately 70% or higher is needed (Figure 6c).
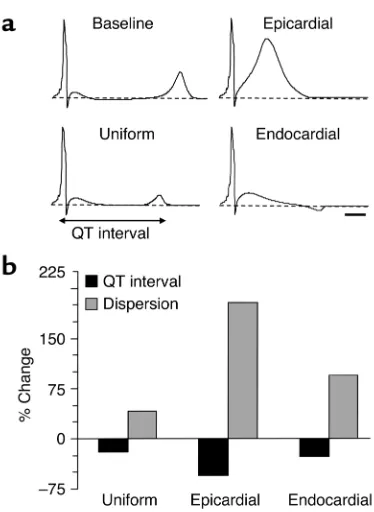
While ectopic E3 expression can abbreviate the QT interval both in vivo and in silico, such expression might actually destabilize repolarization if marked het-erogeneities occur. Locally intense transduction of one region or transmural layer could, in principle, lead to such heterogeneities and predispose to arrhythmias. In
transmural wedge preparations, the “dispersion of repolarization,” defined as the difference between the longest and shortest repolarization time (activation time + APD90) across the ventricular wall, has been
val-idated as a sensitive marker of repolarization hetero-geneity (24, 25). To test the effects of heterogeneous expression of E3 in relation to arrhythmias, we numer-ically expressed E3 in the 25% outer (epicardial) portion of the model; such a distribution mimics that achieved with some adenoviral delivery methods (26). While QT interval of the model ECG was reduced to a greater degree than with 25% uniform transmural transduc-tion (Figure 7, a and b), the dispersion of repolarizatransduc-tion across the ventricular wall was actually elevated (Figure 7, a and b). Similar findings were obtained when E3 was expressed only in the 25% inner (endocardial) portion of the model (Figure 7, a and b). However, endocardial expression resulted in an elevation in the ST segment and an inverted T wave on the simulated ECG (Figure 7a). This indicates the importance of homogeneous transmural E3 transduction across the ventricular wall.
Discussion
In this study we expressed an accessory subunit, E3, which is not normally expressed in left ventricular tis-sue, by means of somatic gene transfer to regulate action potential repolarization. In CHO cells, we demonstrated that E3 coassembles with Q1 in the pres-ence or abspres-ence of E1 and results in a channel that acti-vates instantaneously and is open at all measured volt-ages. Ectopic expression of E3 in cardiac myocytes both ex vivo and in vivo resulted in a significant reduction in APD. Shortening of the action potential in myocytes transduced in vivo was consistent with a significant increase in IKs, which activated more rapidly and at
more hyperpolarized voltages compared with control cells. More importantly, overexpression of E3 resulted in a reduction in the QT interval of the ECG in the transduced animals, parallel to the results from isolat-ed E3-transducisolat-ed myocytes.
Results in CHO cells suggest that Q1 is more sensi-tive to E3 than it is to E1, independent of the molar ratio of cDNA expressed in these cells. Wang et al. (27), by taking advantage of fusion protein channels, put forward the possibility of multiple Q1-E1 stoi-chiometries. Based on these observations, it is likely that even the presence of one KCNE peptide — in this case E3 — out of a possible four (28) coassembled with a Q1 homotetramer could alter the activation properties and regulate the current expressed, as seen here and by others (6, 29).
[image:7.576.68.255.47.303.2]Preliminary studies done on rabbit myocytes, trans-duced with AdCGI-KCNE3 vector in culture, result-ed in action potentials that were significantly short-er than in control cells. APDs obsshort-erved in control cells after 24 hours of culture were, on average, longer than normal reported rabbit APDs (30). This is due to the downregulation of inward rectifier and tran-sient outward potassium currents in cultured
Figure 7
Effects of heterogeneous KCNE3 transduction on the simulated ECG. (a) Simulated ECGs for baseline, 25% uniform transmural transduc-tion (Uniform), 25% of “myocytes” only in the epicardial region (Epi-cardial), and 25% of “myocytes” only in the endocardial region (Endocardial). Horizontal scale bar = 50 milliseconds. (b) Predicted percent change in QT interval of the simulated ECG and dispersion of repolarization, calculated from the difference in the highest and lowest repolarization time (activation time + APD90) across the
myocytes (30, 31). Mitcheson et al. (30) reported a 50-millisecond increase in APD80, and depolarization of
the resting membrane potential in rabbit myocytes after 24 hours of culture, attributed to the alterations in ionic currents measured. Similarly, we observed a slight depolarization (∼5 mV) in the resting mem-brane potential in cultured rabbit myocytes com-pared with freshly isolated cells, independent of ade-noviral transduction.
AdCGI-KCNE3 virus was also delivered in vivo and resulted in a significant reduction in the APD in fresh-ly isolated E3-transduced myocytes. This was consis-tent with an observed approximately fivefold increase in IKsin the transduced cells. The augmentation in IKs
was consistent at all voltages measured and particular-ly at voltages in the plateau range of the action poten-tial, indicating that this current (because of its rapid activation) would be active throughout phases 2 and3 of the action potential, unlike native IKs, which is active
predominantly in phase 3.
In vivo delivery of AdCGI-KCNE3 in guinea pigs also resulted in a significant reduction in the QT interval of the ECG of transduced animals. While APDs measured in the E3-transduced myocytes were reduced on average by 66%, we only observed a 10% reduction in QT interval (QTc) in transduced ani-mals. Quantitative modeling rationalized the degree of QT interval abbreviation as a consequence of elec-trotonic interactions in the face of limited transduc-tion efficiency. More importantly, the model showed that, in order to achieve a reduction in QT interval comparable to the APD abbreviation seen in isolated cells (66%), a transduction rate of approximately 70% or higher is needed (Figure 6c). Nevertheless, the present simulations point out one potential benefit of low transduction efficiency in the heart — exces-sive electrical effects are dampened by electrotonic interactions with nontransduced cells in the cardiac syncytium, so as to produce therapeutically relevant alteration of global parameters.
A potential pitfall of limited transduction efficiency is the heterogeneity of repolarization that may occur with locally intense but patchy expression. Adenoviral delivery methods (e.g., ref. 26) can result in much more pronounced transduction efficiency in the subepi-cardium than in other layers. This could cause a prob-lem in the case of E3 transduction, since a high level of IKs heterogeneity across the ventricular wall could
result in abnormal repolarization patterns — in this case, more pronounced in epicardium than in other layers — serving as a precursor to arrhythmias. To address this issue, we numerically restricted the elec-trophysiological consequences of E3 transduction to the 25% most epicardial nodes of the model. This resulted in a greater abbreviation of the QT interval of the simulated ECG compared with homogeneous transmural transduction, while increasingthe degree of transmural dispersion of repolarization by 200% (Fig-ure 7). This paradox (shorter QT, but greater
disper-sion of repolarization) re-emphasizes the significance of the adenoviral delivery method used; recent approaches to viral particle delivery, as used here and previously by others (32, 33), result in a more trans-murally uniform transduction across the ventricular wall. Nevertheless, the details of transgene distribution will critically determine the eventual efficacy of gene therapy for LQT syndrome.
In summary, we have shown that the introduction of accessory subunits, such as E3, that coassemble with channels in the heart through somatic gene transfer and regulate their function could be exploit-ed as a therapeutic option for patients with LQT syn-drome. E3-transduced cells had a shorter APD than control cells, while E-4031–insensitive IKand
activa-tion kinetics of E3-transduced cells were significant-ly augmented compared with control cells. Thus, expression of E3 increases outward current and abbreviates APD in cardiac myocytes. Since E3 is not normally expressed in ventricular tissue, it is poten-tially an attractive candidate for gene therapy for dis-orders associated with abnormal cardiac repolariza-tion, at least at a conceptual level. It has been proposed that HERG overexpression through somat-ic gene transfer may be useful for stabilization of car-diac repolarization in LQT syndrome patients (12). However, HERG mutations are common in LQT syn-drome (LQT2) (3), and many possess dominant neg-ative features. Therefore, overexpression of wild-type HERG in such patients may not be very effective. Since E3 significantly reduces IKr, possibly through
interaction with HERG, while augmenting total out-ward IKand enhancing action potential
repolariza-tion, E3 may be a more attractive candidate for cor-rection of repolarization in patients with HERG mutations. However, in patients with Q1 mutation(s) (LQT1), where most of the genetic lesions are domi-nant negative as well, this approach may not be as effective. In any case, our modeling results highlight the importance of relatively even transgene distribu-tion in order to achieve salutary QT interval abbrevi-ation without undermining repolarizabbrevi-ation. Further studies in animal models of LQT syndrome and heart failure will be required to assess the ability of E3 to enhance cardiac repolarization without adversely affecting other properties.
Acknowledgments
The authors thank M. Estevez, J. Seharaseyon, M. Leppo, A. McDonald, A. Janssen, and C. Yung for their valuable technical assistance, and J. Miake for helpful discussions. We thank Eisai Co. (Tokyo, Japan) for kindly providing E-4031. E. Marbán holds the Michel Mirowski, M.D. Professorship of Cardiology of the Johns Hopkins University.
1. Keating, M.T., and Sanguinetti, M.C. 2001. Molecular and cellular mech-anisms of cardiac arrhythmias. Cell. 104:569–580.
2. Roden, D.M. 1998. Mechanisms and management of proarrhythmia.
Am. J. Cardiol. 82:49I–57I.
3. Splawski, I., et al. 2000. Spectrum of mutations in long-QT syndrome genes. KVLQT1, HERG, SCN5A, KCNE1, and KCNE2. Circulation.
102:1178–1185.
4. Splawski, I., Tristani-Firouzi, M., Lehmann, M.H., Sanguinetti, M.C., and Keating, M.T. 1997. Mutations in the hminK gene cause long QT syn-drome and suppress IKs function. Nat. Genet. 17:338–340.
5. Abbott, G.W., et al. 1999. MiRP1 forms IKr potassium channels with HERG and is associated with cardiac arrhythmia. Cell. 97:175–187. 6. Schroeder, B.C., et al. 2000. A constitutively open potassium channel
formed by KCNQ1 and KCNE3. Nature. 403:196–199.
7. Abbott, G.W., et al. 2001. MiRP2 forms potassium channels in skeletal muscle with Kv3.4 and is associated with periodic paralysis. Cell.
104:217–231.
8. Bleich, M., and Warth, R. 2000. The very small-conductance K+ channel KvLQT1 and epithelial function. Pflugers Arch. 440:202–206. 9. Franco, D., et al. 2001. Divergent expression of delayed rectifier K(+)
channel subunits during mouse heart development. Cardiovasc. Res.
52:65–75.
10. Boucherot, A., Schreiber, R., and Kunzelmann, K. 2001. Regulation and properties of KCNQ1 (K(V)LQT1) and impact of the cystic fibrosis transmembrane conductance regulator. J. Membr. Biol. 182:39–47. 11. Hoppe, U.C., Marbán, E., and Johns, D.C. 2000. Adenovirus-mediated
inducible gene expression in vivo by a hybrid ecdysone receptor. Mol. Ther. 1:159–164.
12. Hoppe, U.C., Marbán, E., and Johns, D.C. 2001. Distinct gene-specific mechanisms of arrhythmia revealed by cardiac gene transfer of two long QT disease genes, HERG and KCNE1. Proc. Natl. Acad. Sci. USA.
98:5335–5340.
13. Hardy, S., Kitamura, M., Harris-Stansil, T., Dai, Y., and Phipps, M.L. 1997. Construction of adenovirus vectors through Cre-lox recombina-tion. J. Virol. 71:1842–1849.
14. Johns, D.C., Marx, R., Mains, R.E., O’Rourke, B., and Marbán, E. 1999. Inducible genetic suppression of neuronal excitability. J. Neurosci.
19:1691–1697.
15. Hajjar, R.J., del Monte, F., Matsui, T., and Rosenzweig, A. 2000. Prospects for gene therapy for heart failure. Circ. Res. 86:616–621.
16. Seharaseyon, J., et al. 2000. Molecular composition of mitochondrial
ATP-sensitive potassium channels probed by viral Kir gene transfer.
J. Mol. Cell. Cardiol. 32:1923–1930.
17. Hayes, E., Pugsley, M.K., Penz, W.P., Adaikan, G., and Walker, M.J. 1994. Relationship between QaT and RR intervals in rats, guinea pigs, rabbits, and primates. J. Pharmacol. Toxicol. Methods. 32:201–207.
18. Winslow, R.L., et al. 2000. Electrophysiological modeling of cardiac ven-tricular function: from cell to organ. Annu. Rev. Biomed. Eng. 2:119–155. 19. Winslow, R.L., Rice, J., Jafri, S., Marbán, E., and O’Rourke, B. 1999. Mech-anisms of altered excitation-contraction coupling in canine tachycardia-induced heart failure. II. Model studies. Circ. Res. 84:571–586. 20. Liu, D.W., Gintant, G.A., and Antzelevitch, C. 1993. Ionic bases for
elec-trophysiological distinctions among epicardial, midmyocardial, and endocardial myocytes from the free wall of the canine left ventricle. Circ. Res. 72:671–687.
21. Zygmunt, A.C., Goodrow, R.J., and Antzelevitch, C. 2000. I(NaCa) con-tributes to electrical heterogeneity within the canine ventricle. Am. J. Physiol. Heart Circ. Physiol. 278:H1671–H1678.
22. Sanguinetti, M.C., et al. 1996. Coassembly of K(V)LQT1 and minK (IsK) proteins to form cardiac I(Ks) potassium channel. Nature. 384:80–83. 23. Sanguinetti, M.C., and Jurkiewicz, N.K. 1990. Two components of car-diac delayed rectifier K+ current. Differential sensitivity to block by class III antiarrhythmic agents. J. Gen. Physiol. 96:195–215.
24. Yan, G.X., Shimizu, W., and Antzelevitch, C. 1998. Characteristics and distribution of M cells in arterially perfused canine left ventricular wedge preparations. Circulation. 98:1921–1927.
25. Yan, G.X., and Antzelevitch, C. 1998. Cellular basis for the normal T wave and the electrocardiographic manifestations of the long-QT syndrome.
Circulation. 98:1928–1936.
26. Maurice, J.P., et al. 1999. Enhancement of cardiac function after aden-oviral-mediated in vivo intracoronary beta2-adrenergic receptor gene delivery. J. Clin. Invest. 104:21–29.
27. Wang, W., Xia, J., and Kass, R.S. 1998. MinK-KvLQT1 fusion proteins, evidence for multiple stoichiometries of the assembled IsK channel.
J. Biol. Chem. 273:34069–34074.
28. Abbott, G.W., and Goldstein, S.A. 1998. A superfamily of small potassi-um channel subunits: form and function of the MinK-related peptides (MiRPs). Q. Rev. Biophys. 31:357–398.
29. Melman, Y.F., Domenech, A., de la Luna, S., and McDonald, T.V. 2001. Structural determinants of KvLQT1 control by the KCNE family of pro-teins. J. Biol. Chem. 276:6439–6444.
30. Mitcheson, J.S., Hancox, J.C., and Levi, A.J. 1996. Action potentials, ion channel currents and transverse tubule density in adult rabbit ventricu-lar myocytes maintained for 6 days in cell culture. Pflugers Arch.
431:814–827.
31. Mitcheson, J.S., Hancox, J.C., and Levi, A.J. 1998. Cultured adult cardiac myocytes: future applications, culture methods, morphological and elec-trophysiological properties. Cardiovasc. Res. 39:280–300.
32. Hajjar, R.J., et al. 1998. Modulation of ventricular function through gene transfer in vivo. Proc. Natl. Acad. Sci. USA. 95:5251–5256.