© 2016, IRJET | Impact Factor value: 4.45 | ISO 9001:2008 Certified Journal | Page 1989
CASE STUDY OF POWER QUALITY IMPROVEMENT IN DISTRIBUTION
NETWORK USING RENEWABLE ENERGY SYSTEM
Jancy Rani.M
1, K.Elangovan
2, Sheela Rani.T
31P.G Scholar, Department of EEE, J.J.College engineering Technology, Trichy. 2P.G Scholar, Department of EEE, J.J.College engineering Technology, Trichy. 3 P.G Scholar, Department of EEE, J.J.College engineering Technology, Trichy.
---***---Abstract -
the paper discusses is distribution network side
power loss and power demand satisfied case study. Power compensation using renewable energy system from wind energy system and photovoltaic (PV). In the proposed work, the Optimal Power Flow output can be improved with the help of particle swarm Optimization (PSO), which suits the power quality requirement. IEEE bus system is utilized to simulate the distribution network and to measure the power flow and DG placement using MATLAB. OPF is adapted in the power system for maintaining the power in the distribution network system. The work helps to provide one time solution for power loss and time optimization in the power flow system. Data’s and power analyzed PSO is performed optimization. Power losses find the DGs are placed over the distribution side to provide a power control and power quality maintain for the system. The results are shown in the simulation graphs plotted proved that PSO is efficient in reducing the power loss and DG.
Key Words: Distributed Generation (DG), Optimal Power
Flow (OPF), particle swarm Optimization (PSO), Power System, Reduced unbalanced power.
I.INTRODUCTION
Optimal power flow a long time been informed with power systems operation. OPF can fully represent the network equation node power balances. Maintain on bus voltage, power flow. Optimal power flow called standard formula minimizing operation network loss. The capacity of the distributed Generation (DG) can be increased by connecting the plant to the distribution networks. The connection of DGs primarily modifies the operation of distribution network and creates a power losses area in placing. The application of switching methods. The power losses create area integrator switching methods connected to distribution generator (DG). Thus OPF has been developed extensively through power systems research to address problems ranging from economic dispatch to loss minimization. In general, a power system must have the following characteristics to have Optimal Power Flow (OPF)
• Operational cost minimization • Reduction of network losses • Minimization of emissions
• The demand for power supply must be satisfied to every customer, at every time.
• The power quality is required to be optimum • All the safety requirements must be met.
Hence the penetration of the renewable energy to the plant through DG is increased. The network constraints are minimized using the Distribution network. In order to evaluate the performance of the proposed design for distribution network, IEEE bus system is used. The IEEE standard bus system provides an environment to study the requirement of The issue of the power system and based on the requirement the proper standard bus system can be chosen from the following types of IEEE bus standard system.
• IEEE-14 system • IEEE-30 system • IEEE-57 system • IEEE-157 system.
The main objective of the proposed system is to place the Distributed generators (DG) in the appropriate place using the proposed algorithm. Power balances maintain the distribution side and power losses reduced. The PSO algorithm with the help of DG networks placed without any power loss. The IEEE bus system is used to verify the proposed system and its performance. The system feasibility with particle swarm optimization is analysed.
The following part of the paper is organized as follows. The prior works related to the DG placement and power balancing discussed with their methodologies and challenges associated with the each module of those systems in section. II gives detailed on the proposed working. Section III gives the performance analysis. The concluding words are provided in section IV.
II. PROPOSED METHOD
In an OPF, values of some or all of the control variable need to be found so as to optimize (minimize or maximize) a predefined objective. The quality of the solution depends on the accuracy of the model studies. Objective function takes various forms such as transmission losses and reactive source allocation.
© 2016, IRJET | Impact Factor value: 4.45 | ISO 9001:2008 Certified Journal | Page 1990 2. Reactive power objective:
• MW and MVA loss minimization
The ultimate aim of any power system is to reduce the transmission losses and to supply them effectively on demand. The active distribution network looks after these requirements with the help of the proposed particle swarm optimization (PSO) in place of approach methods. The basic flow diagram of the optimal power flow system is shown in Fig. 1. In this the bus system is utilized for the power flow analysis of the distributed network. Based on the analysis to control the power and transmit them without loss and with improved quality. The proposed methods used particle swarm optimization to optimize the power flow by regulating the placement of Distributed Generators. The system produced average results while making a comparative analysis with the proposed system.
The basic block of the proposed system is listed below and described in detail in the later sections
1. IEEE Bus 30 System 2. Power Flow Analysis
3. Particle swarm Optimization 4. DG Placement
[image:2.595.40.285.305.642.2]5. Wind energy 6. Photovoltaic
Fig -1: Flow Diagram of the proposed scheme
In the proposed Ant Colony Optimization system, the DOPF is made possible in the Active distribution network with good power quality, the power is curtailed based on the demand.
1. IEEE Bus 30 System:
The standard network of data is utilized to address the problems associated with the power system. Various type of generation can be made with various number of generators in a proper coordinated manner. The values are obtained from the IEEE 30 bus system for the grid system. It is the medium sized network that helps to traverse data from one block to other with the stipulated time and cost frame.
2. Power Flow Analysis:
The data collected from the previous blocks are analyzed to frame power flow equations to the power flow into the system. There are several different of solving the resulting nonlinear system equation. The most popular is known as the as the newton-rephson methods. This methods being with initials guesses of all unknown variables (voltage magnitude and angles at load buses and voltage angles at generator buses).
3. Particle swarm optimization (PSO):
PSO algorithm is introduced to iteratively find the optimal solution of the target problem through a guided search. is an optimization technique, The PSO algorithm output is depend on the fitness function. The fitness function calculation is based on the output results. PSO is a population based meta-heuristic inspired in the social behavior of birds within a flock. In a PSO algorithm each potential solution to the problem is called particle and the population of solutions is called swarm. To apply a PSO algorithm in multi-objective optimization the previous scheme has to be modified to cope with the fact that the solution of a problem with multiple objectives is not a single one but a set of non-dominated solutions, which is mainly used to select the index for power flow. PSO optimization best iterations
[image:2.595.312.555.502.653.2]© 2016, IRJET | Impact Factor value: 4.45 | ISO 9001:2008 Certified Journal | Page 1991 Fig -3: Standard particle swarm optimization GBest
4. DG placement:
The DG placement is the strategy adapted to place the generator in the place of the optimization buses. DG placement is done based on the power and cost requirement of the process. The generator denoted by different cost based on w/ , w/hr and constant terms. This block mainly performs the following functions. The using renewable sources are Wind energy or PV energy sources
5. Wind energy:
Wind power is the use of air flow through wind turbine to mechanically power generators of electricity. Wind power, an alternative to burning fossil fuels, is plentiful renewable, widely distribution, clean, produces no greenhouse gas emission during operation, and user little land. The net effect on the environment are fat less problematic than those of non-renewable power sources. Many individual wind turbines which are connected to electric power transmission network. Wind energy basic operation schemes Fig.4
Fig -4: Wind energy Basic schemes
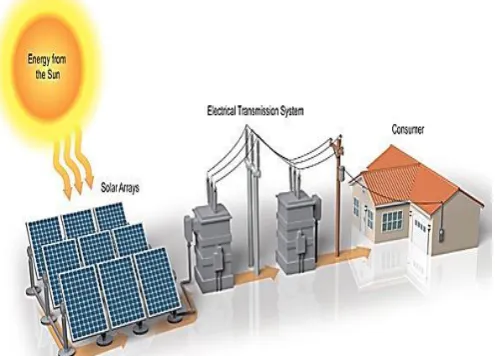
6. Photovoltaic(PV):
PV system is like any other electrical power generating system; just the equipment used is different than that used for conventional electromechanical generating system. PV array produces power when exposed to sunlight, a number of other components are required to properly conduct, control, convert, distribute, and store the energy produced by the array. Depending on the functional and operational requirements of the system, the specific components required may include major components such as a DC-AC power inverter, battery bank, system and battery controller, auxiliary energy sources and sometimes the specified electrical load (appliances). In addition, an assortment of balance of system (BOS) hardware, including wiring, overcurrent, surge protection and disconnect devices, and other power processing equipment. Figure.5 show a basic diagram of a photovoltaic system and the relationship of individual components
Fig -5: Photovoltaic scheme
III. PERFORMANCE ANALYSIS
The optimal power flow (OPF) is simulated in the MATLAB power flow analysis platform. The architecture of the proposed system enables to arrive on the possible solutions for problems in the optimal power flow. The localization of the Distributed generators was the main area of study which is achieved under the time horizons as well. The study is performed over active distributed network which is composed of inter-temporal components. The work is performed for radial network in a remote distribution network. This network must follow certain power flow equations. The system is evaluated with the help of simulations, the metrics used by the system are
[image:3.595.314.562.329.507.2]© 2016, IRJET | Impact Factor value: 4.45 | ISO 9001:2008 Certified Journal | Page 1992 These parameters serve as the measure of system efficiency.
The simulated results show power loss before optimization while the power loss after application of ant colony optimization is found to be reduced.
1. Power improvement:
The time step variable defined as the part of total energy capacity used by the power system. The time graph is power losses reduced time various over multiple time steps. It is validated for OPF across the time horizons. Char-1. presents the power improves of the proposed system. The power losses reduces constraint is given by the following strategy for energy
Chart -1: power losses reduces
2. PSO performances:
[image:4.595.312.553.294.445.2]The power quality is the prime requirement of the power system. In an distribution network. The quality of the power transmitted over a network is based on various factors like DG placement, optimization strategy used and cost estimated traversal with in particular period of time. The proposed system produces a qualitative output which is depicted in the Fig. 6.
Fig -6: Performance study of proposed System
Particle swarm optimization best performances in archive goal power balance in power quality improvement distribution network side
3. Efficiency:
Power demand in the power system distribution network in optimal power flow calculated to normal non distribution generator and particle swarm optimization in maximum power demand satisfied distribution generator in distribution networks, higher will be the time efficiency of the system. Based on the heuristics and Particle Swarm Optimization, the need for distributed network is approximated. Based on the need, the PSO produces an optimal power floe within the network power efficiency in proposed system Chart-2.
Chart -2: Efficiency of the proposed system
IV.CONCLUSIONS
The proposed particle swarm based Optimization (PSO), enables to schedule the power management distributed network for good power balance and power quality. The work focuses on the optimized positioning of the Distributed Generator (DG) in a power system network with optimal power flow. IEEE 30 bus system is used for running the real time data sets and hence the feasibility of the system is studied. The scheduling framework using the proposed PSO strategy. The framework is then utilized to determine the DG placement and total number of DG required for efficient power system. The as efficiency, curtailment, quality of power based on demand with optimistic results.
REFERENCES
[1] Alejandro Rolan, Alvaro Luna, Gerardo Vazquez, Daniel Aguilar Gustavo Azevedo, Modeling of a Variable Speed Wind Turbine with a Permanent Magnet Synchronous Generator, IEEE Trans M. Young, The Technical Writer’s Handbook. Mill Valley, CA: University Science, 1989. [2] Guoliang Yang, Yanping Zhu, Application of A Matrix
© 2016, IRJET | Impact Factor value: 4.45 | ISO 9001:2008 Certified Journal | Page 1993 [3] J. Karpagam, P. S. Mayurappriyan, Jovitha Jerome,
Application of matrix converter in wind energy conventional sources by employing synchronous generator, IEEE Trans
[4] H. W. Dommel and W. F. Tinney, “Optimal power flow solutions,” IEEE Trans. Power App. Syst., vol. PAS-87, no. 10, pp. 1866–1876, Oct. 1968.
[5] Western Wind and Solar Integration Study, Tech. Rep., 2010, GE Energy, National Renewable Energy Laboratory.
[6] Y. Ru, J. Kleissl, and S. Martinez, “Storage size determination for grid connected photovoltaic systems,” 2011, working paper.
[7] J.Kennedy, Washington, DC, USA, ‘’particle swarm optimization’’ IEEE trans. Vol:4. NOV/Dec1995. [8] Yuhui shi, Department electrical Indiana university
Indianapolis,IN 46202-5150
[9] S. Liu, B. Liu, and Y. J. Peng, "Reconstruction of Distribution Network Based on Binary PSO and Optimal Flow Method," in Applied Mechanics and Materials, 2013, pp. 271-275
[10] M. J. Dolan, E. M. Davidson, I. Kockar, G. W. Ault, and S. D. McArthur, "Distribution power flow management utilizing an online optimal power flow technique," IEEE Transactions on Power Systems, vol. 27, pp. 790-799, 2012.
BIOGRAPHIES
JANCY RANI.M Department of EEE doing Master
engineering (Power Systems Engineering) from JJ college engineering Institute of Technology under Anna University, Trichy
Research interests include distributed control and optimization of power systems, renewable energy integration, and smart grid modeling and control, FACTS, HVDC.
ELANGOVAN.K Department of EEE doing Master
engineering (Power Systems engineering) from JJ college engineering & Technology under Anna University, Trichy.
Research interests include distributed control and optimization of power systems, renewable energy integration, and smart grid modeling and control, Micro grids control
SHEELA RANI.T Department of EEE doing
Master engineering (Power Systems engineering) from JJ college engineering & Technology under Anna University, Trichy.