© 2016, IRJET | Impact Factor value: 4.45 | ISO 9001:2008 Certified Journal
| Page 1477
Performance Study on a Pier Designed Using Force
Based and Direct Displacement Methods
Ravinder
1, Mr. Ajit Singh
21. PG Student, Deptt. Of Civil Engineering, CBS Group of Institution, Jhajjar
2. AP, Deptt. Of Civil Engineering, CBS Group of Institution, Jhajjar
Abstract-A Skytrain system is the type most preferred the metro because of the ease of construction and also makes it more accessible urban areas without any difficulty building. An elevated metro system has two major elements pier and caisson. This paper focuses only on the jetty design and performance. Typically the pier of a metro bridge is designed using an approach based on force. During a seismic load, the behavior of a single high bridge pier is essentially based on the ductility and displacement capacity. It is important to check the ductility of these simple pillars. strength based methods do not explicitly check the displacement capacity when designing. The codes are now moving towards a (based on movement) design approach based on performance, which consider the design according to the target performance design stage. In this article, the performance of a dock designed with direct displacement based design is compared to that of a designed on the basis of force. The design of a dock is done both by the strength of the seismic design method based on the method of seismic design and direct displacement based and perform ance assessment is based on both methods.
Keywords— Elevated Metro System, Bridge Pier, Direct Displacement Based Seismic Design, Performance Based
Design, Force Based Design
I. INTRODUCTION
A seismic design approach based strength is typically used to design the backbone of the Metro bridge. During a seismic load, the behavior of high bridges is essentially based on the ductility and the pier displacement capacity. It is important to check the ductility of these simple pillars. strength based methods do not explicitly check the displacement capacity at the design stage. The codes are now moving towards a (based on movement) design approach based on performance, which consider the design according to the target performance design stage.
DESIGN OF PIER USING FORCE BASED DESIGN METHOD
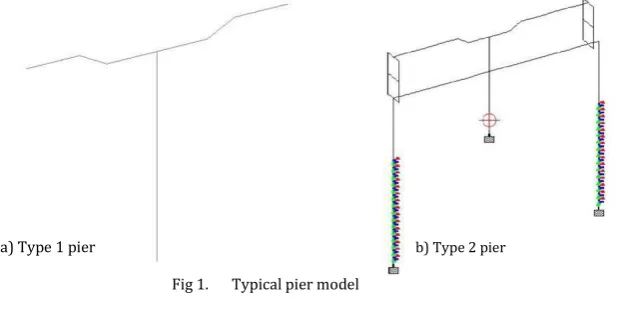
The pillars considered for analysis are those normally adopted in the elevated subway station structure. The effective height of the pillars is considered of 13.8 m. The pillars are supposed to be located in the seismic zone II and the designs are as IS 1893 (Part 1): 2002. The modeling and seismic analysis is performed using the finite element softwar e STAAD Pro. The typical pier model is illustrated below.
a) Type 1 pier b) Type 2 pier
[image:1.596.149.458.549.716.2]© 2016, IRJET | Impact Factor value: 4.45 | ISO 9001:2008 Certified Journal
| Page 1478
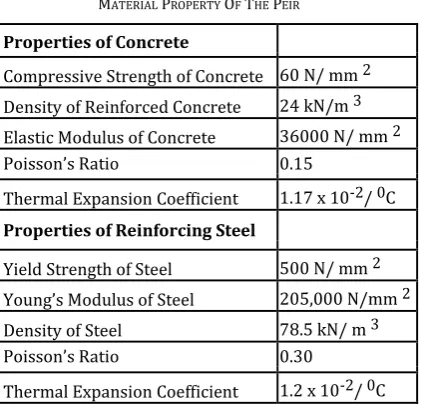
A. Material Property Adopted [image:2.596.175.386.138.343.2]The material property considered for present pier analysis for concrete reinforcement and steel are given in table below.
TABLE I
MATERIAL PROPERTY OF THE PEIR
Properties of Concrete
Compressive Strength of Concrete 60 N/ mm 2 Density of Reinforced Concrete 24 kN/m 3 Elastic Modulus of Concrete 36000 N/ mm 2 Poisson’s Ratio 0.15
Thermal Expansion Coefficient 1.17 x 10⁻²/ 0C
Properties of Reinforcing Steel
Yield Strength of Steel 500 N/ mm 2 Young’s Modulus of Steel 205,000 N/mm 2 Density of Steel 78.5 kN/ m 3 Poisson’s Ratio 0.30
Thermal Expansion Coefficient 1.2 x 10⁻²/ 0C
B. Design Loads
The burden of elementary design considered for the analysis are the dead load (DL), Super burdens (SIDL), imposed loads (LL), earthquake loads (EQ), wind loads (WL), Derailment load (DRL), Construction & Erection charges (EL), temperature loads (OT) and charges Surcharge (Traffic, building, etc.) (SR). The approximate charges considered for the analysis are presented in the table below. The total weight of the seismic pier is 17862 kN.
TABLE II APPROXIMATE
DESIGN LOADS
Load from Platform LevelLoad Load from Track Level Load
Self-Weight 120 kN Self-Weight 160 kN Slab Weight 85 kN Slab Weight 100 kN Roof Weight 125 kN Total DL 260 kN
Total DL 330 kN SIDL 110 kN
SIDL 155 kN Train Load 190 kN
Crowd Load 80 kN Braking + Tractive Load 29 kN
LL on Roof 160 kN Long Welded Rail Forces 58 kN
Total LL 240 kN Bearing Load 20 kN
Roof Wind Load 85 kN Temperature Load
Lateral 245 kN For Track Girder 20 kN Bearing Load 14 kN For Platform Girder 14 kN
Derailment Load 80 kN/m
© 2016, IRJET | Impact Factor value: 4.45 | ISO 9001:2008 Certified Journal
| Page 1479
TABLE 33
REINFORCEMENT DETAILS AS PER FORCE BASED DESIGN
Pier Cross Section Diameter Number Percentage of Type of Bar (mm) of bars Reinforcement
Required Provided
Pier A 2.4x1.6 32 #32 0.8 0.8 Pier B 2.4x1.6 32 #38 0.8 0.8
III. DESIGN OF PIER USING DIRECT DISPLACEMENT DESIGN
The seismic design method based direct displacement proposed by Priestley et al. (2007) and 1997 CBC IRS code is used to design Pier Type B and the results are presented in the table below. The level of performance considered for the study is a (LS) Life Safety Level
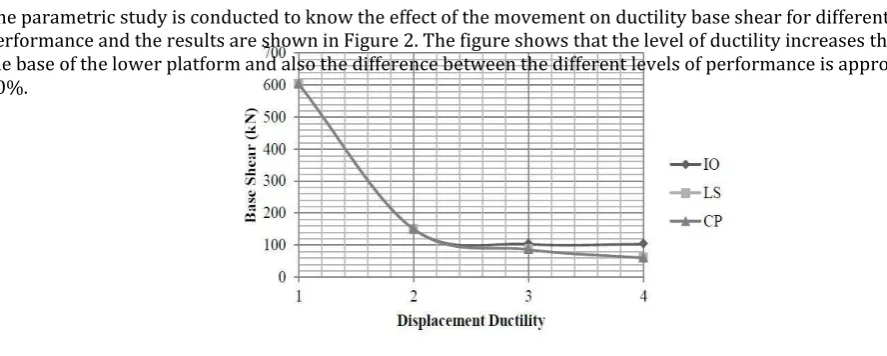
The parametric study is conducted to know the effect of the movement on ductility base shear for different levels of performance and the results are shown in Figure 2. The figure shows that the level of ductility increases the shear at the base of the lower platform and also the difference between the different levels of performance is approximately 40%.
Fig 2. Effect of Displacement ductility on base shear of different Performance Levels
IV. PERFORMANCEASSESSMENT
Performance evaluation is done to study the performance of the pier designed by the Force Based Design Method and Direct Displacement Based Design Method. For this purpose, the non-linear static analysis is performed to the dock designed using SeismoStruct Software and the results are shown in Table V. The treated section is 1.5 m x 0.7 m. performance parameters behavior factor (R '), ductility structure (μ') and the maximum structural drift (Δ'max) are found for the two cases.
The driving factor (R) is the ratio of the force required to maintain the elastic structure to the inelastic design strength of the structure. The driving factor, R ', and represents the intrinsic ductility, on the strength of the structure and the difference in the level of constraints taken into account in its design. FEMA 273 (1997), IBC (2003) suggests that the R factor in the procedures for seismic design based on force. It is usually expressed as follows in the light of the above three elements
,R = Rμ.RS.Y
Rμ= Ve/Vy, RS =Vy/Vs, Y=Vs/Vw
[image:3.596.44.488.254.432.2]© 2016, IRJET | Impact Factor value: 4.45 | ISO 9001:2008 Certified Journal
| Page 1480
TABLE 44
REINFORCEMENT DETAILS AS PER DIRECT DISPLACEMENT BASED DESIGN
Displacement Drift Limit Cross Section Base Shear V
b
Diameter of Percentage of No. of Bars Reinforcementductility (m) (m) (kN) Bars (mm) Required
1 0.276 1.5 x 0.7 604 32 #16 1.2 %
2 0.276 1.5 x 0.7 150 32 #12 1.2 %
3 0.276 1.5 x 0.7 8 32 #12 0.8 %
4 0.276 1.5 x 0.7 6 32 #12 0.8 %
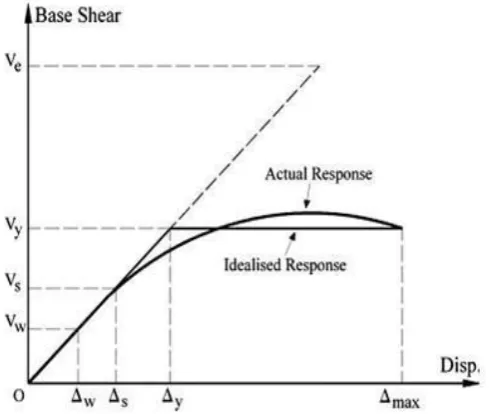
R’(Rw)=( Ve/Vy) (Vy/Vs)( Vs/Vw)=Ve/Vw
where, Ve, Vy, Vs and Vw correspond to the structure’s elastic response strength, the idealised yield strength, the first significant yield strength and the allowable stress design strength, respectively as shown in the Figure below.
Fig 3. Typical pushover response curve for evaluation of performance parameters
The structure ductility, μ’, is defined in as maximum structural drift ( ´max) and the displacement corresponding to the idealised yield strength ( y) as,
μ’ = ´max/ y
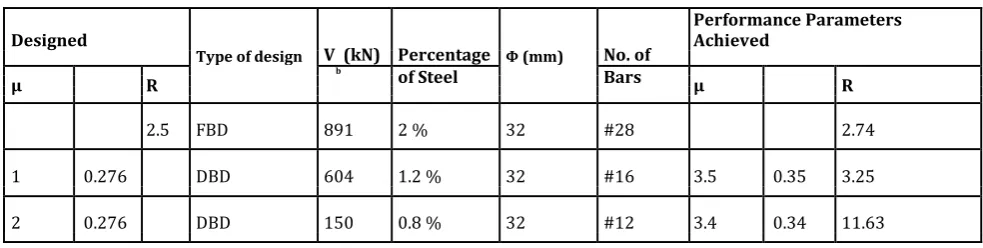
Based Design in effect, a reduction factor of force (R) 2.5 is used, and the shear core design is estimated to 891kN in the FBD. The section of the performance parameters designed using FBD behavior shows that the R factor is found to be about 2.74. The same platform is designed using a DDBD method for the target ductility and drift movement, the performance parameters structural ductility and structural drift are found for these cases. It shows that the
performance parameters obtained were higher than expected in the design phase for both of DDBD. Although the FBD can not always guarantee the required performance parameter, in this case the jetty reached the target requirement. For DDBD, design considers the target displacement ductility and drift in the design stage, and this study shows that in the two examples of the method achieves DDBD behavioral factors more targeted values. These findings may be considered only for the selected platform. For general conclusions large nu mber of case studies is required.
V. CONCLUSIONS
[image:4.596.164.409.263.470.2]© 2016, IRJET | Impact Factor value: 4.45 | ISO 9001:2008 Certified Journal
| Page 1481
TABLE 5
PERFORMANCE ASSESSMENT OF DESIGNED PIER
Designed
V (kN) Percentage No. of
Performance Parameters Achieved
Type of design Φ (mm)
b
of Steel Bars
µ R µ R
2.5 FBD 891 2 % 32 #28 2.74
1 0.276 DBD 604 1.2 % 32 #16 3.5 0.35 3.25
2 0.276 DBD 150 0.8 % 32 #12 3.4 0.34 11.63
REFERENCES
[1] Balendra, T. and Shanmugam, N. E. (1985). Vibrational characteristics of multicellular structures. J. Struct. Engrg.
, ASCE, 111 (7), 1449-1459.
[2] Design Basis Report of Bangalore Metro Phase I (2003). Bangalore Metro Rail Corporation.
[3] Detailed Project Report of Bangalore Metro Phase I (2003). Bangalore M e t r o R a i l Corporation Limited. Bangalore.
[4] FEMA 273 (1997). NEHRP Guidelines for the seismic rehabilitation of buildings. Federal EmergencyManagement Agency, Applied Technology Council, Washington D.C., USA.
[5] FEMA 356 (2000). Prestandard and Commentary for the Seismic Rehabilitation of Buildings. American Society of Civil Engineers. USA.
[6] IRS Concrete Bridge Code (1997). Code of Practice for Plain, Reinforced & Prestressed Concrete for General Bridge Construction Code. Research Designs and Standards Organisation, Lucknow.
[7] IS 13920 (1993). Indian Standard Code of Practice for Ductile Detailing of Reinforced Concrete Structures Subjected to Seismic Forces. Bureau of Indian Standards, New Delhi.
[8] IS 1893 Part 1 (2002). Indian Standard Criteria for Earthquake Resistant Design o f Structures. Bureau of Indian Standards. New Delhi.
[9] IS 456 (2000). Indian Standard for Plain and Reinforced Concrete - Code of Practice. Bureau of Indian Standards. New Delhi.
[10] M.J.N. Priestley, G. M. Calvi and M. J. Kowalsky. (2007). Displacement Based Seismic Design of Stuctures. Iuss Press, Pavia, Italy.