Knowledge Discovery through Computational
Methods on EEG and fMRI Data
Sanjana Sahayaraj
1, Dr. Shomona Gracia Jacob
2 ∗†‡Abstract The study of brain data is crucial in de-termining a persons state of mind and level of activ-ity. The way to represent such brain data and the methods adopted to perform computations on them are discussed in this paper. EEG (Electroencephalog-raphy) and fMRI (Functional Magnetic Resonance Imaging) are two widely employed methods of repre-senting brain data. The processing may involve a sin-gle persons brain data or the one collected from many subjects. When a huge amount of data is involved, mining essential information from it and training clas-sifiers to correctly predict the type of new data are important steps. This paper presents the work of the authors in pre-processing and analysing brain data through data mining techniques. Feature Selection has been utilized to mine important brain features and classification revealed the Nearest-Neighbour al-gorithm to be a good classifier of brain data.
Keywords: EEG: Electro Encephalography; fMRI: Functional Magnetic Resonance Imaging; ADHD: At-tention Deficit Hyperactivity Disorder; MV: Multivari-ate; MVPA: Multi-Voxel Pattern Analysis; ICA: Inde-pendent Component Analysis; GLM: General Linear Model; CFS: Correlation Based Feature Selection
1
INTRODUCTION
The brain is the centre of command and control in our body. Every single activity we perform, day in and day out is initiated, monitored and controlled by the brain. The brain can be characterized as regions, each with its own important function. Damage to a particular region affects the functions previously controlled by that region. The nerve cells or neurons are responsible for transmit-ting information throughout the brain in the form of elec-trical signals. The nerve cells are elecelec-trically excitable. The patterns of such neural activity could map onto men-tal representations or behaviour of a person as in EEG. Brain activity can also be identified by corresponding changes in blood flow as in fMRI. The knowledge gained
∗
†1Sanjana Sahayaraj is a student in SSN College of Engineering, affiliated to Anna University, Chennai, India. [email protected]
‡2Dr. Shomona Gracia Jacob is a faculty in the De-partment of Computer Science and Engineering, SSN College of Engineering, affiliated to Anna University, Chennai, India. [email protected]
this way can further be analysed through data mining and machine learning techniques to give precise information about a person. Whether it is detecting a bout of activity or detecting chronic inactivity, the decisions made will be accurate if they are based on testing the newly obtained data on patterns formed by previously accumulated huge amounts of data. Since data mining aims at extracting meaningful information from raw data, brain data was analyzed through data mining techniques to unearth im-portant features.
2
BRAIN DATA ANALYSIS
Most of the brain data analysis are performed on EEG and fMRI data. While fMRI can provide 3 dimensional images of brain activity captured at specified intervals of time, EEG provides continuous data about brain waves.
2.1
Mining Data from Functional magnetic
resonance imaging
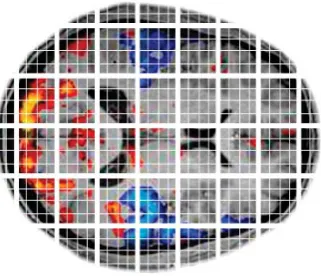
It is a neuroimaging technique using MRI technology. It has been in use since the 1990s for brain related studies and diagnosis. It produces images that specifically high-light the change in blood flow or the blood oxygenation level. This is considered as a proxy for degree of mental activity. Some of the fMRI methods use radioactive ma-terials which are required to be inhaled or injected. The radioactive materials reach all parts of the body through blood flow. Where there is more blood flow, the region also has more radioactive materials. Thus they are capa-ble of emitting more radiations which are captured in the fMRI images. Though the nerve cells are said to be the basic building blocks of the central nervous system, which comprises the brain and the spinal cord, fMRI does not provide any detail at the level of a cell. The 3D image produced by fMRI is built up in units called voxels. A voxel is a unit of graphic information. This voxel defines a particular point in the 3-Dimensional space.
2.2
Mining Data from
Electroencephalo-gram
Figure 1: fMRI data with several voxels
for each level of alertness or brain state. The brain waves are split into groups based on the value of frequency. Each brain wave is encountered during different degrees of mental activity. Each brain wave serves a purpose and thus helps in optimal mental functioning. Electro-encephalograph is the tool that allows one to note these brain waves and thereby observe patterns. Though all the 5 types of brain waves can occur, one type is domi-nant based on the state of consciousness and this brain wave will be the focus of a scientific study that is to be performed on the subject. The waves with highest fre-quency are called gamma waves (40-100 Hz) and it oc-curs during information processing, perception, anxiety, stress, etc. When there is an absence of gamma wave for a prolonged time, it may denote signs of ADHD, depression and learning disabilities. Gamma waves also occur during REM sleep. The second type known as Beta waves have high frequency and low amplitude. They are the most common in the awake state. The frequency range is from 12Hz to 40Hz. The next type is Alpha Waves which have the frequencies ranging from 8 to 12 Hz. Alpha waves occur when the person is too relaxed and does not sup-port a focussed mind. The next theta waves are involved in daydreaming and sleep. The frequency range is from 4Hz to 8Hz and are slow waves. The slowest recorded brain waves in human beings are said to be in the fifth type Theta waves. They, most often occur in infants and young children. The frequency range is from 0 to 4 Hz. Collection of all these brain data and observing the frequency range over a period of time can help observe special patterns of brain activity in the subject.
2.3
Analysis on EEG and fMRI data
The traditional approach to analysing fMRI data is univariate analysis. Multivariate Statistics involves the observation and analysis of more than one statistical outcome variable at a time. Independent Component Analysis(ICA) used in [1] attempts to decompose a mul-tivariate signal into independent non-gaussian signals. Here the multivariate refers to the voxels. General Linear Model(GLM) was being used in previous research. It
is a generalization of multiple linear regression models when there is a case of more than one dependent variable being involved. The GLM is used to determine whether the means of two or more groups differ. While using GLM to analyse the EEG or fMRI data, it is required to parametrize the data. On the other hand, ICA allows one to explore the factors that contribute the data alone. The authors in [1] study fMRI which is a noninvasive method to understand the state of ones brain. Moreover, it has excellent spatial resolution and the experiment can be repeated any number of times. But fMRI lacks temporal resolution. However, this is compensated by EEG. fMRI might not be able to capture the immediate changes in brain state as it is a slower experiment compared to EEG. The latter records brain wave patterns on a continuous basis and the level of activity or an abnormality at a point in time can be easily monitored. In this paper, ICA is considered to be a superior method of analysis over Principal Component Analysis, which de-correlates the data. ICA involves higher-order statistics to achieve independence. The ICA algorithms used on EEG and fMRI data are InfoMax and FastICA. The interesting feature of ICA is that it is able to disentangle the mixed brain signal and bring out the important signals. It is considered a powerful way to remove artefacts from EEG data. While GLM tends to generalize to a method suitable for drawing inferences from multiple subjects, ICA requires significant clustering effort even if components share similarities across different subjects. Temporal ICA is useful for disentangling mixed EEG signals and also finds use in the preprocessing stage of simultaneously acquired EEGfMRI data. Joint ICA is another approach, which enables the joint decomposition of multi-modal data that have been collected from the same sample of subjects. Since fMRI images are accumulative and cannot capture brain activity at a particular point in time, it is assumed that many fMRI networks affect a particular EEG feature. And so, one way of addressing this problem is by employing multiple regression where modulations are performed on a trial by trial basis on all fMRI for the prediction of EEG activity.
2.4
Machine learning- Training the classifier
with the right data
When it comes to machine learning on biological data, the two main objectives include characterizing a persons mental health individually and characterizing them based on which group they belong to. The former requires classification whereas the latter requires clus-tering. Moreover, the latter requires the data collected not only from the subject under examination but also other volunteers or patients data. The scope of this paper is restricted to classification of brain data. In case of fMRI, classifiers or predictors can be trained using data from voxels [2]. The voxels in regions of interest alone were considered. The training data for classification was taken only on a small scale like 20 at a time and the test data was classified based on the information gained from this. This technique could be used to extract information about a subjects percept on a real time basis. The training data for one particular session was useful to classify the test data which was recorded at some other session. Univariate analysis depends on information contained in the time course of individual voxels. Multivariate analysis considers information contained in activity patterns across space, that is, from multiple voxels. The data used here were the fMRI activation captured while subjects were shown visual representation of various categories of objects. While the subjects look at the images of those objects, the pattern of activity over an independently selected set of voxels is noted. The category is known for the training set. Thus, this pattern is then given to the classifier, along with a label that identifies the category corresponding to the stimulus, and the classifier learns a mapping between patterns of brain activity and stimulus categories. Once the mapping is learnt, the classifier attempts to infer the category of the objects that the subject views.
Variables, that is, features which contain very little information about the uniqueness of a datum only add unrelated noise to the classifier. This degrades the classifier accuracy. This is especially true in the case of EEG data. Similarly, features that contain redundant information for all instances also degrade the accuracy. For this reason, a phase called feature selection is performed before feeding the data to the classifier. Only those set of variables that contain enough information to perform the classification are chosen. Also, the chosen features should not degrade the classifier accuracy and also overfitting has to be avoided. These are the steps to be followed after the data is represented in the correct format. The most fundamental question in cognitive neuroscience deals with the issue of data representation [4], that is, how the information is represented and how it will be transformed while processing. In functional
MRI, the data obtained here is an estimate of local blood flow which can be considered as a proxy for local neural processing. However when data mining is performed, the noise in these large datasets pose a challenge. A solution can be brought about by switching from the consideration of voxels in isolation to the use of multi-voxel patterns. This is because, there are limits on what can be learned from the former about ones cognitive state. On the other hand, pattern classification algorithms applied to multivoxel patterns of activity, called multi voxel pattern analysis (MVPA), enables more sensitive detection of cognitive states. And thus MVPA is trending recently.
This multivariate information between voxels is taken into account in Inverse Inference or Brain Reading [7]. It assesses how some neural populations encode some cognitive information. It employs a prediction function. But the problem faced by this function is that there are more voxels than fMRI volumes. Thus, some techniques like univariate feature selection, agglomeration and regularization can be used before the prediction function is employed. The authors in [7] considers a hierarchical structured regularization. Inverse inference uses pattern recognition tools and statistical learning methods to explore fMRI data. The brain reading method estimates a function based on a set of activation maps. This function can then be used for predicting a target for a new set of fMRI images. This target can be a variable which represents a perceptual parameter, cognitive parameter or behavioural parameter.In [8], the authors consider a training set composed on n pairs. After GLM fitting, each fMRI data point will correspond to an activation map. This data point can be named as x, denotes an fMRI signal with p voxels and with this the authors try to predict a target y.
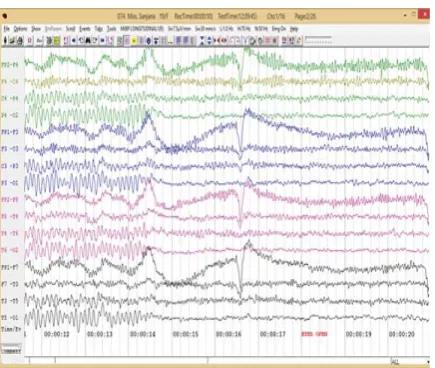
Figure 2: EEG data from the experiment
for this purpose. It is designed to orchestrate a large number of computations on the cloud stating that it is an improvement to the current scenario, where using a single machine for a single user might not tap the entire efficiency of the machine. This study was aimed at devel-oping Brain Computer Interfaces to help those who are not able to control voluntary movements in their body.
3
FEATURE SELECTION AND
CLAS-SIFICATION
Given the nature of the classification algorithms to some-times over-fit the training data, it is important to selec-tively provide only the important features to it. The authors in[11] utilized EEG data collected during eye open/close state. The features were selected using CFS Subset Evaluation, Gain Ratio and Info Gain algorithms. The electrode readings around the frontal, frontalcortex, parietal and occipital lobes were found to be the im-portant features and further classification was performed retaining only those features. A scene recognition test was conducted by our team, in which a persons EEG is recorded while the description of a scene appears on the screen. The text data related to the scene had been centred in the middle of the application on screen and the experiment conducted in quiet conditions. The elec-trodes were paired in 16 different combinations. Thus each record had 16 attributes.
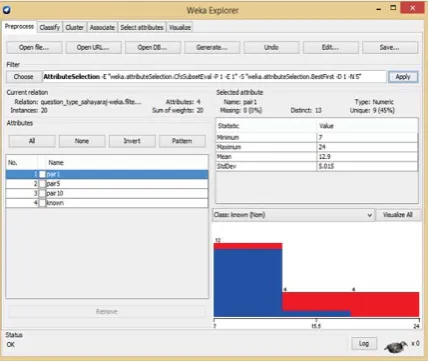
Feature selection was performed on one subjects EEG data. Of the electrode pairs, the ones around the frontal and temporal regions were found to play a crucial role in identifying the mental state of the subject.
Info Gain ranks the electrode pair 10 to be of more im-portance than the other two pairs. There can be a few feature selection algorithms that work well particularly for the experiment or data type. The feature selection
which gave good accuracy with any classifier in [2] was the ANOVA- based feature selection.
Once the important features are selected, classification would be the next focus. The choice of classifier will take efficiency into account. In this process, there is a tendency to limit the amount of information in the data set. In [2], the classifier algorithms used are: a linear support vector classifier, a cubic polynomial classifier and a linear discriminant classifier for fMRI data. [2] achieved multi class classifications by training pairwise binary classifiers, each using a simple voting mechanism and contributes to making the final decision on the target class. Better classification accuracies were seen when the classification was repeated on data not just restricted to retinotopic areas which were focussed on previously.
With fMRI data, though the classifiers are using in-formation distributed across many voxels, it does not necessarily mean that signal is present in every voxel. There is a possibility that only a few voxels contain signals and the remaining merely contain noise. Ashish Farmer, Yash Shah and Haixuan Sun proposed a new method to classify fMRI data which combines the idea of nearest neighbour and Support Vector Machine.
[13] studied the methods of classification of various EEG based diseases using data mining. Of these, J48 was stated to be the most efficient as it gives good sensitivity and good specificity. In the comparison of Nave Bayes and J48 algorithm by Tina Patil et al. J48 again proves to be the winner. In other researches on biological data, feature selection algorithms such as Rank Weight, In-cremental Feature selection and classification algorithms such as Bayes Net, Random Forest were shown to be efficient.
Among the classifier algorithms applied to EEG data on eye-open close state, Instance Based nearest neighbour classification shows good accuracy after selecting the fea-tures through CFS Subset Evaluation or Info Gain or Gain Ratio algorithms [11].
Figure 3: Features selected by CFS
Figure 4: Features selected by Info Gain
Figure 5: Confusion matrix of IBk
4
CONCLUSION
Thus by using the data from fMRI and EEG, the state and degree of brain activity can be determined. When huge amounts of such data are available, data mining and machine learning techniques can be applied to accurately predict the target result. The computations performed on correctly represented fMRI and EEG data, can lead to useful knowledge discovery. This knowledge finds sev-eral real-life applications in diagnosis and treatment of cases such as ADHD, epilepsy, coma, study disorder, hy-pertension and many more.
References
[1] Mining EEG-fMRI using Independent Compo-nent Analysis(ICA)- International Journal of Psychophysiology- 2009 Tom Eichele, Vince D.Calhoun, Stefen Debener.
[2] Functional Magnetic Resonance Imaging(fMRI) brain reading: detecting and classifying distributed patterns of fMRI activity in human visual cor-texNeuroImage 2003- David D.Cox and Robert L.Savoy.
[3] Machine Learning Classifiers and fMRI: A tutorial overview- NeuroImage 2009- Francisco Pereira, Tom Mitchell, Matthew Botvinick.
[4] Beyond Mind Reading: Multi-voxel pattern analysis of fMRI data: Trends in Cognitive Sciences 2006-Seam M.Polyn, Greg J.Detre and James V.Haxbe.
[5] Fundamentals of EEG Measurement- 2002-M.Teplan.
[6] Brain Fingerprinting field studies comparing P300 Mermer and P300 Brainwave responses in the detection of concealed information- 2012 - Lawrence A.Farwell, Drew C.Richardson and Graham M.Richardson.
[7] Multi-scale mining of fMRI data with Hierarchical Structured Sparsity IEEE international workshop on Pattern Recognition in Neuro Imaging- 2011-Rodolphe Jenatton, Alexandre Gramfort, Vincent Michel and Guillaume Obozinski.
[8] Multiscale Mining of fMRI data with Hierarchical Structured Sparsity- Siam J. Imaging Sciences - 2012 - Rodolphe Jenatton, Alexandre Gramfort, Vincent Michel, Guillaume Obozinski, Evelyn Eger, Franis Bach and Bertrand Thirion.
[10] Analyzing Electroencephalograms using Cloud Com-puting Techniques- Kathleen Ericson Shrideep Pal-lickara and Charles W. Anderson.
[11] Binary Categorization of Brain EEG data : A case study International Conference on Intelligent In-formation Technologie- 2014- Sanjana Sahayaraj, Shomona Gracia Jacob.
[12] Shomona Gracia Jacob, Dr.R.Geetha Ramani, Data mining in Clinical Data Sets: A Review, Interna-tional Journal of Applied Information Systems , Vol.4, No.6, pp.15-26, 2012. ISSN: 2249-0868.
[13] Classification of EEG based Diseases using Data Mining Deepika Kundra, Babita Pandey- Interna-tional Journal of Computer Applications 2014.
[14] Shomona Gracia Jacob, Geetha Ramani R., Design and Implementation of a Clinical Data Classifier: A Supervised Learning Approach, Research Journal of Biotechnology (Impact Factor: 0.143), Vol.8, No.2, pp. 16-26, 2013 ISSN: 0973-6263.