Abstract—The Intelligent Transportation System (ITS) in Thailand has been developed since 2009. The Image Sensing Software has also been written and applied with the CCTV cameras, routers, cable communication equipments and servers. Moreover, the software, especially the measurement of each vehicle approaching to a Virtual Loop Detector (VLD) on pavement is evaluated for the classified counting, headway and speed of vehicles. As a result, the starting and final speed can be calculated of the Perception and Reaction Times and Distances (PRT and PRD) for the mitigation of Traffic Accidents.
Index Terms— VLD, PRT, PCE, VMS (Variable Message Sign), PIEV Distances
I. INTRODUCTION
he Development of Image Sensing Technique including CCTVs Concepts and Intelligent Transport System (ITS) will be taken into consideration as follows: Development of Software (Visual C++) for traffic classified counts, headways and the average speed is applied by the virtual loop detectors (VLD). Virtual Loop Detectors have two functions; one is for traffic classified counts, such as five types of vehicles. The other is for vehicle tracking when approaching to VLD and for checking headway within the appropriate times in order to measure the stating and final speed of each vehicle. As a result, the Stopping Sight Distance (SSD) and Passenger Car Unit (PCU) will be calculated. In new PCU Concept, a new empirical formula was found and it is useful for Thai Engineers. In addition, the minimum lane width will be proposed on the existing road in order to increase the efficient capacity of traffic volumes in each lane. Letters Sizes shown on a Variable Message Sign (VMS) are calculated under the criteria of Geometrical Design, especially PIEV (Perception, Intelligent, Emotion and Violation) Distances.
In case of passenger car equivalent (PCE), it was introduced in the 1965. Highway Capacity Manual in U.S.A. defined it as “the number of passenger cars displaced in the traffic flow by a truck or a bus, under the prevailing
Manuscript received February 27, 2016; revised March 25, 2016. This paper was supported in part by the Rural Road Department (DRR), Ministry of Transport, Thailand. Dr.Weeradej Cheewapattananuwong is a Senior Professional Civil Engineer, Bureau of Road Design, 9 Paholyothin Rd., Bangkhen Bangkok 10220 Thailand. (+662-551-5416, email: Engineering) at Faculty of Engineering, Thummasat University, Rangsit Campus, Thailand.
roadway and traffic conditions”. In this research, vehicles are divided into five categories, i.e. passenger cars and pickup, motorcycles, lorries or 6 wheels, heavy truck or 10 wheels or trailers and buses. Because of mixed traffic composition or heterogeneous traffic encountered in Thailand, one of the earlier researches was carried out by Webster and Cobbe in United Kingdom in year 1966. The PCE values derived in their research are then used but with slight adjustment in the JICA Study (2002) by the Royal Thai Police and Municipality of Chiang Mai to design and analyze signalized intersections. However, at the moment, these values may not be representative of rural and suburb traffic conditions in Thailand. Therefore, it is necessary to acquire more realistic PCE values with respect to Thai road conditions.
II. PROCEDURE FOR ITSDEVELOPMENT
A. Open Source of Coding in the Developed Software
In case of Open Source of Coding in the developed software, some parts of Open Source are used for the only blob functions of image sensing software in traffic classified counts. These concepts of blob functions are developed by the Visual C++ Enterprise Edition 6.0 Computer Language and the Open Source referring to
Lane
Changing, Controlled Speed and Other Software are also developed by the Visual C++ Version 8.0 Computer Language.
B. Image Processing Concept
FG/BG Detection module performs foreground / background segmentation for each pixel. Blob Entering Detection module uses the result (FG/BG mask) of FG/BG Detection module to detect new blob object entered to a scene on each frame. Blob Tracking Module initialized by Blob Entering Detection results and tracks each new entered blob. Trajectory Generation module performs a saving function. It collects all blobs positions and save each whole blob trajectory to hard disk when finished. Trajectory post processing module performs a blob trajectory smoothing function. The application of Blob Entering Detection Techniques is shown in Fig. 1.
The Development of ITS for Traffic
Management and Mitigation of Accidents on
Road in Thailand
Weeradej Cheewapattananuwong, Member, IAENG
Fig. 1. Results of the Application of Blob Entering Detection Techniques.
C. Measurement of Speed
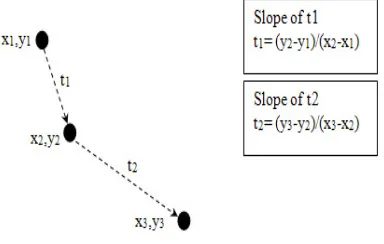
The positions of Lane Changing, which are 3 points, are located on Fig. 2. The first curve of Lane Changing and Speed of circular curve is composed of coordinates among points (x1,y1), (x2,y2), and (x3,y3) respectively. The
[image:2.595.78.270.351.473.2]calculation of angle, length of Lane Changing and speed used the concepts of geometrical design under the specific times as shown.
Fig. 2. Three Points of Lane Changing and Speed Concept
D. The Comparison Results of Video Imaging Vehicle
Detector (VIVD)
The features of the VIVD are composed of the compact size, light weight, aesthetically acceptable appearance, and higher flexibility in installation owing to a built-in zoom lens. Table I shows the comparison of Presence Detection Evaluation of CCTVs.
TABLE I
COMPARISONS OF REQUIREMENTS Requirements Qualifications Details of
VIVD Concepts
Details of New Concepts
Presence Detection
Detection Target Motorcycle and Larger
Motorcycle and Larger Number of Lanes 2 Lanes max 2 Lanes max
Number of Detection Areas
2 max 2 max
Accuracy of Presence Detection
98% to 105% 95% to 100%
Occupancy Accuracy
95% to 105% 93% to 100%
Velocity Measurement
Detection Target Compact Cars and Larger
Motorcycle and Larger Number of Lanes 4 Lanes max 4 Lanes max
Velocity Range 0 to 160 km/hr 0 to 120 km/hr Measuring
Accuracy
90% or Higher 90% or Higher
E. The Comparison Results of the Previous ITS in
Thailand and the Developed ITS
The New ITS were developed and proposed for Thai Users when driving their vehicles safely. The next table presents the new developed ITS which is different from the previous method.
TABLE II
COMPARISON BETWEEN THE ITS OF ROYAL THAI POLICE IN METROPOLITAN BANGKOK AREA AND THE ITS NEW CONCEPTS
OF THIS RESEARCH The Previous Technology The Developed ITS 1. Fixed Cameras for
Traffic Counting only a Major or a Minor Road. 2. Only One Function so as to count Traffic Volumes by Classified Count
3. Traffic Counting of an Intersection (Isolated Traffic Intersection) 4. The applied SDK – Software Development Kids for the phase co-ordination
5. Virtual Loop Detector is not provided for the Ticker of Approaching Vehicle
1. Pan Tilt Zoom CCTV for Traffic Counting and Ticker of Virtual Loop Detector for a Main Road and a Minor Road 2. Two Functions of Virtual Loop Detector: Traffic Classified Count and Ticker of Approaching Vehicle
3.Transferred and Evaluated of Traffic Counting from the CCTVs of Two Intersections so as to propose the Green Wave or Offset Times at Traffic Controllers 4. To develop the System for the Cluster Area Traffic Control in the nearly future 5. To set the Headway within 5 seconds or Green Time becomes Red Time
6. To Count a Number of Lane Changing Vehicles
7. To warn the Lane Changing Vehicles on Variable Message Sign (VMS)
8. Checking the Over Speed on VMS 9. To evaluate and predict Environmental and Fuel Consumption Data
III. PROCEDURE FOR TRAFFIC ENGINEERING DEVELOPMENT
A. Previous PCU Concepts
One of the prominent researches was conducted by Asri Hasan et. al (1993) on PCE values of through vehicles under Malaysian conditions. In their research, they found out that for heavy vehicle categories, the values obtained are lower than the values recommended by Webster. The PCE value of Motorcycles is 0.35. However, the PCE value of motorcycles in Hong Kong was conducted by William H.K. Lam (1994). The finding of this study is that the estimated PCE value for motorcycles in Hong Kong is 0.66.
First, PCU equivalents for various types of vehicles needed to be computed because there has never been any PCU research done at intersections in Thailand.
B. PCU based on Passenger Car Units for
Heterogeneous Traffic Using a Modified Traffic Flow Method
[image:2.595.46.552.591.780.2]In case of heterogeneous traffic in Thailand, vehicles such as, motorcycle, car, van, pickup, light truck, heavy truck, and bus will be driven as shown below.
Car Pickup, Van Heavy Truck
Bus Motorcycle
It can be seen that a motorcycle is located at the middle of the gap between a car and a bus. The motorcycle will also come to the front of a heavy truck and a light truck. Therefore, the p.c.u. –passenger car unit can be calculated by the traffic flow per direction for each type of vehicles as illustrated below;
PCU x = q car-…. / (WL)
q x-….... / (WL)
(1) It can clearly be seen that qcar-… is the flow of traffic entity car -group following to x vehicles –group in heterogeneous traffic (entities/hour) and qx-… is the flow of traffic entity group x vehicles following to x vehicles-group in heterogeneous traffic (entities/hour) and Wl is the lane width (m) for traffic entity group per direction. Therefore,
PCUXi for heterogeneous traffic is the passenger car unit for traffic entity group. Most heterogeneous traffic does not use the delineated lanes marked on the pavement surface. The PCUs in Table III and IV are calculated from the Traffic Flow Method as developed by the researcher.
TABLE III
THE RAW TRAFFIC DATA WITHIN 15 MINUTES DURING OFF-PEAK HOUR FOR THE FLOW OF TRAFFIC ENTITY CAR – GROUP
FOLLOWING TO X VEHICLES GROUP IN HETEROGENEOUS TRAFFIC (ALL TYPES VEHICLES)
Time car - bus bus - car car - HT HT - car LT -LT LT- bus bus - LT LT - HTHT - LT bus - bus bus - HT HT - bus HT - HT
15:00:00 1
0
0
0
0
0
0
1
0
0
0
0
1
15:01:00 1
0
0
0
2
2
0
0
1
1
0
1
0
15:02:00 0
0
0
0
1
0
0
1
0
1
0
0
1
15:03:00 1
0
0
0
0
0
1
1
1
0
1
0
1
15:04:00 0
1
0
0
2
1
2
0
1
0
0
1
0
15:05:00 1
0
0
0
0
1
0
1
0
2
1
0
0
15:06:00 1
1
0
0
0
0
1
0
0
0
0
1
1
15:07:00 1
1
0
0
1
2
0
0
1
1
1
1
0
15:08:00 1
1
0
0
0
1
2
1
1
1
0
0
0
15:09:00 0
1
1
0
2
0
1
1
1
0
0
0
1
15:10:00 0
1
0
0
1
1
1
0
2
0
1
1
1
15:11:00 1
0
0
1
2
0
0
1
1
1
1
0
0
15:12:00 0
0
0
0
1
0
1
1
1
0
1
1
1
15:13:00 0
0
1
0
1
0
0
1
1
1
1
0
0
15:14:00 1
1
0
1
0
0
2
1
0
0
0
1
0
[image:3.595.49.279.55.96.2]15:15:00 0
1
0
0
2
0
0
0
0
1
0
0
1
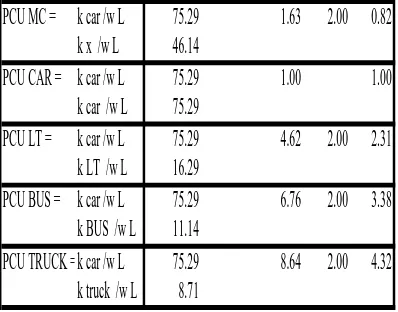
TABLE IV
THE RESULT OF PCU DURING OFF-PEAK HOUR
adjust factor 1 LANES
PCU MC =
k car /w L
75.29
1.63
2.00
0.82
k x /w L
46.14
PCU CAR = k car /w L
75.29
1.00
1.00
k car /w L
75.29
PCU LT =
k car /w L
75.29
4.62
2.00
2.31
k LT /w L
16.29
PCU BUS = k car /w L
75.29
6.76
2.00
3.38
k BUS /w L
11.14
PCU TRUCK =k car /w L
75.29
8.64
2.00
4.32
k truck /w L
8.71
C. The Stopping Sight Distance (SSD) or PRT- Length
[image:3.595.315.514.85.241.2]There are two length of SSD or PRT- Length. One is the PT (Perception Times) Length; the other is the BD (Breaking Distance). From the ITS Model, the 1st car waiting for U Turn at the intersection had an effect on the following car (2nd car). In order to avoid long waiting time, the driver of the 2nd car pulled the car out to change lane; this sudden movement caused the next driver (3rd car) in the adjacent lane to brake suddenly. This sort of behavior is quite common for Thai drivers who undertake the risky maneuver to avoid long waiting times during the red periods and during waiting U Turn periods. However, the action taken by the driver of the 3rd car will be safe if the SSD is less than the average spacing length as can be seen in the bottom right centre of Fig. 4.
Fig. 4. The Measurement of SSD by ITS
Having obtained the length of the Lane Changing (L), the Stopping Sight Distance (SSD) based on the AASHTO’s Standard (2001) is compared with it. If the L value is greater than SSD, drivers will drive their vehicles safely while Lane Changing. Furthermore, the gap spacing or headway is also considered. This is because L must be lower than the gap, otherwise the lane changing vehicle cannot move to another lane.
a
v
t
v
SSD
f f2
*
039
.
0
*
*
278
.
0
+
[image:3.595.311.547.443.614.2]Hence,
v
fis the final speed of Lane Changing of vehicle (m/s) anda
that, is the acceleration (m/s2), is calculated as:s f
s f
t
t
v
v
a
−
−
=
(3) In the equation above,v
sis the starting vehicle speed for Lane Changing (m/s),t
sandt
fare the start and final times for Lane Changing (seconds) respectively andt
is the perception time which is assumed to be 2.5 seconds in this analysis.In case of Lane Changing of vehicle, the researcher developed and used these equations to inform and check the acceptance gap and SSD for the drivers. The speed in purple, the gap length in yellow, the shortest length of Lane Changing in red, and the SSD stopping sight distance in red are taken into consideration.
ASL> ACLL> SSD (4) f
V
SSD
=
0
.
0896671
*
2 (5) H = 1.3 + 0.195 ( (L+A+K) + 0.139 V*N )T = H/6 N = ((H-1.3)/0.195-(L+A+K))/(0.139*V) (6)
In the equation (4), (5) and (6), Average Spacing Length (ASL) is the actual gap of each vehicle. Average Changing Lane Length (ACLL) is the shortest length of Lane Changing as measured from the ITS software. In case of Capital Letters, H is Height of Letters (cm.) in Traffic Signage. T is thickness of Traffic Signage (cm.) and N is numbers of Letters – Row in Traffic Signage.
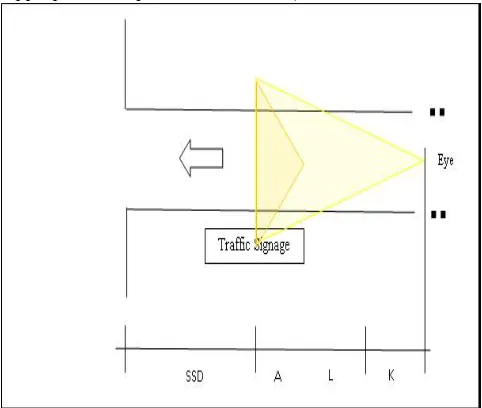
D. The Classified and Reading Traffic Signage Distance
[image:4.595.46.287.531.735.2]This distance as shown in Fig. 5 is based on the three distances such as, L, A, and K. The Reading Time (T) pluses the Focused Letters from Eyes’ Driver (0.5 – 1.26 seconds) and the Reading Times (2 Syllables per second). PIEV (Perception of Stimulus, Interpretation, Evaluation of Appropriate Response and Volition) Times is 2.5 seconds.
Fig. 5. L, A, and K Distances for the Classified and Reading Traffic Signage Distance
L = 0.278*V*T A = 6.30442+0.08586*V+7.44363e-10*V^5
K = 0.278*V*PIEV (7) Where, L is Reading Distances. A is the last distance of Reading Letters in Traffic Signage. K is PIEV Distances and V is Designed Speed (km/hr.).
IV. EVALUATION
A. PCU for Traffic Management and Road Planning
PCU formula is calculated from traffic volumes as can be seen in the following table.
TABLE V
THE PCU – PEAK HOUR AND OFF-PEAK BASED ON THE TRAFFIC FLOW METHOD
Vehicle PCU Peak Traffic Flow
PCU Off-Peak Traffic Flow
Car 1.00 1.00
MC 0.70 0.82
LT 2.07 2.31
Bus 3.16 3.38
Truck 3.82 4.32
These values will be evaluated for the traffic volumes on road so as to find the Level of Service (LOS.) of Road. In addition, the traffic management on road or highway such as, the increasing of lane capacity will be taken into consideration for Road Planning and Lane Management in City or Downtown.
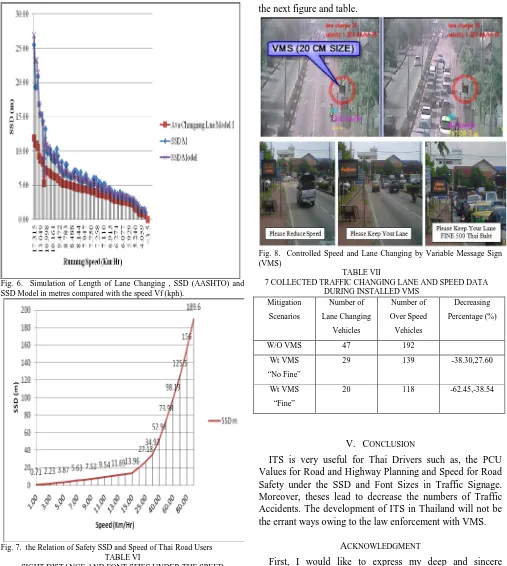
B. Speed for Road Safety under SSD
Fig. 6. Simulation of Length of Lane Changing , SSD (AASHTO) and SSD Model in metres compared with the speed Vf (kph).
Fig. 7. the Relation of Safety SSD and Speed of Thai Road Users TABLE VI
SIGHT DISTANCE AND FONT SIZES UNDER THE SPEED
10 cm 15 cm 20 cm 25 cm 30 cm 35 cm 40 cm 45 cm 50 cm
60
56.85
58.94
61.02
61.85
62.69
63.52
64.35
65.19
66.02
70
63.52
65.95
68.38
69.35
70.32
71.30
72.27
73.24
74.21
80
70.19
72.96
75.74
76.85
77.96
79.07
80.19
81.30
82.41
90
76.85
79.98
83.10
84.35
85.60
86.85
88.10
89.35
90.60
Sizes of Letters in a Traffic Sign
Speed
Form Fig. 6. and Fig. 7. and Table VI, it can be seen that the over speed and lane changing lead to traffic accidents of road users due to the fact that drivers must focus the Compulsory Words and Sizes of Letters in Traffic Signage when reading under the Sight Distances as can be seen from
the next figure and table.
Fig. 8. Controlled Speed and Lane Changing by Variable Message Sign (VMS)
TABLE VII
7 COLLECTED TRAFFIC CHANGING LANE AND SPEED DATA DURING INSTALLEDVMS
Mitigation
Scenarios
Number of
Lane Changing
Vehicles
Number of
Over Speed
Vehicles
Decreasing
Percentage (%)
W/O VMS 47 192
Wt VMS
“No Fine”
29 139 -38.30,27.60
Wt VMS
“Fine”
20 118 -62.45,-38.54
V. CONCLUSION
ITS is very useful for Thai Drivers such as, the PCU Values for Road and Highway Planning and Speed for Road Safety under the SSD and Font Sizes in Traffic Signage. Moreover, theses lead to decrease the numbers of Traffic Accidents. The development of ITS in Thailand will not be the errant ways owing to the law enforcement with VMS.
ACKNOWLEDGMENT
[image:5.595.46.553.48.614.2]REFERENCES
[1] A Policy on Geometric Design of Highways and Street, AASHTO (The American Association of State Highway and Transportation Officials), (Green Book), 2001
[2] A. Hasan, R. U. Radin Sohadi and M. R. Karim. Passenger Car Unit (pcu) of Through Vehicles under Malaysian Condition. The Monthly Bulletin of the Institution of Engineers Malaysia, pp. 5–9, 1993 [3] Highway Capacity Manual – 1965, Highway Research Board, HRB
Special Report 87, 1965
[4] Highway Capacity Manual – 2000, Transportation Research Board, National Research Council, ISBN 0-309-06681-6, Oct. 2000
[5] Opencv Processing and JAVA Library.
http://ubaa.net/shared/processing/opencv/. Accessed July, 2008 [6] The Study on Improvement of Road Traffic Environment in Chiang
Mai City in the Kingdom of Thailand, Japan International Cooperation Agency (JICA). Kingdom of Thailand, Royal Thai Police and Municipality of Chiang Mai, Interim Report II, March 2002
[7] Trafficware Synchro Version 6, Traffic Engineering and Simulation Software (1993-2005), 2005
[8] Webster, F.V. and Cobbe B.M., 1966, “Traffic Signals”, Road Research Technical Paper No. 56, Road Research Laboratory, London.