ISSN Online: 2165-4018 ISSN Print: 2165-400X
DOI: 10.4236/jsbs.2019.92005 Jun. 3, 2019 64 Journal of Sustainable Bioenergy Systems
Effect of Drying Air Velocity on Drying Kinetics
of Tomato Slices in a Forced-Convective Solar
Tunnel Dryer
Mamouda Moussa Na Abou
1,2, Saïdou Madougou
2, Makinta Boukar
21Energy-Environment-Development Niger (ENDA Energy Niger), Niamey, Niger
2Laboratoire d’Energétique, d’Electronique, d’Electrotechnique, d’Automatique et d’Informatique Industrielle (LEEII), Université Abdou Moumouni, Niamey, Niger
Abstract
The objective of this work is to analyse the extent to which a change in the drying air velocity may affect the drying kinetics of tomato in a forced-convective solar tunnel dryer. 2 m∙s−1 (V
1) and 3 m∙s−1 (V2) air speeds were applied in similar drying air temperature and humidity conditions. Main drying constants calculated included the drying rate, the drying time and the effective water diffusivity based on the derivative form of the Fick’s second law of diffusion. Henderson and Pabis Model and Page Model were used to describe the drying kinetics of tomato. We found that solar drying of tomato occurred in both constant and falling-rate phases. The Page Model appeared to give a better description of tomato drying in a forced-convective solar tunnel dryer. At t = 800 min, the drying rate was approximately 0.0023 kg of water/kg dry matter when drying air velocity was at 2 m/s. At the same moment, the drying rate was higher than 0.0032 kg of water/kg dry matter when the drying air velocity was 3 m/s. As per the effective water diffusivity, its values changed from 2.918E−09 m2∙s−1 to 3.921E−09 m2∙s−1 when drying air velocity was at 2 and 3 m∙s−1 respectively, which is equivalent to a 25% in-crease. The experimentations were conducted in Niamey, on the 1st and 5th of January 2019 for V2 and V1 respectively. For both two experiments, the start-ing time was 9:30 local time.
Keywords
Solar Dryer, Tomato, Air Velocity, Modeling, Diffusivity
1. Introduction
Drying is the most common preservation technique used to extend the shelf life How to cite this paper: Moussa Na Abou,
M., Madougou, S. and Boukar, M. (2019) Paper Title. Journal of Sustainable Bio-energy Systems, 9, 64-78.
https://doi.org/10.4236/jsbs.2019.92005
Received: March 8, 2019 Accepted: May 30, 2019 Published: June 3, 2019
Copyright © 2019 by author(s) and Scientific Research Publishing Inc. This work is licensed under the Creative Commons Attribution International License (CC BY 4.0).
DOI: 10.4236/jsbs.2019.92005 65 Journal of Sustainable Bioenergy Systems of fresh vegetables and fruits as well as to facilitate their transportation and sto-rage [1]. In Niger, tomato (Solanum lycopersicum L.) is one of the most promi-nent fruits massively produced particularly during the dry and cold season. The FAO [2] has estimated the gross production of tomatoes in 2012 in Niger at 188,767 tons. This production is far beyond the ones in neighboring countries like Mali (42,000 tons) or Burkina Faso (15,000 tons). The FAO Save Food Initi-ative [3] evaluated over 45% of post harvest losses of fruits and vegetables in de-veloping countries. In Niger, 15% of dried tomatoes and onions are discarded while 65% sold with high levels of quality losses [4]. In order to avoid post harv-est losses of tomato production, improve quality of dried tomatoes and respond to the significant demand of dried tomatoes in Niger, solar drying appears to be an effective method. Solar tunnel dryer reduces crop losses, improves the quality of dried product significantly and is economically beneficial compared to tradi-tional drying methods. Solar dryers must be properly designed in order to meet particular drying requirements of agricultural products and give satisfactory performance concerning energy requirements. In solar drying, operating condi-tions significantly affect the quality of the end product. Our work consisted in assessing the extent to which the velocity of the drying air can affect the drying kinetics. In other terms, we will look at the influence of changing the drying air velocity on the drying rate, the drying time and the effective diffusivity of water in tomato slices during drying. Drying curves of tomato were devised based on the indirect method consisting in monitoring of the drying air humidity [5] in-stead of the humidity of the tomato slices themselves. Simulation models are valuable tools for prediction of performance of solar drying systems [6]. We used Henderson and Pabis Model and Page Model to describe drying kinetics of tomato slices. Few authors concluded that drying of tomatoes is occurring only in the falling rate phase. At the same time, other authors have rather established that drying of tomatoes is occurring in both a constant rate and a falling rate phases. From our experiments, we found that tomato slices drying was occurring in both constant rate and falling rate phases. Experimental conditions emerged as key factors making a difference in whether both a constant rate and a falling rate phases could be observed or not. This paper describes the materials and methods we used and compares the results with those obtained by other authors. All experiments were conducted under climatic conditions of Niamey (Niger) during the first week of January 2019.
2. Theoretical Background
2.1. Drying Kinetics
The drying kinetics of tomato was established by plotting ΔX against time. ΔX represents the difference between absolute humidity of the drying at the exit and the entrance of the tunnel dryer. The absolute humidity X of the inlet and outlet drying air was calculated based on Formula (1):
0.622 vsat vsat P X
P P
ϕ ϕ ∗
= ∗
DOI: 10.4236/jsbs.2019.92005 66 Journal of Sustainable Bioenergy Systems
ϕ
represents the relative humidity (%).vsat
P the saturation vapour pressure of water at the operating temperature (Ta).
P total pressure equals to the atmospheric pressure (Pa). Nadeau J. P. et al.[7]
proposed Formulas (2) and (3) for the calculation of Pvsat.
2
3802.7 472.68
exp 23.3265 for 0 45 C
273.18 273.18 vsat a a a P T T T
= − − < <
+ +
(2)
3816.44
23.1964 for 45 C
273.18
vsat a
a
P T
T
= − >
+ (3)
2.2. Drying Curves
The general form of a curve characterizing the drying kinetics of solids is ob-tained by plotting the product moisture content dry basis (Mp) against time (t). The most completed form of a drying curve consists of a transition phase where the product is eventually being heated, a constant-rate drying phase corres-ponding to the evaporation of free water on the surface of the product [8] and a Falling-rate drying phase characterized by a decrease in the migration of hu-midity from inside the product when this huhu-midity is no longer sufficient to sa-turate the surface of the product. For fruits, most vegetables and most tropical tuber crops, the initial moisture content is above the critical moisture content usually, thus the drying of these products would take place within both the con-stant and falling-rate drying periods [9].
2.3. Determination of Drying Constants
Drying constants are determined from graphical representation of moisture content Mp ((kg water)/(kg dry matter)) of tomato slices, the drying rate DR = ((kg water)/(kg dry matter))/min and the moisture ratio MR (Equation (4)) over time. 0 t e e M M MR M M − =
− (4)
t
M is the moisture content of the product at any time (kg water/kg dry mat-ter), Me the moisture content at equilibrium (kg water/kg dry matter) and
0
M the initial moisture content (kg water/kg dry matter). Variation of moisture ratio over time is governed by Luikov equations derived from the second law of Fick on diffusion. Water diffusivity in tomato slices can be calculated from Lui-kov Equations (5) and (6) used to predict the gradient of temperature (T) and moisture (M) inside tomato slices.
2 1 2
eff a
M D M M
t x x x
∂ = ∂ + ∂
∂ ∂ ∂ (5)
2 1 2
a
T T T
t
α
x x x
∂ = ∂ + ∂
DOI: 10.4236/jsbs.2019.92005 67 Journal of Sustainable Bioenergy Systems Parameter a1 = 0 for planar geometries, a1 = 1 for cylindrical shapes and a1 = 2 for spherical shapes [10]. Analytical solutions of Equation (5) leads to Equation (7) valid over the falling-rate phase [11]:
(
)
(
)
2 21 1 2
2
2 1 π
1 exp 2 1 eff t e i cr e
i D t
M M
MR A
M M i A
∞ = − − = = −
−
∑
− (7)cr
M is the moisture content of the tomato slices at critical point. A1 and
2
A are constants (Table 1) depending on the geometry of the product being dried.
Henderson and Pabis [12] proposed a model for describing drying process by using Fick’s second law of diffusion. For sufficiently long drying times, only the first term (i = 1) of the general series solution of Equation (7) can be used with small error. Equation (7) can therefore be written as:
2 1 2 π exp eff t e cr e D M M
MR A t
M M A
−
= = −
− (8)
Assuming Deff is constant during the drying process, Equation (8) can be
written as:
(
)
exp t e cr e M MMR a k t
M M
−
= = ⋅ − ⋅
− (9)
where a and k are drying constants in the Henderson and Pabis Model.
The Page Model was developed by Page, C. [13]. This model was widely used to describe drying kinetics of food materials. The Page Model is a simple exponential model, which approximated the 2
8
π ratio as being equal to unity but introduced new constants as follows:
(
)
exp y
MR= −kt (10)
where k and y are drying constants associated with this model.
2.4. Effective Water Diffusivity
Calculation of effective water diffusivity was based on Equation (7). Assuming slab geometry for tomato slices, Equation (7) can further be simplified in a linear form as follows:
(
)
82 π2 2ln ln π 4 eff D MR t H = −
(11)
Table 1. Values of geometric constants according to the product geometry.
Product geometry A1 A2
Infinite slab with H as half thickness 2
8
π 4H2
Sphere with r as radius 2
6
DOI: 10.4236/jsbs.2019.92005 68 Journal of Sustainable Bioenergy Systems where, Deff is given by the slope
2
2
π 4
eff D
H .
H is the half thickness of the slices. In our experiments, drying was taking place through both sides of the slices. Plotting ln
( )
MR = f t( )
allow the deter-mination of the slope of Equation (11) and subsequently the deterdeter-mination ofeff
D . Application of Fick’s second law of diffusion in the calculation of water diffusivity required assumptions of moisture migration being governed by diffu-sion, negligible or constant shrinkage of slices, constant diffusion coefficients and temperature [14].
3. Materials and Methods
3.1. Materials
Thermo hygrometers
The thermo hygrometers served to measure relative humidity and tempera-ture of the inlet and outlet drying air. The specifications of these thermo hygro-meters are summarized in Table 2.
The thermo hygrometers act as data loggers with automatic and manual log-ging modes. In the automatic loglog-ging mode, the thermo hygrometers’ memory can store up to 8124 records at time intervals of 10 s to 24 h.
Thermo anemometer
A Kestrel type thermo anemometer (0.3 to 40 m/s sensibility) served to meas-ure the speed of the drying air. Air temperatmeas-ure and relative humidity ranges are −29˚C to 70˚C ± 1˚C and 5 to 95% ± 3% respectively.
The precision balance
A SCALIX CB-310 model balance was used to weight the tomato slices before and after the drying process. The capacity and the precision of the balance are 300 g and 0.01 g respectively.
The cutting tools
Cutting tools were used to for peeling and trenching the tomatoes into regular slices in preparations for drying. These cutting tools include a kitchen slicer and few knives.
Moisture analyser
A PCE-MA Series moisture analyser was used to determine the initial (M0)
[image:5.595.185.538.619.746.2]and final moisture contents (Mf) of tomato samples. Three heat-up modes are
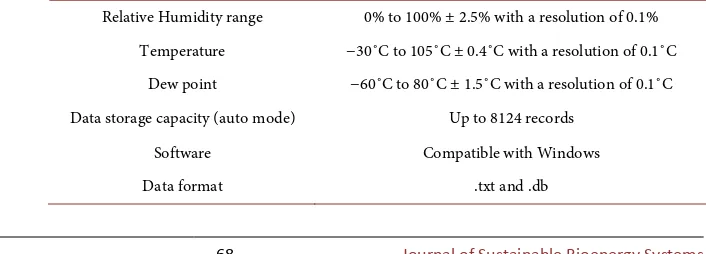
Table 2. Values of geometric constants according to the product geometry.
Relative Humidity range 0% to 100% ± 2.5% with a resolution of 0.1% Temperature −30˚C to 105˚C ± 0.4˚C with a resolution of 0.1˚C
Dew point −60˚C to 80˚C ± 1.5˚C with a resolution of 0.1˚C Data storage capacity (auto mode) Up to 8124 records
Software Compatible with Windows
DOI: 10.4236/jsbs.2019.92005 69 Journal of Sustainable Bioenergy Systems available. The Standard heat-up mode is the default mode which is suitable for most sample types. In this heat-up mode, 120˚C are reached after approximately 4 minutes. The Quick heat-up mode is suitable for samples with a high moisture content. In this heat-up mode, 120˚C are reached after approximately 1 minute. The Slow heat-up mode is suitable for samples with low moisture content. In this heat-up mode, 120˚C are reached after approximately 8 minutes. Dry mat-ter, initial and final moisture content of tomato samples were determined by us-ing the Standard heat-up mode. The measurement is stopped automatically when the measured value is constant over a certain period of time.
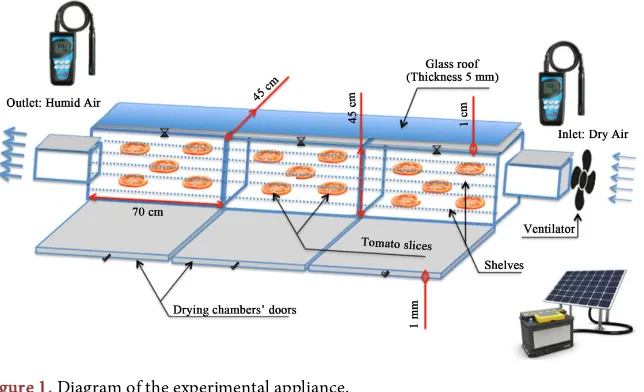
Experimental dryer
Our locally manufactured experimental dryer is a forced-convective tunnel dryer made up of a one-millimetre thick metallic sheet. The experimental ap-pliance in Figure 1 gives the form and the size of the dryer.
3.2. Method
3.2.1. Preparation of the Products to Be Dried
Around twelve kilograms of ripen tomatoes were selected bearing in mind to avoid fruits that are either too ripe (broken) or hard (not ripe enough). The product is then weighted, washed, wiped and cut into regular circular slices. Since the drying rate reduces—by 4.5% as a result of a 1 mm thickness increase
[15]—the tomatoes were cut into slices of approximately 3 mm thick. The toma-toes are then placed on shelves in the drying chambers. The variety of tomato we used is called “Roma”. It is locally produced, primarily during cold season [16].
3.2.2. Experimental Procedure
[image:6.595.215.537.525.721.2]The drying experiments were launched at 09:30 am. The dryer was placed under sun heat. The entire drying energy is therefore coming from the sun. In order to capture a maximum solar heat, the tunnel dryer was placed in a West-East direc-tion. The tomatoes to be dried were evenly placed on shelves in the drying chambers. A fan powered by a solar panel was used for air convection throughout
DOI: 10.4236/jsbs.2019.92005 70 Journal of Sustainable Bioenergy Systems the tunnel dryer. After every minute, the two thermo hygrometers automatically record the values of the drying air relative humidity, temperature and dew point at the entry and exit of the experimental dryer. In order to eliminate the maxi-mum of water content from the product and predict its storage conditions, the drying process was conducted continuously and over two consecutive days without interruption.
After the two days of experimentation, the recorded data (temperature, rela-tive humidity and dew point of the drying air) was transferred from the data loggers to a computer in the form of tables.
The values of relative humidity were converted into absolute humidity. The difference ΔX between absolute humidity of the drying air at the exit and the entrance of the dryer was therefore calculated. We assumed that ΔX represents the actual moisture content being removed from the product every minute.
This experimental procedure was repeated in one hand with a drying air ve-locity of V1 = 2 m/s and in another a drying air velocity of V2 = 3 m/s.
3.2.3. Characterization of Drying Kinetics
In our work, the method we used for characterizing drying kinetics for tomato was based upon the “indirect” method, which consisted in recording over time, the inlet and outlet variation of the humidity of the drying air instead of the hu-midity of the product itself.
From a mass balance, the amount of water transported by the inlet and outlet drying air was calculated. Assuming that, the moisture gains (ΔX) of the drying air was taken from the tomato slices, dry basis moisture content and drying rate were calculated. Moisture ratio at any time was therefore calculated based on Formula (4).
Moisture ratio versus moisture content dry basis curves were adjusted in one hand with the Henderson & Pabis Model, given by Equation (9) and in another with the Page Model given by Equation (10) to determine the values of drying constants k, a and y. The adjustment was performed by the use of Solver Tool from Microsoft Excel 2011 software, minimizing the root mean square error between the experimental values and those calculated based on the models.
4. Results and Discussion
4.1. Experimental Conditions
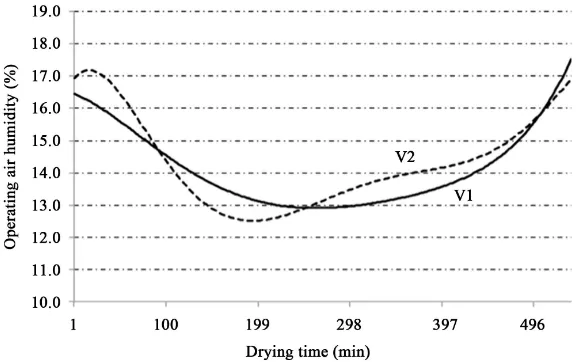
All drying experiments were conducted under uncontrolled temperature and air humidity conditions. The drying air velocity was however maintained at a con-stant value of V1 = 2 m/s and V2 = 3 m/s over two sets of experiments. The inlet section of the experimental drier was 24 × 24 cm2, which gives an applied airflow of 6.912 m3/min and 7.488 m3/min when the drying air velocity was 2 m/s and 3 m/s respectively. Figure 2 and Figure 3 give the evolution of drying air temper-ature and relative humidity over a one-day drying process.
DOI: 10.4236/jsbs.2019.92005 71 Journal of Sustainable Bioenergy Systems Figure 2. Similarity of drying air temperatures under V1 and V2 drying air velocities.
Figure 3. Similarity of drying air relative humidity under V1 and V2 drying air velocities.
conditions, remained relatively constant. Maximum difference of drying air temperatures was less than one degree Celsius (Figure 2).
The relative humidity of the drying air also remained basically constant
(Figure 3) during the two experiments when drying air velocity was at 2 and 3
m/s respectively. Maximum difference in relative air humidity was less than 1% over the two experiments. Ahouannou C. et al.[17] satisfactory worked at am-bient air humidity since the observed slight fluctuations did not significantly af-fect the results.
4.2. Drying Curves
Show in Figures 4-9.
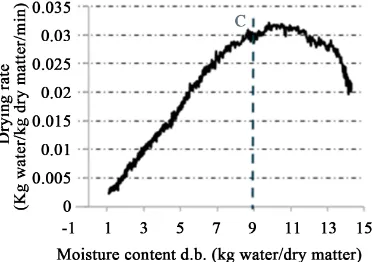
4.3. Drying Phases
Figures 4-7 show that drying of tomato takes place over two drying phases
namely the constant-rate (BC) and the falling-rate (CD) phases. Figure 5 and
Figure 8 are Krischer form of representing drying curves [18]. Figure 5 and
DOI: 10.4236/jsbs.2019.92005 72 Journal of Sustainable Bioenergy Systems Figure 4. Time variation of tomato slices’ drying rate under V1 drying air velocity.
[image:9.595.275.472.584.706.2]Figure 5. Krischer form of drying curve for tomato slices under V1 drying air velocity.
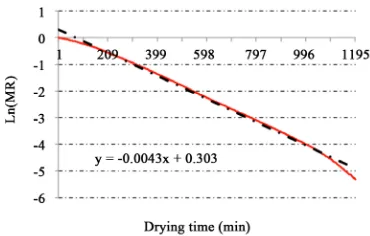
Figure 6. Time variation of normal logarithm of moisture ratio under V1 drying air ve-locity.
DOI: 10.4236/jsbs.2019.92005 73 Journal of Sustainable Bioenergy Systems Figure 8. Krischer form of drying curve for tomato slices under V2 drying air velocity.
Figure 9. Time variation of normal logarithm of moisture ratio under V2 drying air ve-locity.
[image:10.595.280.465.235.353.2]hu-DOI: 10.4236/jsbs.2019.92005 74 Journal of Sustainable Bioenergy Systems midity.
On the other hand, few authors reported the existence of both a constant-rate and a falling-rate drying phases. Reyes A. et al.[22] investigated on tomato de-hydration in a hybrid-solar dryer at temperatures ranging from 50˚C to 60˚C with drying curves obtained from samples of the solids removed from sectors of the dryer, weighed on a digital balance and then put back in the dryer every 30 minutes. They observed a constant rate and falling rate phases even if the transi-tion between the two phases was hard to establish. T. J. Gaware et al.[23] stu-died and compared different methods of drying of tomato. They observed that microwave vacuum and freeze-drying processes showed both a constant and falling rate periods. André Charreau et al. [24] remarked that a constant rate phase and subsequently a critical point, are not always observable and in case they are observed, this is highly dependent on the experimental conditions. In fact, the constant rate phase is often short. Intermittent disruption of experi-ments in order to measure the weight loss of the tomato slices, is likely to disturb the steady state of the system and prevent from observation of a constant rate phase. Conversely, our experiments were rather based on the analysis of the drying air properties—instead of the status of the tomato slices themselves—so that measurements take place in a continuous way with automatic records of drying air properties every minute and over several days. In other terms, a con-stant rate phase alongside with a falling rate phase would be easily observed when weight losses are monitored on the product with no need for stopping the entire experiment periodically.
In our experiments under V1 and V2 air velocity, the critical points occurred after 200 and 175 minutes respectively (Figure 4 and Figure 7). This means greater drying air velocity leads to earlier critical point during the drying process because of stronger convection and subsequently shorter drying time. As per the critical moisture content, its values were at 9 and 8 kg water/kg dry matter when drying air velocity was at 2 and 3 m/s respectively (Figure 5 and Figure 8).
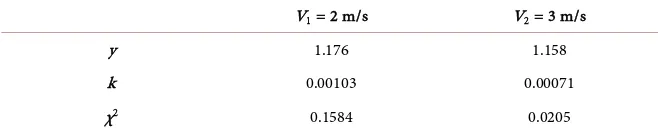
4.4. Drying Models
We used two drying models to describe drying kinetics of tomato slices. These models are the Henderson & Pabis Model and the Page Model. Both models were derived from Fick second law of diffusion. Drying constants associated with the Henderson & Pabis Model are summarized in Table 3.
DOI: 10.4236/jsbs.2019.92005 75 Journal of Sustainable Bioenergy Systems Table 3. Drying constants and χ2 from Henderson & Pabis model under V
1 and V2 drying air velocities.
V1 = 2 m/s V2 = 3 m/s
a 1.082 1.104
k 0.0032 0.0036
χ2 0.2604 0.6090
Table 4. Drying constants and χ2 from Page Model under V
1 and V2 drying air velocities.
V1 = 2 m/s V2 = 3 m/s
y 1.176 1.158
k 0.00103 0.00071
χ2 0.1584 0.0205
As per constant k, it is sensitive to experimental conditions so the variation in its values when drying air velocity varied from 2 to 3 m/s. The values of con-stants a and k we obtained are summarized in Table 3. Application of higher air velocities (2 and 3 m/s) may explain slightly higher values of constant k in our experiments.
In the Page Model, constants y and k (Table 4) were introduced to get a greater accuracy of the Lewis [27] Model. Sana Ben Mariem [28] applied the Page Model in modeling the drying kinetics of tomatoes. They found drying constants k = 0.00118 and y = 1.05835 at 38˚C and air velocity of 1 m/s. These values are close to values we found with application of Page Model in similar temperature conditions but at air velocity of 2 m/s (Table 4).
4.5. Water Diffusivity
Diffusivity is a key parameter for designing and calculating of industrial dryers. It is a function of the product to be dried but it is mainly a function of operating conditions. The effective moisture diffusivity (Deff ) increases with increasing air
velocity and temperature. From our experiments, we found values of Deff in
tomato slices equal to 2.918E−09 m2/s and 3.921E−09 m2/s when the drying air velocity was 2 m/s and 3 m/s respectively. These values were calculated from Equation (11) and slopes of ln
( )
MR = f t( )
(Figure 6 and Figure 9). Madam-ba et al.[29] found that for food materials, Deff values are in the range of 10−11 to 10−9 m2/s. Moreover, Zafer Erbay et al. [30] found statistical accumulation (86.2%) of Deff values of foods that were dried in a convective type batch dryer,in the region of 10−10 to 10−8 m2/s. These values are both in line with those we found for tomato drying.
[image:12.595.209.538.203.270.2]DOI: 10.4236/jsbs.2019.92005 76 Journal of Sustainable Bioenergy Systems
5. Conclusion
Our results revealed the existence of both a constant and a falling-rate drying phases. The constant-rate phase occurred at a drying rate of around 0.03 kg wa-ter/kg dry matter/min in both experiments with V1 and V2 drying air velocities. It appeared that the existence of a constant and a falling rate phases is strongly related to the continuous but indirect measurements of water losses in the product being dried during the experiments. This is in contrast with intermittent disruption of experiments in order to measure weight loss on the product, which is likely to disturb the system and prevent from observing a constant rate phase. Conducting our experiments in real-world conditions with uncontrolled tem-perature and drying air humidity was another significant difference compared with drying experiments conducted in laboratories. The drying constants we obtained from modelling of drying kinetics for tomatoes are in the range of val-ues obtained by other authors who worked on forced convective solar drying experiments. The values we found for effective diffusivity (Deff ) of water (2.918E−09 m2/s under V
1 and 3.921E−09 m2/s under V2) are in the range of values (1E−10 to 1E−8 m2/s) agreed by majority of authors we reviewed. Our study demonstrated that drying air velocity has a significant impact on the dry-ing kinetics. Increasdry-ing the air velocity from 2 to 3 m/s has led to 25% increase in effective diffusivity of water in tomato slices during drying. Greater drying air velocity leads to earlier critical point and shorter drying time during the drying process.
Acknowledgements
We would like to thank Professor Eric DUMONT (Service de Thermodynami-que—Ecole Polytechnique de Mons—Université de Mons, Belgique), Professeur Emérite Jacques BOUGARD (Ingénieur Civil AIMs—Ecole Polytechnique de Mons—Université de Mons, Université Libre de Bruxelles—Belgique) for pro-viding valuable help in data analysis.
Conflicts of Interest
The authors declare no conflicts of interest regarding the publication of this pa-per.
References
[1] Dorouzi, M., Mortezapour, H., Akhavan, H.-R. and Moghaddam, A.G. (2018) To-mato Slices Drying in a Liquid Desiccant-Assisted Solar Dryer Coupled with a Pho-tovoltaic-Thermal Regeneration System. SolarEnergy, 162, 364-371.
https://doi.org/10.1016/j.solener.2018.01.025
[2] FAO (2019) Niger—Production Alimentaire: Tomates. Perspectives Monde, Un-iversité de Sherbrooke, Lettreset Sciences Humaines, Ecole de Politique Appliquée. http://perspective.usherbrooke.ca/bilan/servlet/BMTendanceStatPays?langue=fr&co dePays=NER&codeStat=RSA.FAO.Tomatoes&codeStat2=x
DOI: 10.4236/jsbs.2019.92005 77 Journal of Sustainable Bioenergy Systems Food and Agriculture Organization of the United Nations (FAO), Vialedelle Terme di Caracalla 00153, Rome, Italy.
[4] Troger, K., Henselb, O. and Bürkert, A. (2007) Conservation of Onion and Tomato in Niger—Assessment of Post-Harvest Losses and Drying Methods. Conference on International Agricultural Research for Development, University of Kas-sel-Witzenhausen and University of Göttingen, 9-11 October 2007.
[5] Kemp, I.C., et al. (2001) Methods for Processing Experimental Drying Kinetics Da-ta. Drying Technology, 19, 15-34. https://doi.org/10.1081/DRT-100001350
[6] Steinfeld, A. and Segal, I. (1986). A Simulation Model for Solar Thin Layer Drying Process. DryingTechnology, 4, 535-554.
https://doi.org/10.1080/07373938608916349
[7] Nadeau, J.P. (1995) Séchage: des processus physiques aux processus industriels. Tec & Doc Lavoisier, Cachan.
[8] Bonazzi, C. and Bimbenet, J.-J. (2003) Séchage des produitsalimentaires: Principes. Institut national agronomique de Paris-Grignon, École nationale supérieure des industries agricoles et alimentaires (ENSIA).
[9] Ekechukwu, O.V. (1995) Drying Principles and Theory: An Overview. University of Nigeria and the International Centre for Theoretical Physics, Trieste, Italy.
[10] Luikov, A.V. (1966) Heat and Mass Transfer in Capillary-Porous Bodies. Pergamon Press,London. https://doi.org/10.1016/B978-1-4832-0065-1.50010-6
[11] Dissa, A.O. (2007) Séchage Convectif et solaire de la mangue (Mangifera Indica L.): Caractérisation expérimentale, modélisation et simulation du procédé telecharger. Editions Universitaires Européennes.
[12] Henderson, S.M. and Pabis, S. (1961) Grain Drying Theory II: Temperature Effects on Drying Coefficients. Journal of Agricultural Engineering Research, 6, 169-174. [13] Page, C. (1949) Factors Influencing the Maximum Rates of Air-Drying of Shelled
Corn in Thin Layer. Unpublished M.S. Thesis, Purdue University, Lafayette, IN. [14] Crank, J. (1975) Mathematics of Diffusions. 2nd Edition, Oxford University Press,
London.
[15] Villa-Corrales, L., Flores-Prieto, J.J., Xamán-Villaseñor, J.P. and García-Hernández, E. (2010) Numerical and Experimental Analysis of Heat and Moisture Transfer during Drying of Ataulfo Mango. Journal of Food Engineering, 98, 198-206. [16] RECA (2016) La tomate au Niger. Présentation préparée par le RECA.
[17] Ahouannou, C., Jannot, Y., Lips, B. and Lallemand, A. (2000) Caractérisationet-Modélisation du Séchage de trios Produits tropicaux: Manioc, gingembre et gombo. Sciences de Aliments, 20, 413-422. https://doi.org/10.3166/sda.20.413-432
[18] Krischer, O. (1963) Die Wissenschaftlichen Grundlagen der Trocknungstechnik. Springer-Verlag, Berlin. https://doi.org/10.1007/978-3-662-26011-1
[19] Samimi-Akhijahani, H. and Arabhosseini, A. (2018) Accelerating Drying Process of Tomato Slices in a PV-Assisted Solar Dryer Using a Sun Tracking System. Renewa-bleEnergy, 123, 428-438. https://doi.org/10.1016/j.renene.2018.02.056
[20] Sacilik, K., Keskin, R. and Elicin, A.K. (2005) Mathematical Modelling of Solar Tunnel Drying of Thin Layer Organic Tomato. Journal of Food Engineering, 73, 231-238.
[21] Doymaz, I. (2006) Air-Drying Characteristics of Tomatoes. Journal of Food Engi-neering, 78, 1291-1297. https://www.elsevier.com/locate/jfoodeng
DOI: 10.4236/jsbs.2019.92005 78 Journal of Sustainable Bioenergy Systems Hybrid-Solar Dryer. Journal of Chemical Engineering & Process Technology, 5, 4. https://doi.org/10.4172/2157-7048.1000196
[23] Gaware, T.J., Sutar, N. and Thorat, B.N. (2010) Drying of Tomato Using Different Methods: Comparison of Dehydration and Rehydration Kinetics. Drying Technol-ogy, 28, 651-658. https://doi.org/10.1080/07373931003788759
[24] Charreau, A. and Cavaillé, R. (1995) Séchage, Théorie et calculs. Techniques de l’Ingénieur, traité Génie des procédés.
[25] Yağcioğlu, A., Demir, V. and Günhan, T. (2007) Effective Moisture Diffusivity Es-timation from Drying Data. Tarım Makinaları Bilimi Dergisi, 3, 249-256.
[26] Zogzas, N.P. and Maroulis, Z.B. (1996) Effective Moisture Diffusivity Estimation from Drying Data: A Comparison between Various Methods of Analysis. Drying Technology, 14, 1543-1573. https://doi.org/10.1080/07373939608917163
[27] Lewis, W.K. (1921) The Rate of Drying of Solid Materials. Journal of Industrial and Engineering Chemistry, 13, 427-432. https://doi.org/10.1021/ie50137a021
[28] Ben Mariem, S. and Ben Mabrouk, S. (2014) Drying Characteristics of Tomato Slic-es and Mathematical Modeling. International Journal of Energy Engineering, 4, 17-24.
[29] Madamba, P.S., Driscoll, R.H. and Buckle, K.A. (1996) The Thin-Layer Drying Characteristics of Garlic Slices. Journal of Food Engineering, 29, 75-97.
https://doi.org/10.1016/0260-8774(95)00062-3
[30] Erbay, Z. and Icier, F. (2010) A Review of Thin Layer Drying of Foods: Theory, Modeling, and Experimental Results. Critical Reviews in Food Science and Nutri-tion, 50, 441-464.