ISSN Online: 2327-4344 ISSN Print: 2327-4336
DOI: 10.4236/gep.2019.77007 Jul. 26, 2019 74 Journal of Geoscience and Environment Protection
Estimation of the Impact of Climate Change on
Water Resources Using a Deterministic
Distributed Hydrological Model in Côte
d’Ivoire: Case of the Aghien Lagoon
Wa Kouakou Charles N’Dri
1,2, Séverin Pistre
2*, Jean Patrice Jourda
1, Kan Jean Kouamé
11Laboratory of Sciences and Techniques of Water and Environment, Felix Houphouet-Boigny University of Cocody-Abidjan, Abidjan, Côte d’Ivoire
2IRD, CNRS, HSM, University of Montpellier, Montpellier, France
Abstract
This work aims to evaluate the impact of climate change on the quantitative availability of the Aghien lagoon located in the north of the Abidjan district in Côte d’Ivoire. In the first step, the semi-distributed SWAT (Soil and Water Assessment Tools) based physical model (Arnold et al., 1998) was calibrated and validated at the monthly time step over the period 1960-1981, in the Me watershed for which data from flow rates are available. SWAT was then ap-plied on the watershed of the lagoon of Aghien which is ungauged but for which the challenges are considerable for the drinking water supply of the Abidjanese population. In the second step, the gross outputs (precipitation, temperatures) of six climate models of the CORDEX-Africa project under the “Representative Concentration Pathways” (RCP 4.5 and RCP 8.5) scenarios were corrected using the delta method. These corrected outputs were used at the SWAT model input to project the impact of climate change on the flow of the Aghien lagoon to horizons 2040 (2035-2056), 2060 (2057-2078) and 2080 (2079-2100). The projections made on these different horizons were com-pared with the simulated flow over the period 1960-1981. The results show a sensible decrease in the annual flow of the Aghien lagoon compared to the reference period (1960-1981). Under the medium assumption (RCP 4.5), the models predict a decrease in the annual discharge almost 10% on average. Under the pessimistic hypothesis (RCP 8.5), the average annual discharge should decrease by more than 17%. On a monthly basis, flows in August and September would increase by more than 80% and those in October and No-vember would increase by more than 20% in both RCP scenarios.
How to cite this paper: N’Dri, W. K. C., Pistre, S., Jourda, J. P., & Kouamé, K. J. (2019). Estimation of the Impact of Climate Change on Water Resources Using a De-terministic Distributed Hydrological Model in Côte d’Ivoire: Case of the Aghien La-goon. Journal of Geoscience and Environ-ment Protection, 7, 74-91.
https://doi.org/10.4236/gep.2019.77007
Received: December 1, 2018 Accepted: July 23, 2019 Published: July 26, 2019
Copyright © 2019 by author(s) and Scientific Research Publishing Inc. This work is licensed under the Creative Commons Attribution International License (CC BY 4.0).
http://creativecommons.org/licenses/by/4.0/
DOI: 10.4236/gep.2019.77007 75 Journal of Geoscience and Environment Protection
Keywords
Abidjan, Climate Change, Côte d’Ivoire, Aghien Lagoon, SWAT
1. Introduction
Management and water supply remain a major challenge for the Ivorian gov-ernment. At present, the water needs of the Ivorian populations have increased, in particular those of the autonomous district of Abidjan. A deficit of 58 million m3/year must be mobilized to meet the water needs of this population (Ehouman
et al., 2017). With a view to filling the water deficit in the economic capital Ab-idjan, it was decided to operate the Aghien lagoon located north of this city. However, this resource could be impacted by climate change that influences the water balance by altering evapotranspiration rate, temperature, and precipitation
(Abdelkrim, 2013). Change of these hydrological variables will have a negative impact on the availability of water resources in West Africa (Kouakou et al., 2012; Servat et al., 1998) as well as in the rest of the world. Water resources of Côte d’Ivoire, a country in West Africa, will not escape the consequences of this phenomenon caused by the increase of greenhouse gases in the atmosphere. In-deed, studies have shown that the flow rates of some main rivers, in particular, the flows of the Bandama and Sassandra rivers will decrease during the 21st century (Goula et al., 2006; Soro et al., 2017). What would be the case for the Aghien lagoon? For a better understanding of the effects of climate change on the future quantitative availability of this lagoon, the Soil and Water Assessment Tools (SWAT) hydrological model was applied to its basin to simulate the flow over the periods 1960-1981, 2035-2056 (horizon 2040), 2057-2078 (horizon 2060) and 2079-2100 (horizon 2080). The robustness of the SWAT model to the flow in Ivorian context has been demonstrated simulate on the basin of Buyo
(Koua, 2014) and of Taabo (Anoh, 2014).
2. Study Area
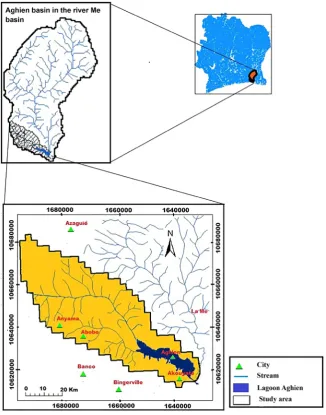
The Aghien basin is located in the southeastern part in Côte d’Ivoire, in the north of economical capital Abidjan. It is a subwatershed of the Me River basin. The basin area of this river is 4140 km2 (Figure 1). The Aghien basin has a
sur-face area of approximately 365 km2 and lies between 3˚49'W and 3˚58'W
DOI: 10.4236/gep.2019.77007 76 Journal of Geoscience and Environment Protection
Figure 1. Location of the study area with Aghien watershed and Me.
the lagoon environment. It acts as a buffer zone by preventing nutrients and sedi-ments from being discharged into the Aghien lagoon and ensures wildlife habitat.
3. Materials and Methods
3.1. Materials
3.1.1. Digital Elevation Model (DEM) Data
The digital elevation model (DEM) was downloaded from the shuttle radar to-pography mission (STRM) website
(http://srtm.csi.cgiar.org/SELECTION/inputCoord.asp). It allowed to delineate the watershed, the sub-basins and to calculate slopes and to extract stream network.
3.1.2. Land Use Data
DOI: 10.4236/gep.2019.77007 77 Journal of Geoscience and Environment Protection
Figure 2. Aghien lagoon basin land cover map and surroundings.
Extraction of the study area and resampling),
https://www.youtube.com/watch?v=yk9kH7tU_BQ (use for the classification)) software was used. It dates from January 2017.
3.1.3. Soil Map and Soil Type Data
The soil map used in this article is that of FAO (Food and Agriculture Organiza-tion of the United NaOrganiza-tions), established in 1995 at the scale 1/5,000,000 for all Africa. It takes into account 5000 soil types and includes the physicochemical properties of soils made by Reynolds et al. (1999)for all Africa. These are essential for the implementation of the SWAT model. The soil data to be integrated into SWAT are: the texture, the available water content, the hydraulic conductivity, the apparent density, the organic carbon content of the different soil layers. SWAT soil data from the study area were automatically extracted from FAO soil data. To do this, we have established a correspondence between the soil types (moderately and strongly desatured Ferralitic soil and hydromorphic soil) of the Aghien lagoon ba-sin and that of the ArcSwat database in which the values of the physicochemical parameters of the soils used by SWAT are recorded. This correspondence allowed to obtain three types of SWAT soils for the Aghien lagoon basin (Figure 3) which are representative of the types and characteristics of the soil of the zone.
3.1.4. Weather Data
Meteorological data are extracted from the SIEREM database
DOI: 10.4236/gep.2019.77007 78 Journal of Geoscience and Environment Protection
Figure 3. SWAT soils class map of the Aghien lagoon watershed.
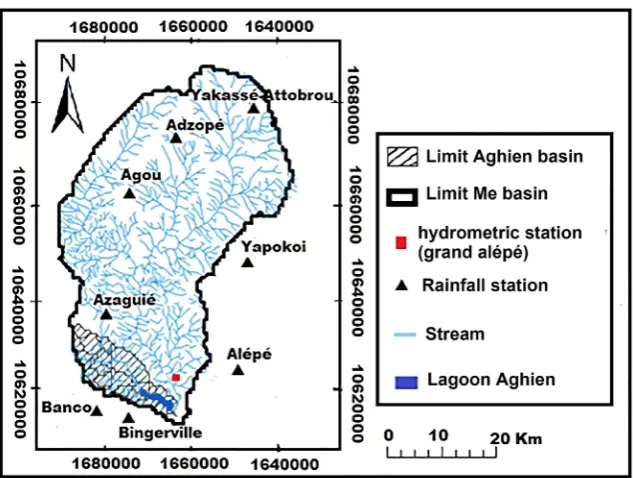
Figure 4. Location of the hydrometric station and rainfall stations.
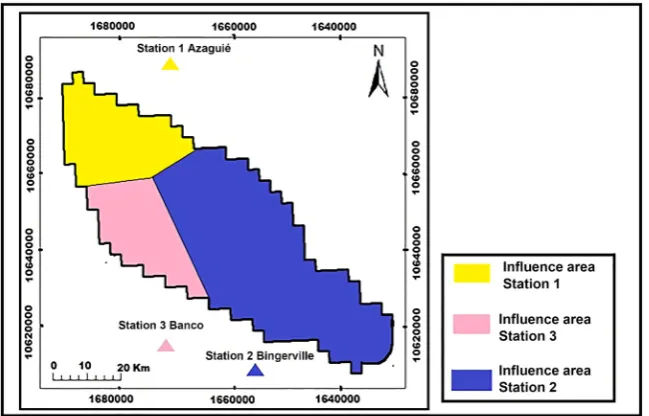
Figure 5 shows the area of influence of each station. The different zones of in-fluence were determined by polygon cutting of the Aghien lagoon watershed us-ing Thiessen’s improved polygonation method (Atchade, 2004). This method is developed under “extension analyse tools, Proximity, create Thiessen polygons of arc-gis 10.2” (http://www.esri.com).
3.1.5. Discharge Data
[image:5.595.215.532.306.545.2]DOI: 10.4236/gep.2019.77007 79 Journal of Geoscience and Environment Protection
Figure 5. Influence area of rainfall.
recorded at the gauging station of Grand Alépé (Figure 4). The availability of discharge data is shown in Table 1.
3.1.6. Future Climate Data
Ten global climate models (GCM) of the CORDEX-AFRICA project under two CMIP5 scenarios (RCP4.5 and RCP 8.5) were considered in this study. These models are presented in Table 2. The variables available in daily under the RCP4.5 and RCP8.5 scenarios are: precipitation, maximum and minimum tem-peratures, potential evapotranspiration. The outputs of these models cover the period from 1951 to 2100. This period is divided in two: 1951-2005 for historical data and 2006-2100 for future data. RCP 4.5 is a scenario that simulates an in-crease in the radiative forcing to reach a maximum around 2100 before stabiliz-ing. Under this scenario, greenhouse gas (GES) emissions will peak around 2040, then decline and stabilize around 2080. RCP 4.5 is close to the SRES B1 marker scenario (Van Vuuren et al., 2011). Contrariwise the RCP 8.5 simulates a con-stant increase in radiative forcing to reach 8.5 W/m2 in 2100 without reaching a
maximum. It is close to the SRES A2 marker scenario (Riahi et al., 2011). RCP 8.5 is the most pessimistic.
3.2. Methods
3.2.1. Evaluation of the Performance of Climate Models
The assessment of the performance of the models to reproduce the two most in-fluential parameters of the hydrological cycle (observed temperature and rain-fall), was carried out using the bias method (Sabrina, 2015). This method con-sists to estimating the difference in between simulated (Xsim) and observed (Xobs)
DOI: 10.4236/gep.2019.77007 80 Journal of Geoscience and Environment Protection
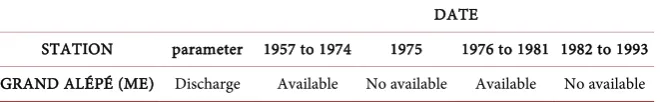
Table 1. Availability of discharge measurements (1957-1993).
DATE
STATION parameter 1957 to 1974 1975 1976 to 1981 1982 to 1993 GRAND ALÉPÉ (ME) Discharge Available No available Available No available
No available: little or no data.
Table 2. List of ten (10) Global Climate Models (GCMs).
MCG Institution (Regional Climate Models) RCM Reference
CNRM-ARPEGE CNRM. France RCA4 (CNRM-CM5) (Déqué, 2010)
MPI-ESM-LR Max-Planck institut fürmeteorologie. Allemagne RCA4 (MPI-ESM-LR) (Jacob et al., 2007) IPSL-CM5 Institut Pierre-Simon Laplace. France RCA4 (IPSL-CM5) (Dufresne et al., 2013)
CANESM2 Canadien Centre for Climate Modelling and analysis. Victoria. BC. Canada RCA4 (CanESM2) (Scinocca et al., 2008)
CSIRO-Mk3.6.0 Organisation de recherche scientifique et industrielle du Commonwealth australien RCA4 (Csiro-MK 3.6.0)
(Baker & Huang, 2013)
EC-EARTH Consortium européen (multiple) RCA4 (EC-EARTH)
HadGEM2-ES UKMO Hadley Centre (Royaume-Uni) RCA4 (HadGEM2-ES)
MIROC-ESM Japan Agency of Science and Earth Technology. Institute of Atmosphere and Ocean Research (University of Tokyo). Japan RCA4 (MIROC-ESM) (Miao et al., 2014)
NorESM1-M Climat center of Norwegian. Norvège RCA4 (NorESM1-M)
(Baker & Huang, 2013) NOAA-GFDL Laboratory of Geophysical Fluid Dynamics (GFDL; États-Unis) RCA4 (NOAA-GFDL)
If the value of the bias is negative then the model underestimates the observed data and if it is positive it overstates the observed data. The interest in evaluating the performance of climate models is to identify the model that best reproduces the interannual variability of cumul rainfall and temperatures of the Aghien la-goon watershed.
sim obs
obs
X X
Bias X
−
= (1)
1) Analysis of simulated interannual and seasonal temperatures
[image:7.595.63.537.191.417.2]DOI: 10.4236/gep.2019.77007 81 Journal of Geoscience and Environment Protection
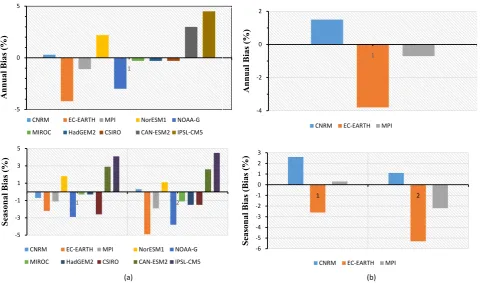
Figure 6. Estimation of the bias between observed baseline (1960-1981) and simulated GCM temperatures (a) Bingerville station; (b) Azaguié station.
model was based on the model that overestimates the least and another that un-derestimates the least.
2) Analysis of simulated interannual and seasonal rainfall
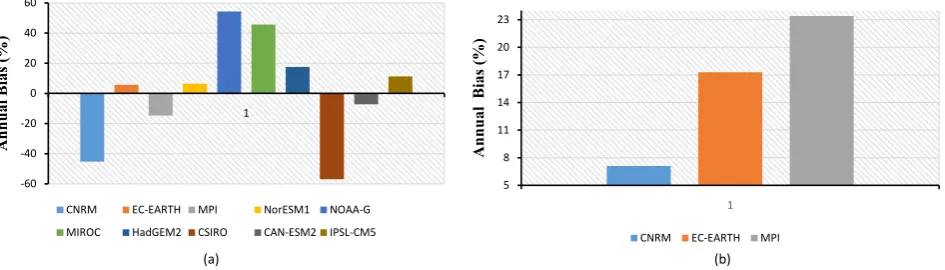
As a first step, a comparison between simulated and observed annual cumul rainfall was performed. The annual rainfall is overestimated by most GCMs ex-cept the CNRM, MPI, CSIRO, IPSL-CM5 models of the Bingerville Station (Figure 7(a)). At the Azaguié station, the CNRM, Ec-EARTH and MPI models also overestimate the annual rainfall (Figure 7(b)). The models that best repro-duce the annual rainfall are: Ec-EARTH, NorESM1, CanESM2 at Bingerville sta-tion and CNRM at Azaguié stasta-tion.
The seasonal cycle simulated by the GCMs clearly shows that they tend to underestimate precipitation during the wet period (May to July and October to November) and overestimate rainfall during the dry period (December to April and August to September). The total wet period rainfall simulated by the differ-ent models show that the IPSL-CM5, HadGEM2, MIROC models for the Bin-gerville station (Figure 8(a)) and CNRM, MPI, Ec-EARTH for the Azaguié sta-tion (Figure 8(b)) overall reproduce a structure in phase with the observations. Contrariwise the CNRM, MPI, CSIRO, Ec-EARTH, NorESM1, CanESM2, NOAA-G models (Bingerville station) deviate strongly from the observations. In dry periods models strongly overestimate total rainfall with the exception of CNRM, CSIRO models from Bingerville station. This large difference between simulated wet season rainfall and simulated dry season rainfall influences the
-5 0 5 1 A nnua l B ia s ( % )
CNRM EC-EARTH MPI NorESM1 NOAA-G MIROC HadGEM2 CSIRO CAN-ESM2 IPSL-CM5
-4 -2 0 2 1 A nnua l B ia s ( % )
CNRM EC-EARTH MPI
-5 -3 -1 1 3 5 1 2 Se as on al B ias (% )
CNRM EC-EARTH MPI NorESM1 NOAA-G MIROC HadGEM2 CSIRO CAN-ESM2 IPSL-CM5
-6 -5 -4 -3 -2 -1 0 1 2 3 1 2 Se as on al B ias (B ias (% )
DOI: 10.4236/gep.2019.77007 82 Journal of Geoscience and Environment Protection
[image:9.595.63.539.256.394.2]Figure 7. Estimation of the bias between observed baseline (1960-1981) and simulated GCM rainfall; (a) Bingerville station; (b) Azaguié station.
Figure 8. Estimation of the bias (%) between seasonal total rainfalls observed and simulated over the period 1960-1981; (a) Bin-gerville station; (b) Azaguié station.
variability of annual rainfall cumul, as well as the choice of model. The total rainfall of the Aghien lagoon basin being better reproduced by the climate mod-els during the wet period than during the dry period. It is therefore suitable to facilitate the choice of the most efficient model, to compare the observed and simulated data of the wet period only.
The results of the comparison of the biases of the different global climatic models of the CORDEX-AFRIQUE project have shown that a single climate model cannot perform well to reproduce the variability of precipitation for the two stations. There is at least one model capable of reproducing the temporal variability of precipitation for each station and for each time scale.
Since the SWAT hydrological model simulation is carried out at the monthly time step in this study, the global climate models selected are the ones that best simulate the observations at the seasonal scale. Thus, the performing models se-lected following the analysis of the observed and simulated data are recorded in
Table 3 below.
Affected of bias more or less importantly, the raw outputs of these models must be accompanied by bias correction methods (Paturel, 2014). Thus, the del-ta method (Ducharne et al., 2003)was required in this study to correct the bias of the selected climate models. This approach corrects two types of distributions:
-60 -40 -20 0 20 40 60 1 A nnua l B ia s ( % )
CNRM EC-EARTH MPI NorESM1 NOAA-G MIROC HadGEM2 CSIRO CAN-ESM2 IPSL-CM5
5 8 11 14 17 20 23 1 A nnua l B ia s ( % )
CNRM EC-EARTH MPI (a) (b)
(a) (b) -80 -50 -20 10 40 70 100 1 2 Se as on al B ias (% )
CNRM EC-EARTH MPI NorESM1 NOAA-G MIROC HadGEM2 CSIRO CAN-ESM2 IPSL-CM5
-5 7 19 31 43 55 1 2 Se as on al B ias (% )
DOI: 10.4236/gep.2019.77007 83 Journal of Geoscience and Environment Protection
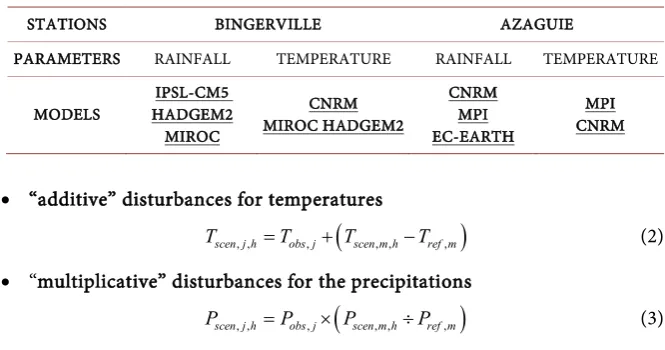
Table 3. Lists of selected models.
STATIONS BINGERVILLE AZAGUIE
PARAMETERS RAINFALL TEMPERATURE RAINFALL TEMPERATURE
MODELS HADGEM2 IPSL-CM5 MIROC
CNRM MIROC HADGEM2
CNRM MPI EC-EARTH
MPI CNRM
• “additive” disturbances for temperatures
(
)
, , , , , ,
scen j h obs j scen m h ref m
T =T + T −T (2)
• “multiplicative” disturbances for the precipitations
(
)
, , , , , ,
scen j h obs j scen m h ref m
P =P × P ÷P (3)
Tobs,jand Pobs,jare the daily observed temperature and precipitation; Tscen,m,h and
Pscen,m,h are the mean monthly temperatures and precipitation simulated by the
models over the period of the scenario considered; Tref,m, Pref,m are the mean
monthly temperatures and precipitation over the reference period. Tscen,j,h and
Pscen,j,hare the daily temperature and precipitation of the considered time period.
3.2.2. Hydrological Model: SWAT
1) SWAT model description
SWAT “Soil and Water Assessment Tool” is a semi-distributed physical-ly-based model, developed to predict the impact of management practices on water and agricultural chemical yields on a basin scale (Arnold et al., 1998). It has developed by researchers at the USDA (United States Department of Agri-culture)—Agricultural Research Service (Ogden et al., 2001; Neitsch et al., 2005). SWAT takes into account all the hydrologic cycle, represented in the watershed, so spatialized. The time step used for analysis is the day. SWAT can analyze the impacts of climate, soil, vegetation and agricultural activities on water flow. The basic space unit at SWAT calculations is the Hydrological Response Unit (HRU). It is the result of the combination of a soil type, a land use class and a subwa-tershed. It is coupled with a GIS (geographic information system) such as Arc-View GIS 3.2 or Arcgis 9.x. or Arcgis 10.x from ESRI. This has a double interest. Indeed, the use of a GIS makes it possible both to facilitate the pretreatment of the data to be integrated into the model and also to visualize the results of the simulation. Its implementation requires several input data: digital elevation model (DEM), soil data, weather data, land use data, agricultural practice etc. SWAT, subdivides hydrological modeling of the watershed into two phases
(Neitsch et al., 2005): the land phase and routing phase. The land phase is based on soil water balance equation for each day of simulation (4):
(
)
0 1
t
t day surf a seep gw i
i
SW SW R Q E W Q
=
= +
∑
− − − − (4)where: SWt is the final soil water content (mm); SW0 is the initial soil water
DOI: 10.4236/gep.2019.77007 84 Journal of Geoscience and Environment Protection
(mm); Qsurf is the amount of surface runoff on day i (mm), Ea is the amount of
evaporation on day i (mm); Wseep is the amount of water entering the vadose
zone from the soil profile on day i (mm); Qgw is the amount of return flow on
day i (mm).
2) Calibration and validation of SWAT model
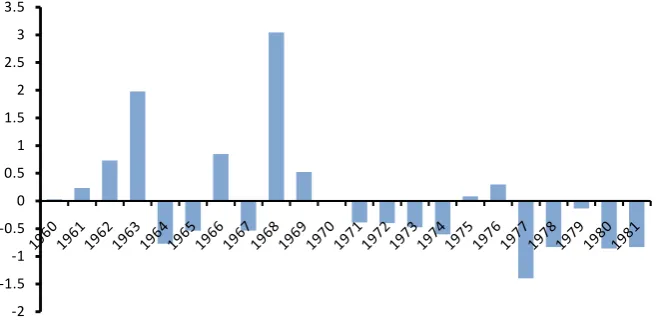
The Aghien lagoon basin is an ungauged basin. However, as shown in Figure 1, the Aghien lagoon basin is a sub-basin of the Me basin. They therefore belong to the same geographical area. This geographical proximity is a sufficient indi-cator of the hydrogeological, climatic and pedological similarity of these two ba-sins. On the basis of this similarity hypothesis, we used the flux data at the daily time step of the Grand Alépé hydrological station on the Mé to calibrate the SWAT model on this watershed. The calibration procedure requires three main steps. It is first necessary to identify the sensitive parameters (parameters that can influence the performance of the model), then adjust the parameters and fi-nally validate the model over a different period of the calibration phase. Thus, the period 1960-1969 (wet period) was chose for calibration of the model and validation was carried out on the dry period (1970-1981). Figure 9 illustrates the periods used for calibration and validation. The Nash-Sutcliffe criteria (NSE) and determination coefficient (R2) used to evaluate the performance of the SWAT model are satisfactory because they are greater than the guide value (0.5) (Santhi et al., 2001). NSE = 0.807 and R2 = 0.809 in calibration (1960 to 1969) and NSE = 0.59 and R2 = 0.64 in validation (1970 to 1981) (N’Dri et al., 2019). The SWAT model has therefore, in view of the values of these coefficients, demonstrated its robustness to reproduce the flow on the basin of the Me river. Thus, the adjusted parameters of the model for the Mé basin have been reintegrated into the model to simulate the flow over the lagoon of Aghien (ungauged) over the period 1960-1981 (baseline period).
3.2.3. Climate Change Simulations
[image:11.595.210.539.535.695.2]Rainfall and temperature data of the six climate models selected for the RCP 4.5
Figure 9. Reduced centered index on precipitation and calibration-validation period re-tained.
DOI: 10.4236/gep.2019.77007 85 Journal of Geoscience and Environment Protection
and RCP 8.5 scenarios allowed simulations of the discharge of the Aghien la-goon. Future simulations of the Aghien lagoon discharge 2040 (2035-2056), 2060 (2057-2078) and 2080 (2079-2100) horizons were compared to the simulations of the baseline period 1960-1981. The comparison between the future simula-tions and the simulasimula-tions over the baseline period is made possible because the reproduction of the processes on this period (1960-1981) was validated before-hand, during the calibration/validation phase of the SWAT model. This com-parison allowed to analyze the impacts of climate change on the future (quantit-ative) availability of the Aghien lagoon.
4. Results and Discussion
4.1. Potential Impacts of Climate Change on Precipitation and
Potential Evapotranspiration of Aghien Lagoon Basin
4.1.1. Change in Potential Evapotranspiration (PET)
PET shows an overall increasing trend in the 21st century under the RCP 4.5 and RCP 8.5 scenarios. Indeed, trends are becoming more pronounced under both scenarios, towards the end of the 21st century (Table 4), but also a slight statio-narity of the PET is observed under the RCP 8.5 scenario between the 2060 and 2080 horizons.
4.1.2. Change in Rainfall
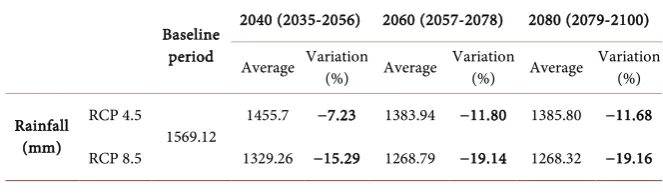
[image:12.595.209.539.510.587.2]The evolution of precipitation at different horizons is shown in Figure 10. The rates of decrease in rainfall are relatively more in RCP 8.5 than RCP 4.5 over the basin. Under RCP 4.5, the rainfall may decrease from 9.06% on average and un-der RCP 8.5 rainfall may decrease from 16.96% on average in future periods. The calculated rates of change are shown in Table 5 below. The decrease in precipi-tation is more pronounced towards the end of the century under the two scenarios:
Table 4. Percentage change in the annual evapotranspiration potential for the different horizons compared the baseline period (1960-1981).
Baseline period
2040 (2035-2056) 2060 (2057-2078) 2080 (2079-2100)
Average Variation (%) Average Variation (%) Average Variation (%)
PET (mm)
RCP 4.5
1230.65 1330.28 +8.09 1342.23 +9.06 1369.47 +11.28 RCP 8.5 1358.81 +10.42 1367.95 +11.15 1366.16 +11.05
Table 5. Percentage change in the annual rainfall for the different horizons compared the baseline period (1960-1981).
Baseline period
2040 (2035-2056) 2060 (2057-2078) 2080 (2079-2100)
Average Variation (%) Average Variation (%) Average Variation (%)
Rainfall (mm)
RCP 4.5
[image:12.595.207.539.634.732.2]DOI: 10.4236/gep.2019.77007 86 Journal of Geoscience and Environment Protection
Figure 10. Evolution of annual rainfall compared to the baseline period (1960-1981).
11.80% (horizon 2060), 11.68% (horizon 2080) under the RCP 4.5 scenario and 19.14% (horizon 2060), 19 16% (horizon 2080) under the RCP 8.5 scenario. This rainfall deficit has already been observed in West Africa under the scenarios RCP 4.5 and RCP 8.5 on the watersheds of Senegal and Bandama respectively by (Mbaye et al., 2015) and (Soro et al., 2017). Also, the work of (Koua, 2014) revealed a de-crease of precipitation of 10.27% by 2050 and 14.90% by 2080 on the watershed of the Buyo dam (Côte d’Ivoire) using the SWAT model and the UKMO-HadGEM1 model according to A1B scenario. Given the evolution of these variables (PET and Rainfall), we can expect that the flow of the Aghien lagoon will be impacted by both the decrease in precipitation and the increase in potential evapotranspi-ration.
4.2. Potential Impacts of Climate Change on Aghien Lagoon
Discharge: Annual and Seasonal Discharge Evolution
RCP Scenarios 4.5 and 8.5 project a reduction in the annual flow of the lagoon until 2080 (Figure 11). Under the RCP 4.5 scenario the average annual flow would decrease by −8.33%, −10.02%, and −9.72% respectively over the different horizons (2040, 2060, and 2080). RCP 8.5 scenario forecasts a decrease average flow rate over the different horizon: −16.36% by 2040, −19.15% by 2060 and −19.22% by 2080.
Figure 12(a) and Figure 12(b) show the seasonal evolution of the lagoon discharge over the different horizons for the RCP 4.5 and RCP 8.5 scenarios compared to the observed flow over the reference period (1960-1981). We note that under both scenarios, the hydrological regime could be disrupted with re-spect to seasonal flow patterns and the date of occurrence of flood peaks. Indeed, the flood peaks will now appear in August and September instead of June and July over the past period (1960-1981). This situation means that the seasons could move in the 21st century. The RCP 4.5 scenario projects a decrease in the lagoon flow during the long dry season (December to April) of 42% and a de-crease during the long rainy season (May to July) of 57%. As for the RCP 8.5 scenario, it predicts a decrease in flow of 44% in the dry season (December to April). It also projects a decrease in the flow of the lagoon of 64% in rainy season
1200 1250 1300 1350 1400 1450 1500 1550 1600
Baseline Period Horizon 2040 Horizon 2060 Horizon 2080
R
ain
fa
ll (
m
m
/a
n)
DOI: 10.4236/gep.2019.77007 87 Journal of Geoscience and Environment Protection
Figure 11. Evolution of the annual discharge of the Aghien lagoon under the RCP 4.5 and RCP 8.5 scenario compared to the baseline period (1960-1981).
Figure 12. (a) Seasonal evolution of the discharge (compared to the reference period 1960-1981) of the Aghien lagoon under sce-narios RCP 4.5; (b) Seasonal evolution of the discharge (compared to the reference period 1960-1981) of the Aghien lagoon under scenarios RCP 8.5.
(May to July). Both scenarios predict a greater increase in flow (more than 80%) in August and September during the short dry season and a slight increase in flow (more than 20%) in October and November during the short rainy season.
The discharge of the Aghien lagoon would decrease by an average of 9.42% under the RCP 4.5 scenario and would also decrease by an average of 18.24% under the RCP 8.5 scenario. These results are in agreement with those of (Ar-doin-Bardin, 2004) in the watersheds of Senegal, Gambia and Sassandra (Biao, 2017) in the Ouémé river basin in Benin (West Africa) (Koua, 2014)in the wa-tershed of the Buyo dam or (Kouakou et al., 2012) in the Comoé river watershed. These authors describe a decrease in stream flows in these different basins, up to about 20% under the influence of climate change.
5. Conclusion
This study evaluates the impact of climate change on the flow of the Aghien la-goon. Six climate models (CNRM, MIROC, HadGEM2, IPSLCM5, MPI and Ec-EARTH) of the CORDEX-AFRICA project under the scenarios RCP 4.5 and RCP 8.5 were used for the assessment of the impact of climate change. The SWAT hydrological model is used to simulate the hydrological processes in the
-8.33 -10.02 -9.72 -16.36 -19.15 -19.22 -30 -24 -18 -12 -6 di sch arg e ( % )
RCP 4.5 RCP8.5
0 40 80 120 160 di sch arg e ( m 3/s) Month 1960-1981 2035-2056 2057-2078 2079-2100 0 40 80 120 160 di sch arg e ( m 3/s) Month 1960-1981 2035-2056 2057-2078 2079-2100
[image:14.595.61.539.276.395.2]DOI: 10.4236/gep.2019.77007 88 Journal of Geoscience and Environment Protection
Aghien lagoon watershed. Calibration and validation results for the Me basin showed a good performance of the SWAT model in the simulation of hydrolog-ical processes. Considering the geographhydrolog-ical proximity and the hydrogeologhydrolog-ical, climatic and pedological similarities of the Aghien lagoon basin and the Mé wa-tershed, the SWAT model was therefore applied with confidence on the Aghien lagoon basin to simulate the future evolutions of the PET, the precipitation and the flow of the Aghien lagoon in a context of climate change. The results indicate an increase in future PET of the order of 7% to 12% while precipitation is ex-pected to decrease on average by more than 16% under RCP 8.5% and 10% un-der RCP 4.5. Like precipitation, the annual flow of the Aghien lagoon would de-crease under the two RCP scenarios. The annual discharge should dede-crease by an average of 10% under RCP 4.5 and more than 17% under RCP 8.5. The scenarios also project a decrease in the seasonal flow of the lagoon. Under the RCP 4.5 scenario, a 42% decrease in discharge during the dry period (December to April) and 57% during the wet period (July to May) is projected. Under the RCP 8.5 scenario, a 44% decrease in flow in the dry period and 64% in the wet season is expected. However, the flow should increase by more than 80% in August and September (dry period) and by more than 20% in October and November (wet period) over the 2040, 2060 and 2080 horizons. It should be kept in mind that this is modeling that implements a hydrological model and the average of six climate models that involve uncertainties. Given these uncertainties, the results of this study are not forecasts, but projections of two possible future situations and equiprobable to the 2040, 2060 and 2080 horizons. Thus, taking into ac-count the potential impact of climate change on the future evolution of the Ag-hien lagoon will reinforce the planning and management policy of this water re-source, which will have to be adjusted according to observed or foreseeable uses.
Acknowledgements
This reflection received financial support from the ERASMUS MUNDUS pro-gram through the KITE (Knowledge Integration and Transparency in Educa-tion) mobility project. All our gratitude to the authorities of this program. We would like to express our gratitude to Professor Séverin Pistre, professor of hy-drogeology at the University of Montpellier, my academic supervisor of KITE program for his constructive suggestions and as well its collaborators who gave me the datasets that made this study possible. Finally, we would like to pay a fi-nal tribute to the professors Jourda Jean Patrice and KouaméKan of the Félix Houphouët Boigny University who agreed respectively to be Director and co-director of my thesis project.
Conflicts of Interest
The authors declare no conflicts of interest regarding the publication of this paper.
References
DOI: 10.4236/gep.2019.77007 89 Journal of Geoscience and Environment Protection
les Oasis de la Région de Tafilalet-Maroc. Ph.D. Thesis, Marrakecsh, Maroc: Université Cadi Ayyad.
Anoh, K. A. (2014). Apport d’un SIG et du modèle agrohydrologique SWAT dans la ges-tion durable des ressources en eaux du bassin versant du lac de Taabo (centre de la Côte d’Ivoire). Thèse de Doctorat en Sciences de la Terre, option Hydrogéologie, Ab-idjan, Côte d'Ivoire: Université Félix Houphouët Boigny de Cocody Abidjan.
Ardoin-Bardin, S. (2004). Variabilité hydroclimatique et impacts sur les ressources en eau de grands bassins hydrographiques en zone soudano-sahélienne. Thèse de Doctorat, Montpellier: l’Université de Montpellier II.
Arnold, J. G., Srinivasan, R., & Williams, J. R. (1998). Large Area Hydrologic Modeling Assessment: Part 1 Model Development. Journal of the Américan Water Resources Association, 34, 73-89.https://doi.org/10.1111/j.1752-1688.1998.tb05961.x
Atchade (2004). Impacts de la dynamique du climat et de l’occupation des terres sur les ressources en eau du bassin versant de la rivière zou dans le Benin méridional. Thèse de Doctorat unique, Benin: Géoscience de l’Environnement et Aménagement de l’Espace, Université d’Abomey-Calavi.
Baker, N. C., & Huang, H. P. (2013). A Comparative Study of Precipitation and Evapora-tion between CMIP3 and CMIP5 Climate Model Ensembles in Semiarid Regions. Journal of Climate, 27, 3731-3749.https://doi.org/10.1175/JCLI-D-13-00398.1
Biao, E. I. (2017). Assessing the Impacts of Climate Change on River Discharge Dynamics in Oueme River Basin (Benin, West Africa). Hydrology, 4, 47.
https://doi.org/10.3390/hydrology4040047
Déqué, M. (2010). Regional Climate Simulation with a Mosaic of RCMs. Meteorologische Zeitschrift, 19, 259-266.https://doi.org/10.1127/0941-2948/2010/0455
Ducharne, A., Théry, S., Viennot, P., Ledoux, E., Gomez, E., & Déqué, M. (2003). Influence du changement climatique sur l’hydrologie du bassin de la Seine. VertigO, 4, 40.
https://doi.org/10.4000/vertigo.3845
Dufresne, J. L., Foujols, M. A., Denvil, S., Caubel, A., Marti, O., Aumont, O., Balkanski, Y., & Bekki, S. (2013). Climate Change Projections Using the IPSL-CM5 Earth System Model: From CMIP3 to CMIP5.Climate Dynamics, 40, 2123-2165.
https://doi.org/10.1007/s00382-012-1636-1
Ehouman, S. K., Amidou, D., Djibril, D., Noufé, B., Kamagate, B., Koffi, J., Thierry, K., Seydou, D., & Droh, L. G. (2017). Bilan des apports liquides des rivières Bété et Djibi à la lagune aghien (Côte d’Ivoire). American Journal of Innovative Research and Applied Sciences, 6, 86-99.
Goula, B. T. A., Savané, I., Konan, B., Fadika, V., & Kouadio, G. B. (2006). Impact de la variabilité climatique sur les ressources hydriques des bassins de N’Zo et N’Zi en Côte d’Ivoire (Afrique tropicale humide). VertigO, la revue électronique en sciences de l’environnement, 7, 1-12.https://doi.org/10.4000/vertigo.2038
Jacob, D., Bärring, L., Christensen, O. B., Christensen, J. H., Hagemann, S., Hirschi, M., Kjellström, E., Lenderink, G., Rockel, B., Schär, C., Seneviratne, S. I., Somot, S., van Ulden, A., & van den Hurk, B. (2007). An Inter-Comparison of Regional Climate Mod-els for Europe: Design of the Experiments and Model Performance. Climate Change, 81, 31-52.https://doi.org/10.1007/s10584-006-9213-4
DOI: 10.4236/gep.2019.77007 90 Journal of Geoscience and Environment Protection
Kouakou, K. E., Goula, B. T. A., & Kouassi, A. M. (2012). Analyze of Climate Variability and Change Impacts on Hydro-Climate Parameters: Case Study of Côte d’Ivoire. In-ternational Journal of Scientific and Engineering Research, 3, 1-8.
Mbaye, M. L., Hagemann, S., Haensler, A., Stacke, T., Gaye, A. T., & Afouda, A. (2015). Assessment of Climate Change Impact on Water Resources in the Upper Senegal Basin (West Africa). American Journal of Climate Change, 4, 77-93.
https://doi.org/10.4236/ajcc.2015.41008
Miao, C. Y., Duan, Q. Y., Sun, Q. H., Huang, Y., Kong, D. X., Yang, T. T., Ye, A. Z., Di, Z. H., & Gong, W. (2014). Assessment of CMIP5 Climate Models and Projected Temper-ature Changes over Northern Eurasia (pp. 1-13). State Key Laboratory of Earth Surface Processes and Resource Ecology, College of Global Change and Earth System Science, Beijing Normal University, Beijing.
N’Dri, W. K. C., Séverin, P., Jourda, J. P., & Kouamé, K. J. (2019). Application of SWAT to Estimate Water Balance in the Aghien Lagoon Basin, South-East of Côte d’Ivoire. International Journal of Science and Research, 8, 10.
Neitsch, S. L., Arnold, J. G., Kiniry, J. R., & Williams, J. R. (2005). Soil and Water As-sessment Tool Theoretical Documentation, Version 2005. Grassland, Soil and Water Research Laboratory: Agricultural Research Service.
Ogden, F. L., Garbrecht, J., DeBarry, P. A., & Johnson, L. E., (2001). GIS and Distributed Watershed Models. II: Modules, Interfaces, and Models. Journal of Hydrologic Engi-neering, 6, 515-523.https://doi.org/10.1061/(ASCE)1084-0699(2001)6:6(515)
Paturel, J. E. (2014). Exercice de scénarisation hydrologique en Afrique de l’Ouest: Bassin du Bani. Hydrological Sciences Journal, 59, 1135-1153.
https://doi.org/10.1080/02626667.2013.834340
Reynolds, C. A., Jackson, T. J., & Rawls, W. J. (1999). Estimating Available Water Content by Linking the FAO Soil Map of the World with Global Soil Profile Database and Pe-do-Transfer Functions. Water Resources Research, 36, 3653-3662.
https://doi.org/10.1029/2000WR900130
Riahi, K., Rao, S., Krey, V., Cho, C., Chirkov, V., Guenther, F., Georg, K., Nakicenovic, N., & Rafaj, P. (2011). RCP 8.5-A Scenario of Comparatively High Greenhouse Gas Emissions. Climatic Change, 109, 33.https://doi.org/10.1007/s10584-011-0149-y
Sabrina, T. F. (2015). Influence de la circulation atmosphérique générale sur les précipita-tions du Nord de l’Algérie. Thèse de Doctorat, Algérie: de l’École Nationale Supérieure d’Hydraulique.
Santhi, C., Arnold, J. G., Williams, J. R., Dugas, W. A., Srinivasan, R., & Hauck, L. M. (2001). Validation of the SWAT Model on a Large River Basin with Point and Non-point Sources. Journal of the American Water Resources Association, 37, 1169-1188.
https://doi.org/10.1111/j.1752-1688.2001.tb03630.x
Scinocca, J. F., McFarlane, N. A., Lazare, M. L. J., & Plummer, D. (2008). Technical Note: The CCCma Third Generation AGCM and Its Extension into the Middle Atmosphere. Atmospheric Chemistry and Physics Impact, 8, 7055-7074.
https://doi.org/10.5194/acp-8-7055-2008
Servat, E., Paturel, J. E., Kouamé, B., Travaglio, M., Ouedraogo, M., Boyer, J. F., Lubès-Niel, H., Fritsch, J. M., Masson, J. M., & Marieu, B. (1998). Identification, ca-ractérisation et conséquences d’une variabilité hydrologique en Afrique de l’Ouest et Centrale.International Association of Hydrological Sciences Journal, 252, 323-337. Soro, G. E., Yao, A. B., Kouamé, Y. M., & Goula, B. T. A. (2017). Climate Change and Its
Impacts on Water. Resources in the Bandama Basin, Côte d’Ivoire. Hydrology, 4, 18.
DOI: 10.4236/gep.2019.77007 91 Journal of Geoscience and Environment Protection
Van Vuuren, D., Edmonds, J., Kainuma, M., Riahi, K., Thomson, A., Hibbard, K., Hurtt, G., Kram, T., Krey, V., & Lamarque, J. F. (2011). The Representative Concentration Pathways: An Overview. Climatic Change, 109, 5-31.