doi:10.4236/jbpc.2011.21003
Copyright © 2011 SciRes. Openly accessible at http://www.scirp.org/journal/JBPC/
Study on the structure and composition of aortic valve
calcific deposits: Etiological aspects
Rafael. M. Prieto1,2, I. Gomila1, O. Söhnel3, A. Costa-Bauza1,2, O. Bonnin4, Felix Grases1,2
1
Laboratory of Renal Lithiasis Research, University Institute of Health Sciences Research (IUNICS), University of Balearic Islands, Palma of Mallorca, Spain; [email protected]
2
CIBER Fisiopatología Obesidad y Nutrición (CB06/03), Instituto de Salud Carlos III, Madrid, Spain;
3
University of J.E. Purkyne, Faculty of Environmental Studies, Usti n.L., Czech Republic;
4
University Hospital Son Dureta, Palma of Mallorca, Spain;
Received 5 November 2010; revised 19 November 2010; accepted 25 November 2010.
ABSTRACT
The structures and chemical compositions of valve calcific deposits were investigated. The deposits was chosen arbitrarily and subjected to chemical analysis, observation with scanning microscope, semi-quantitative determination of Ca, Mg, Na, K, P and C elements by energy dis-persive X-ray, X-ray diffraction and Fourier transform infra-red spectroscopy carried out. These deposits were found to have non-uniform internal structures composed of layers of a structureless aspidinic inorganic material, sub-stantial amounts of voluminous organic material and in a few samples small spheres were also present. Two groups of deposits with distinctly different chemical compositions were identified: one group with a low Ca/P molar ratio (1.59) and the other group with a high (1.82) Ca/P molar ra-tio. The deposits belonging to the group with a low Ca/P molar ratio contain higher concentra-tion of magnesium and consist of increased amount of amorphous calcium phosphate. The deposits with a high Ca/P molar ratio contain low concentration of magnesium and consist pre-dominantly of carbonated hydroxyapatite. The inorganic material was identified as a poorly crystalline carbonate hydroxyapatite containing molecular w ater of the average formula Ca9.1Mg0.4(Na,K)(PO4)5.8(CO3)0.3(OH)2. The actual chemical composition of the apatitic solid phase varies not only from deposit to deposit but also within the same deposit. The non-uniform inter-nal structure of the deposits, the occasiointer-nal presence of spherical particles and the variable point composition of the individual deposits in-dicate that their formation did not proceed under more or less constant conditions.
Keywords: Mitochondrial Swelling; Cytochrome C
Release; Calcium; Alloxan; Mitochondrial Permeability Transition
1. INTRODUCTION
The formation and composition of calcific deposits in living organisms have been intensively investigated with different methods in both in vitro and in vivo studies. This phenomenon is still not very well understood de-spite all effort devoted to its unravelling. The principle obstacle hindering conclusive elucidation of calcification stems from the impossibility of observing the com-mencement of formation of solid deposits in a living organism and their subsequent development. In the ini-tial stages of a calcific deposit, moreover, formation of nanoparticles is undetectable under physiological
condi-tions with contemporary methods and thus even in vitro
studies cannot provide direct insight into the processes taking place during this crucial period of solid phase formation.
The fine structure, chemical composition and crystal-linity of the deposits arising from the calcification of human natural and bioprosthetic heart valve have been investigated by using X-ray diffraction, Fourier trans-form infrared (hereafter FTIR) and Raman spectra, chemical and energy dispersive X-ray (hereafter EDX) analysis and high-resolution transmission electron mi-croscopy [1-7]. In these studies, however, only the total compositions of the calcific deposits expressed as the molar ratio Ca/P were determined.
The variation in the composition of calcific deposits between different individuals has previously been stud-ied. However, whether and to what extent the composi-tion of the calcific deposits in the same individual can vary is not known.
calcific deposits formed in explanted natural human aor-tic valves of the same and different individuals.
2. MATERIALS AND METHODS
2.1. Sample Preparation
Calcified natural heart valves surgically removed from 10 patients were kept in 10% aqueous solution of for-maldehyde containing 7.65 g of NaCl, 0.724 g of
Na2HPO4 and 0.21 g of KH2PO4 (pH 7.2) in 1000 ml.
From the numerous calcified objects formed within the valve tissue of each patient a well developed rounded concretion of size about 2 mm was chosen arbitrarily and then removed, dried in ambient air, divided into four parts of similar size and subjected to chemical analysis, observation with scanning microscope, semi-quantitative determination of Ca, Mg, Na, K, P and C elements by EDX (energy dispersive X-ray), X-ray diffraction and FTIR (Fourier transform infra-red) spectroscopy carried out in the reflective mode.
2.2. Electron Microscopy
The samples were glued to a metallic support and ob-served using a Hitachi S 3400N scanning electron mi-croscope and a Bruker EDX analyser. The samples were not covered with gold as its spectral line interferes with that of phosphorus and distorts the results of EDX analyses. Several randomly selected sites on each sample
with areas of approximately 0.25 mm2 (hereafter referred
to as a large area) and several areas inside each large site 0.25 μm2 in size (hereafter referred to as small areas or point measurements) were subjected to EDX analysis.
2.3. Chemical Analysis
Samples of approximately 0.01 g (the smaller samples) and 0.1 g (the larger samples) from dry deposit were dissolved separately in 12 M HCl at ambient temperature for 24 h, diluted to 10 ml and filtered in order to remove undissolved particles of organic origin. The organic matter from the larger samples was dried and weighed. Each solution was then 100 times diluted with deionized water and used for the determination of calcium and
magnesium or diluted with 0.6 M H2SO4 for phosphorus
determination. Calcium forms a blue purple complex with Arzenazo III at neutral pH [8], magnesium forms a red complex with Calmagite in an alkaline solution [9] and phosphorus forms a green complex with malachite green molybdate under acidic conditions [10]. The in-tensity of solution discoloration was determined spec-trophotometrically (Microplate Spectrophotometer Pow-erWave XS, Biotek Instruments, Inc., Winoosk, VT) at wave lengths of 650, 520 and 630 nm for Ca, Mg and P
respectively.
2.4. X-Ray and Ftir Analysis
A small piece from each concretion with a weight of about 2 mg was pulverized and used for X-ray diffrac-tion and then for FTIR reflective analysis. The X-ray spectra were obtained using XRD Diffractometer (Bruker- Siemens D5000, Bruker AX GmbH Karlsruhe, Germany) and the FTIR spectra using a Bruker IFS66 infrared spectroscope (Bruker AXS GmbH Karlsruhe, Germany).
3. RESULTS
3.1. Accuracy of the EDX Analyses
The accuracy of the calcific concretions chemical composition determinations with EDX was assessed for 6
different samples. A small area of approximately 0.25 μm2
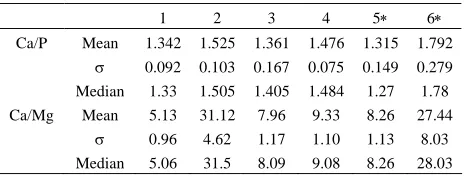
in size was arbitrarily chosen from each of four samples and analysed and a large area of about 1 mm2 was selected on each of two samples. 12 successive measurements were carried out in each case. The arithmetical mean, standard deviation and median were determined for the Ca/P and Ca/Mg molar ratios in each series of measurements. The results are shown in Table 1.
As can be seen, the magnitude of the standard devia-tions are on average about 9 and 17% of the mean values for the Ca/P and Ca/Mg molar ratios determined with EDX respectively. The close coincidence of the arithme-tic mean and median values indicates that in each series the distribution of individual measurements is nearly symmetrical.
3.2. Fine Structure of the Deposits
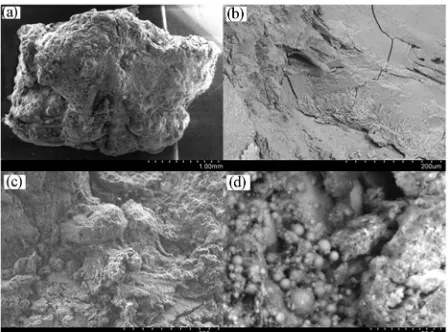
All studied calcifications of natural human aortic heart valve of approximately 2 mm in diameter were found to
have uneven compact surfaces, see Figure 1(a). The
interior of each calcification predominantly consists of blocks of structureless aspidinic matter, see Figure 1(b). Organic material including fibres was also observed. In fact, not a single site was found without organic matter, but its quantity varied significantly. The interiors of all of the studied deposits are highly inhomogeneous
with-Table 1. Accuracy of the EDX analyses.
1 2 3 4 5∗ 6∗
Ca/P Mean 1.342 1.525 1.361 1.476 1.315 1.792 σ 0.092 0.103 0.167 0.075 0.149 0.279 Median 1.33 1.505 1.405 1.484 1.27 1.78
Ca/Mg Mean 5.13 31.12 7.96 9.33 8.26 27.44
σ 0.96 4.62 1.17 1.10 1.13 8.03
Median 5.06 31.5 8.09 9.08 8.26 28.03
[image:2.595.309.541.622.710.2]Copyright © 2011 SciRes. Openly accessible at http://www.scirp.org/journal/JBPC/ Figure 1. Internal structure of the calcific deposits. (a) surface
of a deposit, (b) structureless aspidinic layer, (c)inhomoge-neous interior, (d) small spheres in the cavity.
out a sign of any morphological order, see Figure 1(c).
Small spheres situated in cavities of deposits were in-frequently observed, see Figure 1(d).
3.3. Chemical Composition of the Deposits
The chemical composition of the deposits was deter-mined using EDX and expressed as molar percentage of the constituting elements, specifically Ca, Mg, Na, K, P and C. These data were converted into molar ratios Ca/P, Ca/Mg, Ca/C and Ca/(K+Na). Potassium was always present whereas sodium was missing in 11 out of the 87 data sets. Silicon, chlorine and sulphur were not detected by EDX in any of the studied deposits.
87 sets of data were obtained from the 15 samples. In 5 cases, specifically samples 6 through 10, two different deposits were removed from the same aortic valve and analyzed separately (the second denoted by an asterisk, e.g. 6∗). 15 sets containing over 20 molar% of carbon (obviously organic matter adhering to the analyzed site surface) were excluded from further processing since a high content of carbon significantly distorts the deter-mination of other elements.
The chemical composition of 15 studied calcifications
determined by EDX analysis of areas of 0.25 mm2 and
0.25 μm2
in size are summarized in Table 2. Given
val-ues are the arithmetic means of all the data acquired for each sample.
The calculated molar ratio Ca/P given in Table 1
var-ies in rather wide limits, specifically between 1.29 and 2.55 with the overall arithmetic mean (all individual values were taken into account) of 1.69 ± 0.21. There is substantial variation of the Ca/P ratio not only between the large scanned areas of the same sample but also among point measurements within the same large area.
Magnesium was found to be present in approximately
70% of the sites; sites with and without magnesium was detected on the same deposit and even within the same large area. When present, magnesium is a minor com-ponent amounting typically to around 5% of the calcium content (from 0.7 to 10 mol%). The molar ratio Ca/Mg varies in extremely wide limits, from 16 to about 100 and exceptionally to 200, even within the same sample. The overall mean of the Ca/Mg molar ratio is 23.6 ± 11.5.
In contrast to magnesium, alkali metals were found to be always present in all of the studied aortic deposits. Sodium is absent from 15% of the measurements and sodium is always accompanied by potassium. The alkali metals are present at levels approximately 10 mol% (the overall mean is 9.1 ± 3.3) of that of the main constituent calcium.
EDX is least reliable for carbon of the measured ele-ments due to the proximity of its peak to the first peak of calcium. Carbon was detected at every investigated site, for both large and small areas. Low carbon content (with several exceptions that were excluded from further processing) indicates that it is present predominantly as inorganic carbon bound as carbonate in the apatitic phase. The Ca/C molar ratio varies in the range 5-100, with an overall mean of 33.8 ± 17.7.
The compositions of 15 calcific deposits were
deter-mined by chemical (wet) analysis and are given in Table
3. The first and second values in each column represent
are the results for the smaller and larger samples, respec-tively; wt.% is the weight percentage of an organic mat-ter in the larger sample.
3.4. Structure of the Deposits
The IR spectra of the 10 samples from different indi-viduals are basically identical, see Figure 2. The spectra contain a broad, mostly featureless, absorbance band
between 900 and 1200 cm–1 with an indistinct peak at
960 cm–1 andahigh frequency shoulder typical of poorly
crystalline hydroxyapatite [11]. The weak absorbance
bands at 871cm–1 and the very week bands at 1430 and
1455 cm–1 signify the presence of carbonate [11,12]. No
band was detected at 864 cm–1 which if present would
indicate the substitution of carbonates for the hydroxyl
groups [13]. The broad band from 3700 to 2800 cm–1
and the weak band at 1645 cm–1 can be ascribed to
structural water in the molecular form [5]. Based on the FTIR spectra all 10 studied deposits are composed of poorly crystalline carbonated hydroxyapatite.
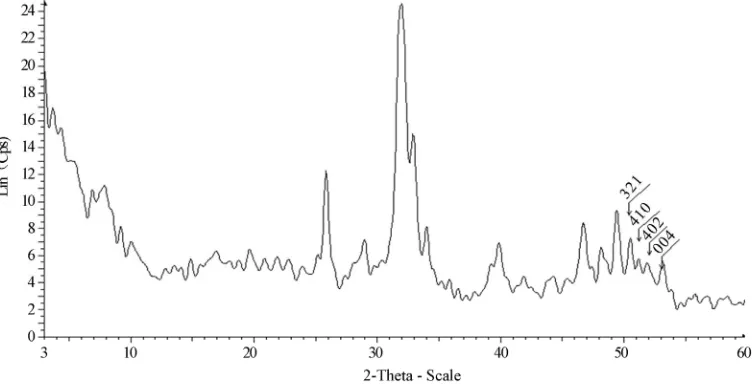
The X-ray diffraction spectra of the investigated calci-fic deposits contain all the peaks characteristic of
stoichiometric HAP, see Figure 3, and can be divided
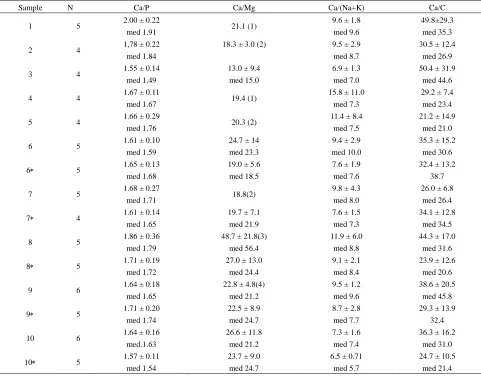
Table 2. Composition of 15 calcifications determined by EDX.
Sample N Ca/P Ca/Mg Ca/(Na+K) Ca/C
1 5 2.00 ± 0.22
med 1.91 21.1 (1)
9.6 ± 1.8 med 9.6
49.8±29.3 med 35.3
2 4 1,78 ± 0.22
med 1.84
18.3 ± 3.0 (2) 9.5 ± 2.9
med 8.7
30.5 ± 12.4 med 26.9
3 4 1.55 ± 0.14
med 1.49
13.0 ± 9.4 med 15.0
6.9 ± 1.3 med 7.0
50.4 ± 31.9 med 44.6
4 4 1.67 ± 0.11
med 1.67 19.4 (1)
15.8 ± 11.0 med 7.3
29.2 ± 7.4 med 23.4
5 4 1.66 ± 0.29
med 1.76 20.3 (2)
11.4 ± 8.4 med 7.5
21.2 ± 14.9 med 21.0
6 5 1.61 ± 0.10
med 1.59
24.7 ± 14 med 23.3
9.4 ± 2.9 med 10.0
35.3 ± 15.2 med 30.6
6∗ 5 1.65 ± 0.13
med 1.68
19.0 ± 5.6 med 18.5
7.6 ± 1.9 med 7.6
32.4 ± 13.2 38.7
7 5 1.68 ± 0.27
med 1.71 18.8(2)
9.8 ± 4.3 med 8.0
26.0 ± 6.8 med 26.4
7∗ 4 1.61 ± 0.14
med 1.65
19.7 ± 7.1 med 21.9
7.6 ± 1.5 med 7.3
34.1 ± 12.8 med 34.5
8 5 1.86 ± 0.36
med 1.79
48.7 ± 21.8(3) med 56.4
11.9 ± 6.0 med 8.8
44.3 ± 17.0 med 31.6
8∗ 5 1.71 ± 0.19
med 1.72
27.0 ± 13.0 med 24.4
9.1 ± 2.1 med 8.4
23.9 ± 12.6 med 20.6
9 6 1.64 ± 0.18
med 1.65
22.8 ± 4.8(4) med 21.2
9.5 ± 1.2 med 9.6
38.6 ± 20.5 med 45.8
9∗ 5 1.71 ± 0.20
med 1.74
22.5 ± 8.9 med 24.7
8.7 ± 2.8 med 7.7
29.3 ± 13.9 32.4
10 6 1.64 ± 0.16
med.1.63
26.6 ± 11.8 med 21.2
7.3 ± 1.6 med 7.4
36.3 ± 16.2 med 31.0
10∗ 5 1.57 ± 0.11
med 1.54
23.7 ± 9.0 med 24.7
6.5 ± 0.71 med 5.7
24.7 ± 10.5 med 21.4
med – median; N – number of measurements; number in parentheses – number of determinations if different from N; ∗ - 2nd deposit from the same individual.
[image:4.595.58.539.98.474.2]this phenomenon is not observed. Samples 2, 4, 5, 7 and 10 belong to the former group. The comparison of the phosphate with carbonate [12], and a group for which
Table 3. Composition of 15 calcifications expressed as molar
ratios determined by chemical analysis. peaks and the background intensities according to [5] indicates that a significant fraction of amorphous phos-
Sample 1 2 3 4 5
Ca/P 1.25;1.40 ∅1.32 1.79;2.11 ∅1.95 1.45;1.59 ∅1.52 1.61;1.68 ∅1.64 1.58;1.82 ∅1.70 Ca/Mg 35;18.2
∅26.6 ̶ ;11.4
26;6.7 ∅16.3 30;6.9 ∅18.4 37;6.5 ∅21.7 wt.% 15.5 13.8 18.1 11.5 17.2
Sample 6 7 8 9 10
Ca/P 1.62;1.83 ∅1.72 1.60;1.57 ∅1.58 1.52;1.82 ∅1.67 1.55;1.49 ∅1.52 1.48;1.67 ∅1.57
Ca/P ∗ 2.05 1.64 1.74 1.67 1.62
Ca/Mg 35;18.2 ∅26.6 26;10.6 ∅18.3 30;9.5 ∅19.7 28;17.5 ∅22.7 27;26.9 ∅27
Ca/Mg∗ 10.4 6.8 12.6 6.9 18.9
[image:4.595.310.535.556.706.2]wt.% 18.9 9.0 16.4 23.3 15.0
Figure 2. FTIR spectra of the calcific deposits.
Copyright © 2011 SciRes. Openly accessible at http://www.scirp.org/journal/JBPC/ Figure 3. X-ray diffraction spectrum of sample No. 5.
phate is present in all studied samples.
4. DISSCUSION
The 15 studied natural human aortic calcific deposits consist of amorphous and poorly crystalline carbonated hydroxyapatite containing molecular water in which carbonate is substituted for phosphate and not hydroxyl groups as shown unambiguously by the X-ray and FTIR spectra. All deposits also contain between 9 and 23 wt.% of organic matter.
The chemical composition of the calcifications varies widely not only among individual samples but also within the same deposit; even the composition of not too distant small areas (point composition) are dissimilar. Different deposits from the same individual do not have identical composition, but the deviations are not as pro-found as the variations among different individuals.
The composition of our deposits differs from that re-ported elsewhere [5,7] namely in the levels of potassium, magnesium and silicon. Our deposits contained non- negligible amount of potassium and none silicon in con-trast to virtually none potassium and about 3 mol% of silicon or the “substantial incorporation of Si” [4,5].
When expressed in terms of the Ca/P molar ratios of the smaller and larger samples, the chemical composi-tions of the same deposit are reasonably close. The Ca/P ratio as determined by wet chemistry was found to vary between 1.25 and 2.11 with an overall mean of 1.61 ± 0.19. The Ca/P molar ratio determined by EDX varied between 1.29 and 2.25 with an overall mean of 1.71 ± 0.14. Both values are below the average 1.83 ± 0.03 (spread 1.62-2.13) and 1.91 ± 0.02 (spread 1.87-1.93) reported for natural aortic deposits in [3] and [5]
respec-tively, but are close to the value of 1.676 reported in [4]. The determined Ca/P ratio corresponds to that of hy-droxyapatite (1.67) which has also been found in mature arteriosclerotic plaque [1].
The Ca/P ratios determined by EDX and wet chemis-try are in good agreement with the exception of those of sample 1. Taking into account the accuracy of the chemical composition determination and the fact that the median is less influenced by a remote value than the arithmetical mean and is thus a better quantity for com-parison, it seems that two different groups of deposits can be distinguished based on the Ca/P ratio: 1) A group with high Ca/P ratio—specifically samples 1, 2, 5 and 8 and 2) A group with low Ca/P ratio, namely samples 3, 9 and 10. The remaining three samples 4, 6 and 7 exhibit composition that due to the uncertainty in the data can-not be unequivocally assigned to the abovementioned groups or identified as a third group with an intermediate
composition. The other ratios, i.e. Ca/Mg, Ca/(Na + K)
and Ca/C, vary within the same limits in both groups. It should be stressed that the same classification transpires from both EDX and wet chemistry with the exception of sample 1 for which the difference between the analytical results is considerable.
The average Ca/P ratios of the three distinct groups are 1.82, 1.66 and 1.59 using the arithmetic mean of medians or 1.82, 1.65 and 1.61 using EDX means and 1.80, 1.65 and 1.54 using wet analysis means. Thus it seems that the deposits belonging to the group with the high Ca/P ratio consist of carbonated hydroxyapatite (theoretical Ca/P > 1.67) whereas in deposits of the group with the low Ca/P ratio amorphous calcium phos-phate (theoretical Ca/P = 1.5) prevails.
seems to be less reliable than the Ca/P ratio considering the significant differences between the smaller and larger
samples shown in Table 3. The overall arithmetic mean
is 21.4 ± 10.4. The Ca/Mg ratio determined by EDX varies between 11.4 and 65.7 with an overall arithmetic mean 23.4 ± 9.6 which is, however, in a good agreement with the wet chemistry results. The amount of magne-sium in our deposits is considerably higher than found in [5] which reported a value for the Ca/Mg ratio of ap-proximately 120.
These results for the Ca/Mg molar ratio indicate that magnesium is a minor component, if present at all, of the studied deposits; the magnesium content is on average only 5% of that of the major component, calcium. The content of magnesium varies not only among individual deposits but also among discrete parts of the same ob-served large area; some sites in a large area can contain magnesium even though the others do not.
Wet chemistry provides the composition averaged over a relatively large part of a deposit and so it reflects the total composition of the entire deposit rather than the variation of the composition within a deposit. EDX is the only currently available method for determining the chemical composition of selected small areas of deposits. However the accuracy of this method is rather limited, as
can be seen in Table 1, and thus provides only rough
insight into the inhomogeneities of deposit composition.
The data in Table 2 and specifically the comparison of
the standard deviations and medians show the wide variations in the composition of the solid phase on the deposits. The data spread is narrower in the case of the large area measurements than in the case of the small area measurements. However, the average values of the Ca/P and Ca/Mg ratios determined for the small and large scanned areas of the same sample are reasonably close. The substantial difference between point composi-tion of the phosphatic phase, particularly for deposits 1, 2, 5, 7, 8, 9 and 10 and the large fluctuations of the mag-nesium concentration in nearly all samples are signifi-cant even when the uncertainties of ± 9% and ± 17% (the estimated magnitudes of standard deviation ex-pressed as percentages of the mean) in the Ca/P and Ca/Mg ratios respectively are considered.
With only one exception, all the studied sites con-tained potassium, more frequently in combination with sodium, in proportions around 10 mol % of the major component calcium. Potassium is in the minority if both elements are present. Potassium is a minor component of plasma, 4.5 mmol/L of potassium compared to 140 mmol/L of sodium. The presence of potassium in the deposits is not an artefact created during the storage of the valves in formaldehyde solution containing also po-tassium because 1) The surfaces of the deposits are com-pact and thus resistant to penetration of solution into
their interiors during storage, 2) The sites analyzed with EDX were situated inside each deposit, 3) The amount of potassium varies significantly between individual points situated close to each other and 4) The Ca/(Na+K) ratio is fairly similar for different deposits and even throughout each deposit. Neither chlorine nor sulphur was detected in deposits which indicates that the alkali metals are not present in the form of chlorides or sul-phates, so these elements are likely be incorporated in the HAP lattice replacing calcium.
EDX is least reliable for quantitative determination of carbon because carbon is a light element and also pro-duces only one peak that is close to one of the two peaks of calcium. No site was without carbon. The average Ca/C molar ratio was found to be around 30 (with
sev-eral exceptions), i.e. the amount of carbon present is
around 3 mol% (a similar content of carbon was reported in [5]) which indicates that the carbon present is pre-dominantly “inorganic” and therefore bound in the structure of phosphate. However, a substantial amount of organic matter which is not incorporated in the solid
phase (between 9 and 23%, see Table 3) indicates its
important role in the formation of calcific deposits.
The composition of the solid phase, i.e. the Ca, P, K,
Na, Mg and C contents vary between the measured points in all studied deposits. Taking into account the randomness of the selection of analyzed sites we conclude that the composition of each deposit varies throughout its whole volume.
Based on the determined average molar ratios, Ca/P = 1.71, Ca/Mg = 23, Ca/(Na+K) = 9.3 and Ca/C = 34, the average total composition of the calcific deposits is generally Ca10-5x-yMgy(Na,K)10x(PO4)6-2x(CO3)3x(OH)2
w h e r e i n o u r c a s e x = 0 . 1 a n d y = 0 . 4 t j . Ca9.1Mg0.4(Na,K)(PO4)5.8(CO3)0.3(OH)2. The respective
molar ratios calculated from this formula, Ca/P = 1.57, Ca/Mg = 22.7, Ca/(Na+K) = 9.1 and Ca/C = 30.3, cor-respond well to the experimentally determined valu es. This formula is close to the formula Ca8.66Mg0.22Na0.32H0.14(PO4)5(CO3)1.22(OH,F,Cl)0.80
suggested in [14]. The actual composition of the solid phase at various sites deviates from the formula given above.
5. SUMMARY
compo-Copyright © 2011 SciRes. Openly accessible at http://www.scirp.org/journal/JBPC/ sition of the individual deposits indicate that their
for-mation does not proceed under constant conditions.
6. ACKNOWLEDGMENTS
This work was supported by Fundació Barceló (Ref. 1458/2007) and project grant CTF 2010-18271 from the Ministerio de ciencia e
innovación del Gobierno de España. I.G. expresses her appreciation to
the Conselleria d’Innovació i Energia del Govern de les Illes Balears
(Spain) for a fellowship supporting her work. O.S. is grateful to the University of Balearic Islands for grant which made this cooperation possible.
REFERENCES
[1] Tomazic, B.B., Brown, W.E. and Schoen, F.J. (1994) Physicochemical properties of calcific deposits isolated from porcine bioprosthetic heart valves removed from patients following 2-13 years function. Journal of Bio-medical Materials Research Part A, 28(1), 35-47. doi:10.1002/jbm.820280106
[2] Tomazic, B.B., Edwards, W.D. and Schoen, F.J. (1995) Physicochemical characterization of natural and biopros-thetic heart valve calcific deposits: implications for pre-vention. The Annals of Thoracic Surgery, 60(Suppl. 2), S322-S327.
doi:10.1016/0003-4975(95)00205-Y
[3] Mikroulis, D., Mavrilas, D., Kapolos, J., Koutsoukos P.G. and Lolas, C. (2002) Physicochemical and microscopical study of calcific deposits from natural and bioprosthetic heart valves. Comparison and implications for minerali-zation mechanism. Journal of Materials Science: Mate-rials in Medicine, 13(9), 885-889.
doi:10.1023/A:1016556514203
[4] Delonge, C., Lawford, P.V., Habesch, S.M. and Carolan, V.A. (2007) Characterization of the calcification of cardiac valve bioprostheses by environmental scanning electron microscopy and vibrational spectroscopy. Journal of Mi-croscopy, 228(1), 62-77.
doi:10.1111/j.1365-2818.2007.01824.x
[5] Gilinskaya, L.G., Grigorieva, T.N., Okuneva, G.N. and Vlasov, Yu.A. (2003) Investigation of phatogenic miner-alization on human heart valves. I. Chemical and phase composition. Journal of Structural Chemistry, 44(4),
622-631.
doi:10.1023/B:JORY.0000017938.42883.9f
[6] Gilinskaya, L.G., Okuneva, G.N. and Vlasov, Yu.A. (2003) Investigation of pathogenic mineralization on human heart valves. II. ESR spectroscopy. Journal of Structural Chemistry, 44(5), 813-820.
doi:10.1023/B:JORY.0000029819.16581.8a
[7] Gilinskaya, L.G., Rudina, N.A., Okuneva, G.N. and Vlasov, Yu.A. (2003) Pathogenic mineralization on human heart valves. III. Electron microscopy. Journal of Structural Chemistry, 44(6), 1038-1045.
doi:10.1023/B:JORY.0000034811.28903.9b
[8] Michaylova, V. and Ilkova, P. (1971) Photometric deter-mination of micro amounts of calcium with arsenazo III. Analytica Chimica Acta, 53(1), 194-198.
doi:10.1016/S0003-2670(01)80088-X
[9] Chauman, U.P.S. and Ray Sarkar, B.C. (1969) Use of calmagite for the determination of traces of magnesium in biological materials. Analytical Biochemistry, 13(1), 70-80.
doi:10.1016/0003-2697(69)90105-5
[10] Martin, M., Celi, L. and Barberis, E. (1999) Determina-tion of low concentraDetermina-tions of organic phosphorus in soil solution. Communications in soil science and plant analysis, 30(13-14), 1909-1917.
doi:10.1080/00103629909370341
[11] Pleshko, N., Boskey, A. and Mendelsohn, R. (1991) Novel infrared spectroscopic method for the determination of crystallinity of hydroxyapatite minerals. Biophysical Jour-nal, 60(4), 786-793.
doi:10.1016/S0006-3495(91)82113-0
[12] Kapolos, J. and Koutsoukos, P.G. (1999) Formation of calcium phosphate in aqueous solutions in the presence of carbonate ions. Langmuir, 15(19), 6557-6562.
doi:10.1021/la981285k
[13] Ito, A., Maekawa, K., Tsutsumi, S., Ikazaki, F. and Tatei-shi, T. (1997) Solubility product of OH-carbonated hy-droxyapatite. Journal of Biomedical Materials Research Part A, 36(4), 522-528.
doi:10.1002/(SICI)1097-4636(19970915)36:4<522::AID -JBM10>3.0.CO;2-C