Techniques for Estimating the Size of Low-Density
Gopher Tortoise Populations
Jonathan M. Stober,* Rocio Prieto-Gonzalez, Lora L. Smith, Tiago A. Marques, Len Thomas
J.M. Stober
Joseph W. Jones Ecological Research Center, 3988 Jones Center Drive, Newton, Georgia 39870
R. Prieto-Gonzalez
Centre for Research into Ecological and Environmental Modelling, University of St. Andrews, St. Andrews KY16 9LZ, United Kingdom
L.L. Smith
Joseph W. Jones Ecological Research Center, 3988 Jones Center Drive, Newton, Georgia 39870
T.A. Marques
Centre for Research into Ecological and Environmental Modelling, University of St. Andrews, St. Andrews KY16 9LZ, United Kingdom; Centro de Estat´ıstica e Aplica¸c ˜oes da Universidade de Lisboa, Portugal
L. Thomas
Centre for Research into Ecological and Environmental Modelling, University of St. Andrews, St. Andrews KY16 9LZ, United Kingdom
Abstract
Gopher tortoises (Gopherus polyphemus) are candidates for range-wide listing as threatened under the U.S. Endangered Species Act. Reliable population estimates are important to inform policy and management for recovery of the species. Line transect distance sampling has been adopted as the preferred method to estimate population size. However, when tortoise density is low, it can be challenging to obtain enough tortoise observations to reliably estimate the probability of detection, a vital component of the method. We suggest a modification to the method based on counting usable tortoise burrows (more abundant than tortoises) and separately accounting for the proportion of burrows occupied by tortoises. The increased sample size of burrows can outweigh the additional uncertainty induced by the need to account for the proportion of burrows occupied. We demonstrate the method using surveys conducted within a 13,118-ha portion of the Gopher Tortoise Habitat Management Unit at Fort Gordon Army Installation, Georgia. We used a systematic random design to obtain more precise estimates, using a newly developed systematic variance estimator. Individual transects had a spatially efficient design (pseudocircuits), which greatly improved sampling efficiency on this large site. Estimated burrow density was 0.091 60.011 burrows/ha (CV¼12.6%, 95% CI¼0.071–0.116), with 25% of burrows occupied by a tortoise (CV¼14.4%), yielding a tortoise density of 0.02360.004 tortoise/ha (CV¼19.0%, 95% CI
¼0.016–0.033) and a population estimate of 297 tortoises (95% CI¼210–433). These techniques are applicable to other studies and species. Surveying burrows or nests, rather than animals, can produce more reliable estimates when it leads to a significantly larger sample of detections and when the occupancy status can reliably be ascertained. Systematic line transect survey designs give better precision and are practical to implement and analyze.
Keywords: abundance; burrows; cluster size analysis; line transect distance sampling; gopher tortoise; population density; systematic sampling
Received: January 18, 2017; Accepted: May 26, 2017; Published Online Early: June 2017; Published: December 2017 Citation: Stober JM, Prieto-Gonzalez R, Smith LL, Marques TA, Thomas L. 2017. Techniques for estimating the size of low-density gopher tortoise populations. Journal of Fish and Wildlife Management 8(2):377–386; e1944-687X. doi:10. 3996/012017-JFWM-005
Copyright: All material appearing in theJournal of Fish and Wildlife Managementis in the public domain and may be reproduced or copied without permission unless specifically noted with the copyright symbol &. Citation of the
The findings and conclusions in this article are those of the author(s) and do not necessarily represent the views of the U.S. Fish and Wildlife Service.
Present address: 45 Highway 281, Shoal Creek Ranger District, Talladega National Forest, Heflin, Alabama 36264
* Corresponding author: [email protected]
Introduction
Gopher tortoise (Gopherus polyphemus) population estimates are an important metric for managers, researchers, and policy makers because the eastern population is a candidate species (the U.S. Fish and Wildlife Service [USFWS] has determined that proposed listing regulation is warranted but precluded by other higher-priority listing activities) for listing as threatened under the U.S. Endangered Species Act (U.S. Endangered Species Act [ESA] 1973, as amended; USFWS 1987, 2011). Line transect distance sampling (LTDS; Buckland et al. 2001, 2015) has become a standard technique to estimate gopher tortoise abundance as it has proven to be an efficient method relative to plot-based total-count surveys, or burrow total-counts with unverified occu-pancy conversion factors (Nomani et al. 2008; Smith et al. 2009; USFWS 2012). A key strength of distance sampling is that not all animals have to be detected; instead, observed distances to detections are used to fit a detection function, which describes how probability of detection declines with increasing distance from the transect line. By accounting for imperfect detection, LTDS generates an unbiased estimate of abundance if model assumptions are met. At least 60–80 observations are recommended to model the detection function reliably (Buckland et al. 2001). Gopher tortoises can occur in naturally low densities in suboptimal habitat (Brei-ninger et al. 1994; Castell ´on et al. 2012; Legleu 2012) or may persist at low densities because of past exploitation for food or inadequate habitat management (Hermann et al. 2002). Surveys of low-density populations require considerable effort in terms of total transect length, and small sample size can reduce precision (Smith et al. 2009; Castell ´on et al. 2015). In these circumstances, there is a need for new approaches for LTDS surveys. This is particularly true for tortoise populations on large tracts of habitat because of the important role these may play in the overall recovery of the species, whereby these populations may harbor genetic diversity or serve as potential mitigation sites (Smith et al. 2009; Castell ´on et al. 2012).
Gopher tortoises spend the majority of their time in burrows below ground, complicating detection and requiring use of cameras to scope burrows during LTDS surveys (Smith 1995; Eubanks et al. 2003). The primary search objects during surveys are burrows, which usually harbor a single tortoise. Gopher tortoises maintain multiple burrows within their home range, and only a portion of these are occupied by a tortoise. Occupied and unoccupied burrows cannot be differentiated on the basis of external appearance (Smith et al. 2005; Smith et
al 2006), so burrows are searched with a camera to determine if a tortoise is present. In standard LTDS surveys, tortoise observations (including any tortoises at the surface) are used to calculate population estimates (Smith et al. 2009). Burrow cameras can provide a reasonably accurate assessment of occupancy, although in some instances burrows are occluded by roots or debris, make sharp turns, or are temporarily flooded, such that the occupancy cannot be determined with certainty (Smith et al. 2005; Castell ´on et al. 2015). However, with appropriate equipment and trained observers, this source of error is generally small (,5%; e.g., Smith et al. 2009; Stober and Smith 2010).
One approach to increase tortoise detections is to increase survey effort by sampling additional transects or repeatedly sample the same transects (e.g., Buckland et al. 2001; Stober and Smith 2010). However, the effort required to obtain a sufficient sample size for low-density tortoise populations on large tracts of habitat can be considerable (Smith et al. 2009). To increase detections during gopher tortoise surveys, three observers are often used, with one observer on the center line and two additional observers searching from the center line outward (Buckland et al. 2001, Chapter 7; Stober and Smith 2010). This increases the effective strip width, yielding more detections than single observers, increas-ing sample size without increasincreas-ing transect length.
Gopher tortoises are patchily distributed across the landscape, so between-transect variation in encounter rate (numbers seen per unit line length) is responsible for a large component in the overall variance in population abundance. Stratification is one solution to increase precision in such circumstances (Buckland et al. 2001; Thompson 2002), but stratification may not be possible when patchiness occurs at small spatial scales. Another solution is to use a systematic random survey design (Buckland et al. 2001; Thompson 2002; Strindberg et al. 2004). Standard variance estimators assume completely random transect placement and therefore overestimate variance when transects are located in a systematic manner (Thompson 2002; Strindberg et al. 2004). However, a previously developed systematic variance estimator (Fewster et al. 2009) aims to address this.
change to field methods is required. Fitting the detection function to all usable burrows rather than tortoises makes it much easier to reach adequate sample sizes, and has the potential to produce a more precise estimate of detection probability. Estimating the pro-portion of burrows occupied introduces an additional variance component into the estimate of tortoise density. The same idea has been recently used in other taxa where nest or burrows are easier to survey than animals (Bonnet-Lebrun et al. 2016; Buxton et al. 2016; Rexer-Huber et al. 2016). We examined the trade-off in precision using a real-world survey of a large, low tortoise density site and tested the prediction that, in general, modeling detectability of burrows rather than tortoises will produce more reliable results. In addition, we demonstrate use of the new systematic variance estimator (Fewster et al. 2009). Finally, we introduce the concept of sampling pseudocircuit transects to increase field sampling efficiency in tortoise surveys. A tutorial is provided for these methods online (Text S1) to aid in using these methods.
Study site
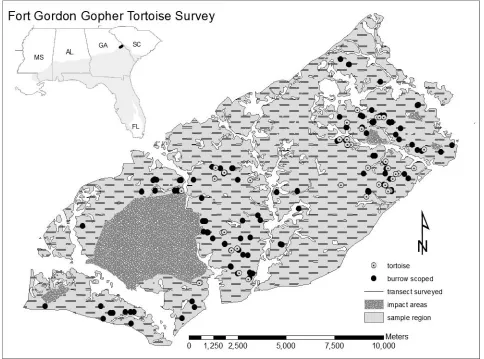
The study took place at Fort Gordon, a 22,500-ha U.S. Army facility located at the transition between the Piedmont and the Upper Coastal Plain physiographic zones of Georgia, near the northern limit of the gopher tortoise’s range. The region has deep sandy rolling ridges on Troup, Lakeland, Lucy, Dothan, and Orangeburg soils. The vegetation is a mixture of off-site pine planted in abandoned agricultural fields and xeric upland sandhills composed of longleaf pine (Pinus palustris), turkey oak (Quercus laevis), bluejack oak (Quercus incana), and a pyrophytic herbaceous understory. Activities at the installation include small arms training, and there is a 5,260-ha artillery impact area where access is restricted. Natural resource management at Fort Gordon is focused on timber management programs with frequent pre-scribed fire and restoration of longleaf pine (INRMPP Fort Gordon 2008). The Department of Defense required delineation of a habitat management unit for the gopher tortoise and a population estimate for the habitat management unit (INRMPP Fort Gordon 2008, Figure 1).
Methods
Survey design, pilot surveys, and data collection The 13,118-ha sample region was delineated with geographic information system (GIS) data layers of the habitat management unit, soil survey, and topographic maps. Developed areas and impact areas were excluded from the survey. The Natural Resource Branch provided GIS data layers of past surveys of tortoise burrows, which were considered incomplete. Three pilot surveys were implemented, starting in December 2009, to determine tortoise encounter rate and estimate the amount of survey effort required for generating a precise popula-tion estimate (i.e., reaching the recommended number of observations and with a desired level of precision;
Buckland et al. 2001, Chapter 7). All surveys were conducted with a crew of three observers (Smith et al. 2009; Stober and Smith 2010) and burrows.12 cm in width were searched for tortoises with a burrow camera scope (Sandpiper Technologies, Manteca, CA; 5-m cable length with an additional 5-m extension).
In the first pilot survey (December 28, 2009–January 1, 2010), transects were of variable length and orientation and were located arbitrarily in a range of suitable habitats across the entire sample region. We surveyed 18 transects from 300 to 2,100 m in length for a total of 14.4 km of transect and detected three tortoises, yielding an encounter rate of 0.2 tortoises/km (0.27 burrows/km), implying that it would be difficult to obtain an adequate sample size to produce a reliable population estimate using tortoise observations. We then undertook a second more extensive pilot survey (January 4–15, 2010), with 59 transects that were 300 to 1,000 m long and distributed systematically across the sample region; total length 45 km. This yielded four tortoises in 12 burrows (0.09 tortoises/km; 0.27 burrows/km). On the basis of this encounter rate, to achieve a coefficient of variation (CV) of 20%, the projected full survey effort (Buckland et al. 2001, Chapter 7) was 842 km. The low numbers of detections in the first and second pilot surveys led us to question whether tortoises still occurred in areas where they had been documented in the past. Therefore, we conducted a third (January 18–22, 2010),‘‘targeted’’pilot survey, with 19 km of transects in areas where clusters of burrows had been found in historic surveys. We observed 19 tortoises in 66 burrows (1.0 tortoise/km, 3.47 burrows/km). Although the targeted pilot survey yielded a much higher tortoise encounter rate than our initial pilot surveys, it was not representative of the encounter rate across the sample region, and burrow occupancy was extremely low (0.29 tortoises/burrow). Because burrows were much more abundant than tortoises, we elected to model the detection function of burrows. This increased the sample size, and was expected to provide more reliable abundance estimates. Last, because burrow encounter rates were vastly different in the first and third pilot surveys (0.27 and 3.47 burrows/km, respectively), indicating a patchy burrow distribution, we used a systematic design. A systematic design provided even coverage of the study area to capture the spatial heterogeneity of burrows, which we expected would improve precision for the encounter rate over that of a random design (Buckland et al. 2001).
minimized the possibility that objects detected on one segment would be detected on the other. We use the term pseudocircuit because the 50-m lines between the end of one segment and the beginning of the next were not surveyed. Transects were separated by 500 m east to west and 300 m north to south (Figure 1), creating an offset grid that was randomly placed across the sample region to provide a systematic coverage of the entire area. One portion of the sample region (7,210 ha) was surveyed from January to March 2010 by Jones Center staff and the remaining 5,908 ha of habitat were surveyed from March to September 2011 by Fort Gordon Natural Resource staff.
For field surveys, a Trimble Nomadt field computer
with global positioning system (GPS) was used to record transect start and end points and navigate transects (Stober and Smith 2010). The GPS (2010: Hemisphere Crescent A100 Smart Antenna, CSI Wireless, Calgary, Alberta; 2011: Magellan N17) units had real-time data correction and were accurate to within 1 m. The survey crew included three observers, one navigating the
transect centerline, using an ArcPadt project on the
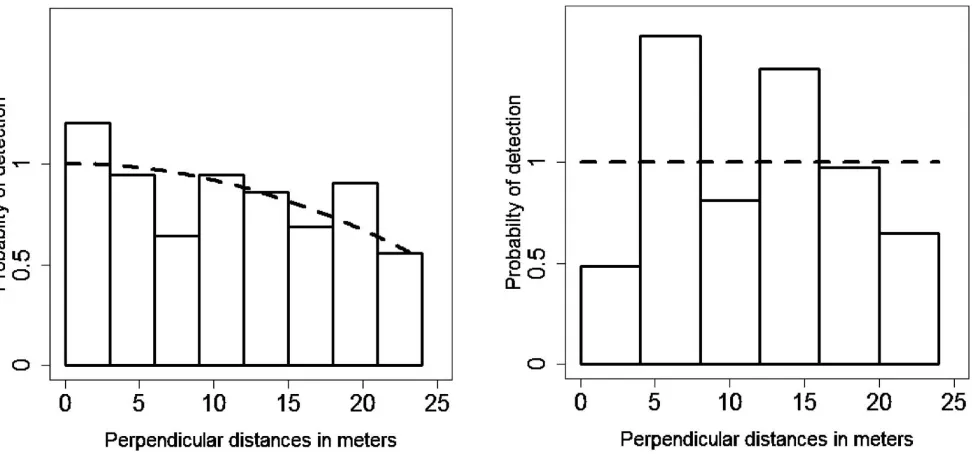
GPS that included a shape file of the transects. The centerline observer searched the line and area close to the line for burrows, and the two additional observers searched from the centerline outward, partially overlap-ping their effort with the observer on the centerline (Stober and Smith 2010; i.e., observers concentrated their search effort on and near the transect). This ensures a shoulder in the detection function (Figure 2), increasing the robustness of a distance sampling analysis (Anderson et al. 2001; Buckland et al. 2001). Burrow locations were taken using the GPS. Burrow occupancy was determined by scoping with a burrow camera. Scoping results and other data were recorded electronically in the GPS using ArcPad.
[image:4.612.65.549.59.418.2]differentiate these unoccupied burrows from burrows that were detectable during surveys but ‘‘unusable.’’
Unusable burrows were those that were collapsed,1 m inside the entrance or were found upon scoping to have been constructed by nine-banded armadillo (Dasypus novemcinctus; i.e., were oval, ,1.5 m in length, and contained a bed of litter and pine straw; Eisenberg and Kinlaw 1999). We attempted to scope all usable burrows .12 cm in width, the smallest width that could accommodate our camera. Burrow width is correlated with age-dependent tortoise length. Tortoises,12 cm in length are considered juveniles (Landers et al. 1982). By excluding burrows ,12 cm wide, our abundance estimate was for the subadult and adult tortoise population. After scoping, usable burrows were catego-rized as 1) occupied: tortoise observed; 2) unoccupied: no tortoise observed; or 3) undetermined: unable to determine tortoise presence with certainty.
Data analysis
Total transect length was calculated using Hawth’s tools and Xtools Pro in ArcGIS. Perpendicular distances from the transect to the burrows were determined in ArcGIS using the NEAR function (Stober and Smith 2010). Transects lengths, perpendicular distances to usable burrows, and burrow occupancy (see below) data were imported into the software Distance (version 6.0, release 2; Thomas et al. 2010) for analysis. We truncated observations at 24 m to increase analytical robustness (Buckland et al. 2001, pp. 103–108). Distance software was used to derive density and abundance estimates, along with the corresponding CVs and 95% confidence intervals (CIs); further details of model development and
analyses are provided online (Text S1). Distance sampling relies on the following assumptions (Buckland et al. 2001, Chapter 2): transects are randomly located (a systematic grid randomly located is preferable); objects on the transect line are detected with certainty; objects do not move; distance measurements are exact; detections are made independently. All of these hold to good approximation in our survey.
The proposed approach is simply a reparametrization of the standard LTDS approach, and hence should be asymptotically unbiased provided the usual assumptions of distance sampling hold. The only additional assump-tion is that an unbiased estimate of the proporassump-tion of occupied burrow is available, which, as we described, is reasonable to expect given the methods considered. Using burrows or tortoises provides unbiased estimates, with the burrow analysis more reliable given the larger sample size, which increases precision but not at the expense of accuracy. We address in the Discussion the implications of the different assumptions, which under our setting hold to a reasonable extent.
[image:5.612.66.552.57.284.2]The key aspect of our approach was the use of burrows instead of tortoises as the objects of analyses. We converted burrow density to tortoise density by including an additional multiplier: the proportion of occupied burrows. This was achieved in Distance by coding burrow occupancy as if it were group size (also called ‘‘cluster size’’—i.e., the number of animals detected in a group): coding occupied burrows as a cluster size of 1, unoccupied as 0, and those where we could not determine occupancy as1 for missing data. Mean cluster size, a quantity estimated by the software, then corresponded to the proportion of occupied Figure 2.Chosen detection functions in two alternative analyses of a line transect distance sampling survey of gopher tortoise (Gopherus polyphemus) at Fort Gordon Army Installation, Georgia during 2010 and 2011. In the left plot, analysis is of n¼157
burrows; in the right plot, it is ofn¼37 tortoises. Dashed lines show fitted detection functions, whereas histograms show detection
burrows, and was the quantity required to convert burrow density to tortoise density. Assumptions of our method were that 1) detectability of occupied burrows was the same as unoccupied (but usable) burrows, and 2) occupancy rate was the same for burrows where we could determine occupancy as those where we could not. These assumptions were readily met in this study— something we return to in the Discussion. For compar-ison with the standard approach to LTDS, we also implemented an analysis based on occupied burrows alone. To model the detection function we considered the key function and series adjustment term combina-tions recommended by Buckland et al. (2001, p.47; Tables 1 and 2). The model selected for inference was that with lowest Akaike information criterion (AIC, Burnham and Anderson 2002); goodness of fit of the selected model was evaluated using quantile–quantile plots, Kolmogorov–Smirnov, and Cram ´er-von Mises tests (Buckland et al. 2015). In our analyses, the variance in the estimate of tortoise density resulted from the combina-tion of three variance components: 1) encounter rate of burrows, 2) detectability of burrows, and 3) burrow occupancy by tortoises (see Text S1 for the relevant formulae). For line transects the encounter rate typically dominates the overall variance. Although systematic designs minimize this variance compared with com-pletely random designs, the variance is hard to estimate for a systematic design because the transect placements are not independent and hence they do not form true replicates. Traditionally, systematic designs are analyzed as if they are completely random. Fewster et al. (2009) showed that this tends to overestimate the true variance, and suggested better approaches based on approximat-ing the systematic design by a stratified design where adjacent pairs of transects are treated as being in small pseudostrata. Here, we used the recommended system-atic design estimator O2 (Fewster et al. 2009); in our case, pairing was done diagonally, since the survey design was based on a diagonal grid. We paired transects in both the northeast and northwest directions (Text S1), and took the average to obtain a final encounter rate variance. To illustrate the benefits of using the new systematic design estimator, we also computed variance using the tradi-tional estimator, which assumes a completely random design (R2, Fewster et al. 2009).
Results
In 2010–2011, 556 pseudocircuits (1300 transect segments) were surveyed, totaling 428.8 km (Figure 1). We detected and scoped 163 usable burrows. Of these, 6 were.24 m from the transect and were not included in the analyses. In the 157 remaining burrows we observed 37 tortoises. We were unable to confirm whether a tortoise was present in 9 of the 157 burrows (5.7%). Burrow occupancy excluding the undetermined burrows was 0.2560.04 (SE) tortoises/burrow. Only one tortoise was observed above ground during the survey.
Details of fitted detection function models are listed in Table 1; goodness of fit was high in all cases. The best model (based on lowest AIC) was the uniform simple polynomial model (Table 1; Figure 2), with a 0.842 6 0.059 (SE) average probability of detection. Several other models had AIC values within 2 units of the selected model; these also had similar estimates of average detection probability and variance (Table 1).
The encounter rate was 0.366 burrows/km and 0.086 tortoises/km. Estimated burrow density was therefore 0.091 6 0.011 burrows/ha (CVO2 ¼12.56%, 95% CI ¼
0.071–0.116) and tortoise density was 0.02360.004 (SE) tortoise/ha (CVO2¼19.02%, 95% CI¼0.016–0.033). On
the basis of burrow detections, the estimated population size was 297 6 56 (SE) tortoises (95% CI ¼210–433). Results assuming randomly located transects yielded larger variances (burrow density: CVR2¼14.596%, 95% CI ¼0.068–0.121; tortoise density: CVR2¼20.427%, 95% CI¼
0.015–0.034). The estimated population size variance also was greater, withN¼297657 (SE) tortoises (95% CI¼
196–446, Table 2). In contrast, in the analysis using tortoises alone rather than usable burrows as the sampling unit, there were only 37 detections with which to construct the detection function. The best model was the uniform model (i.e., detection was certain out to 24 m; Table 1; Figure 2). The encounter rate was 0.086 tortoises/km, giving a density estimate of 0.01860.003 (SE) tortoise/ha (CVO2¼18.56%, 95% CI¼0.012–0.027)
and estimated population size of 236645 (SE) tortoises (95% CI¼165–339, Table 2).
Discussion
The systematic sampling design and occupancy analyses for all usable burrows yielded a reasonably precise population estimate for a very-low-density gopher tortoise population. The systematic pseudocir-cuit transect design was efficient: 428.8 km were surveyed in approximately 9 wk with a field crew of three, and captured spatial heterogeneity of burrows. In contrast, given the estimated occupancy at this site, a conventional LTDS survey based on tortoises would have required at least four times the effort (~1,692 km of transect) to obtain a comparable sample size.
However, if all assumptions of the method are met, the burrow occupancy method will be more reliable because the larger sample size leads to more reliable detection function modeling. Additionally, in our study the variance introduced by estimating burrow occupancy was more than compensated for by the additional sample size of detections, meaning that the two estimates had very similar estimates of variance (CV 19.0% for burrow occupancy; 18.6% for tortoises). The estimate using tortoise detection alone would have had a higher variance if the unrealistic uniform detection function had not been selected (Table 2). Finally, these methodological changes did not require additional data collection in the field and all the analyses could be implemented using Distance software.
One important assumption of our approach was that occupied and unoccupied (but usable) burrows were equally detectable (i.e., the same detection function). This seems reasonable a priori, given that we could not distinguish between these without a burrow camera. However, occupied burrows could be more detectable because of recent tortoise digging activity, particularly between late spring and early fall, when tortoises are most active (McRae et al. 1981). We tested this assumption by extending the detection function analysis to include occupancy status as a covariate in addition to distance, and using AIC to determine if this extended model was supported by the data (i.e., multiple covariate distance sampling—see Marques et al. 2007). The distance-only model had a lower AIC, indicating that an
effect of occupancy on detectability was not supported by the data.
Strictly speaking, the method also assumes that the occupancy rate is the same for burrows with determined and undetermined occupancy status. This is a mild assumption, and even less important in surveys such as ours where the number of undetermined burrows is small. We recommend that all surveys report the number of burrows where occupancy could not be determined along with the survey results. If field conditions preclude the ability to effectively scope burrows (e.g., as in Castell ´on et al. 2015), the method may not be appropriate.
Finally, because our study took place over 2 y, we also assumed that occupancy did not differ between years. It is unlikely that occupancy would change over this short period of time (Smith 1995; Eubanks et al. 2003). However, if occupancy had differed across years, we could have stratified by the different portions of the study area covered in the different years.
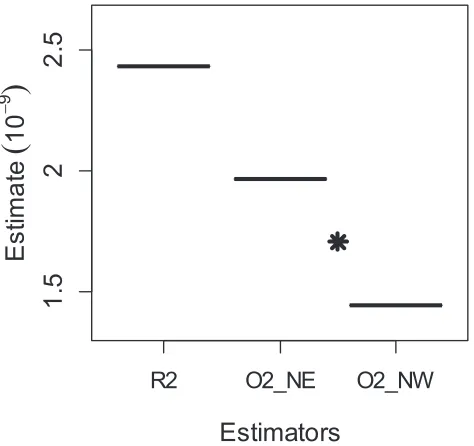
[image:7.612.58.555.106.222.2]As our study demonstrated, a systematic sampling approach in LTDS can increase precision of population estimates. Fewster et al. (2009) found that the random-line variance estimators can perform poorly for system-atic surveys, especially when object density follows strong trends in a particular direction, which was the case in our study. The difference between random vs. systematic variance estimates comes from the encounter rate component (Figure 3). Stratified design techniques are capable of better representing the true underlying variability of the estimators. Therefore, encounter rate
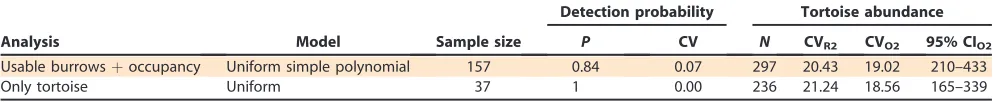
Table 2.Details of the selected model for inference for gopher tortoise (Gopherus polyphemus) population estimates at Fort Gordon, Georgia using program Distance (ver. 6.0 release 2). Analyses were implemented with data collected during 2010 and 2011 using
line transect distance sampling (Buckland et al. 2001) for 157‘‘usable’’burrows and 37 tortoise observations, with truncation at 24
m. R2 is the default variance estimate used in Distance software and O2 is the variance estimate that accounts for the systematic sample design.
Analysis Model Sample size
Detection probability Tortoise abundance
P CV N CVR2 CVO2 95% CIO2 Usable burrowsþoccupancy Uniform simple polynomial 157 0.84 0.07 297 20.43 19.02 210–433
[image:7.612.58.558.682.733.2]Only tortoise Uniform 37 1 0.00 236 21.24 18.56 165–339
Table 1. Overall model comparisons for line transect distance sampling (Buckland et al. 2001) for gopher tortoises (Gopherus polyphemus) performed during 2010 and 2011 at Fort Gordon, Georgia using program Distance (ver. 6.0 release 2). Analyses were
implemented for 157‘‘usable’’burrows and 37 tortoise observations, with data truncation at 24 m. Coefficient of variation (CV) for
the probability of detection shown in parentheses after point estimate.
Model, key functionþ
adjustment terms (order)
Detection probability, P(CV)
Delta Akaike information criterion
Goodness of fit Cramer-von Mises cosine weighting,Pvalue
Usable burrowsþoccupancy
Uniformþsimple polynomial (1)* 0.84 (0.07) 0 0.6
Half-normal 0.84 (0.08) 0.16 0.6
Uniformþcos (1) 0.82 (0.09) 0.78 0.6
Hazard rate 0.93 (0.04) 1.61 0.4
Only tortoise
Uniforma 1 (0.00) 0 0.9
Half-normal 0.94 (0.19) 1.87 0.8
Hazard rate 0.93 (0.13) 3.36 0.7
variance estimators for systematic designs give lower variance compared with estimators for random designs. The difference in this case was not large, because encounter rate accounted for only ~30% of the overall variance, with burrow occupancy playing a much larger role (~56%). In populations with higher burrow occu-pancy and higher density, the encounter rate would likely be a larger component of overall variance, and hence the effect of using a systematic encounter rate estimator would be greater. In cases such as this study, where there is more than one possible pairing of transects to form the strata used for variance estimation, we recommend using the average of variance estimates from the different possible pairings.
Although we created our sample design using ArcGIS, Distance software can create grid-based designs. Dis-tance can create waypoint coordinates of transect end points that can be transformed into systematic parallel transects that can then be exported to a handheld GPS unit for sampling. Program Distance also has a spatial modeling analysis tool that can potentially model habitat preferences and provide more precise estimates (Miller et al. 2013). Because of the limited sample size we did not attempt to use strata in our study. However, in populations where sample size is sufficient, land-use history or habitat characteristics can be used in an a priori or poststratified design to provide habitat-specific population estimates.
For low-density gopher tortoise populations, we recommend the methods used in this survey: performing a thorough pilot survey, categorizing all usable burrows as occupied, unoccupied, or undetermined, and using a systematic design with pseudocircuit transects. If base-line population estimates are derived with these methods, resampling the same transects within the same sampling region in 5–10 y should detect trends in the tortoise population per USFWS (2012) recommenda-tions. Along with these methods, a power analysis could be used to derive a resampling interval appropriate to detect the desired magnitude of change. We have recommended a relatively long resampling interval because the population was extremely small and changes are likely to occur very slowly. Tortoises have a low annual reproductive potential (an average of six to seven eggs per female every 1–2 y), with high mortality of eggs and young (Iverson 1980; Landers et al. 1980, 1982, Epperson and Heise 2003; Smith et al. 2013). Therefore, recruitment of new individuals into the population is slow.
The methods presented here may be suitable for other species such as red-cockaded woodpeckers ( Leuconoto-picus borealis), which excavate nest cavities in large pines; puffins (Fratercula arctica), which nest in burrows (Harris and Murray 1981); or gopher frogs (Lithobates capito), which often inhabit gopher tortoise burrows (Blihovde 2006). Rexer-Huber et al. (2016) derived population estimates for the white-chinned petrel (Procellaria aequinoctialis) by surveying the numerous nesting burrows and were able to stratify by habitat types using a stratified random sampling design. A similar approach could be used with tortoise populations (i.e., stratifying by habitat characteristics, such as native and disturbed ground cover), provided burrow densities were sufficient. Adapting the methods presented for species that include more than one object of interest per detection (e.g., number of parasites in detected hosts, number of eggs per detected/nest), rather than a binary outcome, seems like a natural extension.
Supplemental Material
Please note: TheJournal of Fish and Wildlife Management
is not responsible for the content or functionality of any supplemental material. Queries should be directed to the corresponding author for the article.
Text S1. Step by step outline of executing the line transect distance analysis for gopher tortoises (Gopherus polyphemus) at Fort Gordon, Georgia using program Distance (ver. 6.0 release 2) during 2010 and 2011. The authors have included the data set as an example in the software program Distance.
Found at DOI: http://dx.doi.org/10.3996/012017-JFWM-005.S1 (9866 KB DOCX).
[image:8.612.61.298.58.281.2]Reference S1.Integrated Natural Resources Manage-ment Plan, U.S. Army Garrison, Fort Gordon, Georgia. Baton Rouge, Louisiana: Gulf South Research Corpora-tion. September 2008.
Figure 3. Encounter rate variance estimators for the standard and systematic analyses of line transect distance sampling of
the gopher tortoise (Gopherus polyphemus) population during
Found at DOI: http://dx.doi.org/10.3996/012017-JFWM-005.S2 (13431 KB PDF).
Reference S2. Legleu C. 2012. Modeling gopher tortoise (Gopherus polyphemus) habitat in a fire-depen-dent ecosystem in north Florida. Master’s thesis. Baton Rouge: Louisiana State University.
Found at DOI: http://dx.doi.org/10.3996/012017-JFWM-005.S3 (2243 KB PDF).
Reference S3. U.S. Fish and Wildlife Service. 2012. Candidate conservation agreement for the gopher tortoise (Gopherus polyphemus) eastern population.
Found at DOI: http://dx.doi.org/10.3996/012017-JFWM-005.S4 (2347 KB PDF); also available at http:// www.fws.gov/southeast/candidateconservation/pdf/ CCA_GopherTortoise_revisedDec2012_final.pdf.
Acknowledgments
This work was made possible in cooperation with The Nature Conservancy Chattahoochee Fall Line office contract number GAFO-110509-1 and the support of W. Harrison. Field, technical, and additional support were provided by the Natural Resource Branch at Fort Gordon including: S. Camp, R. Drumm, P. Grimes, S. Partridge, M. Juhan, C. House, C. Holt, and C. Morris and the J.W. Jones Ecological Research Center: E. Schlimm, J. Howze, C. Aiello, and M. Cook. We also thank the anonymous Associate Editor and three anonymous reviewers who substantially improved the manuscript. T.A.M. thanks partial support by CEAUL (funded by Funda¸ca˜o para a Ci ˆencia e a Tecnologia, Portugal, through the project UID/MAT/00006/2013).
Any use of trade, product, website, or firm names in this publication is for descriptive purposes only and does not imply endorsement by the U.S. Government.
References
Anderson DR, Burnham KP, Lubow BC, Thomas L, Corn PS, Medica PA, Marlow RW. 2001. Field trials of line transect methods applied to estimation of desert tortoise abundance. Journal of Wildlife Management 65:583–597.
Beyer HL. 2004. Hawth’s analysis tools for ArcGIS. Available: http://www.spatialecology.com/htools (May 2017).
Blihovde WB. 2006. Terrestrial movements and upland habitat use of gopher frogs in central Florida. Southeastern Naturalist 5:265–276.
Bonnet-Lebrun A, Calabrese S, Rocamora L, L ´opez-Sepulcre A. 2016. Estimating the abundance of burrow-nesting species through the statistical analysis of combined playback and visual surveys. Journal of Avian Biology 47:642–649.
Breininger DR, Schmalzer PA, Hinkle CR. 1994. Gopher tortoise (Gopherus polyphemus) densities in coastal
scrub and slash pine flatwoods in Florida. Journal of Herpetology 28:60–65.
Buckland ST, Anderson DR, Burnham KP, Laake JL, Borchers DL, Thomas L. 2001. Introduction to distance sampling: estimating abundance of biological popu-lations. Oxford, UK: Oxford University Press.
Buckland ST, Rexstad EA, Marques TA, Oedekoven CS. 2015. Distance sampling: methods and applications. Cham, Switzerland: Springer International Publishing. Burnham KP, Anderson DR. 2002. Model selection and
multi inference: a practical information-theoretic approach. 2nd edition. New York: Springer-Verlag. Buxton RT, Gormley AM, Jones CJ, Lyver PO. 2016.
Monitoring burrowing Petrel populations: a sampling scheme for the management of an island keystone species. Journal of Wildlife Management 80:149–161. Castell ´on TD, Rothermel BB, Nomani SZ. 2012. Gopher
tortoise (Gopherus polyphemus) burrow densities in scrub and flatwoods habitats of peninsular Florida. Chelonian Conservation and Biology 11:153–161. Castell ´on TD, Rothermel BB, Nomani SZ. 2015. A
comparison of line-transect distance sampling meth-ods for estimating gopher tortoise population densi-ties. Wildlife Society Bulletin 39:804–812.
Data East 2008. Xtools: Release 9.1 Novosibirsk, Russia. Available: http://www.xtoolspro.com/ (May 2017). Eisenberg JF, Kinlaw A. 1999. Introduction to the Special
Issue: ecological significance of open burrow systems. Journal of Arid Environments 41:123–125.
[ESRI] Environmental Systems Research Instititute. 2008. ArcGIS Desktop: Release 9.3.1. Redlands, California: Environmental Systems Research Institute.
Epperson DM, Heise CD. 2003. Nesting and hatchling ecology of gopher tortoises (Gopherus polyphemus) in southern Mississippi. Journal of Herpetology 37:315– 324.
Eubanks JO, Michener WK, Guyer C. 2003. Patterns of movement and burrow use in a population of gopher tortoises (Gopherus polyphemus). Herpetologica 59:311–321.
Fewster RM, Buckland ST, Burnham KP, Borchers DL, Jupp PE, Laake JL, Thomas L. 2009. Estimating the encounter rate variance in distance sampling. Biomet-rics 65:225–236.
Harris MP, Murray S. 1981. Monitoring of Puffin numbers at Scottish colonies. Bird Study 28:15–20.
Hermann SM, Guyer C, Waddle JH, Nelms MG. 2002. Sampling on private property to evaluate population status and effects of land use practices on the gopher tortoise, Gopherus polyphemus. Biological Conserva-tion 108:289–298.
Integrated Natural Resources Management Plan U.S. Army Garrison, Fort Gordon, Georgia. Baton Rouge, Louisiana: Gulf South Research Corporation. Septem-ber 2008. (SeeSupplemental Material, Reference S1). Iverson JB. 1980. The reproductive biology ofGopherus
Landers JL, Garner JA, McRae WA. 1980. Reproduction of gopher tortoises (Gopherus polyphemus) in southwest-ern Georgia. Herpetologica 36:353–361.
Landers JL, McRae WA, Garner JA. 1982. Growth and maturity of the gopher tortoise in southwestern Georgia. Bulletin of the Florida State Museum, Biological Sciences 27:81–110.
Legleu C. 2012. Modeling gopher tortoise (Gopherus polyphemus) habitat in a fire-dependent ecosystem in north Florida. Master’s thesis. Baton Rouge: Louisiana State University (SeeSupplemental Material, Reference S2).
Marques TA, Thomas L, Fancy SG, Buckland ST. 2007. Improving estimates of bird density using multiple covariate distance sampling. Auk 127:1229–1243. McRae WA, Landers JL, Garner JA. 1981. Movement
patterns and home range of the gopher tortoise. American Midland Naturalist 106:165–179.
Miller DL, Burt ML, Rexstad EA, Thomas L. 2013. Spatial models for distance sampling data: recent develop-ments and future directions. Methods in Ecology and Evolution 4:1001–1010.
Nomani SZ, Carthy RR, Oli MK. 2008. Comparison of methods for estimating abundance of gopher tortois-es. Applied Herpetology 5:13–31.
Rexer-Huber K, Parker GC, Sagar PM, Thompson DR. 2016. White-chinner petrel population estimate, Dis-appointment Island (Auckland Islands). Polar Biology 40:2031–2040.
Smith LL. 1995. Nesting ecology, female home range and activity and population size-class structure of the gopher tortoise,Gopherus polyphemus, on the Kather-ine Ordway Preserve, Putnam County. Florida Museum of Natural History 4:97–126.
Smith LL, Linehan JM, Stober JM, Elliot MJ, Jensen JB. 2009. An evaluation of distance sampling for large-scale gopher tortoise surveys in Georgia, U.S.A. Applied Herpetology 6:355–368.
Smith LL, Steen DA, Conner LM, Rutledge JR. 2013. Effects of predator exclusion on nest and hatchling survival in the gopher tortoise. Journal of Wildlife Management 77:352–358.
Smith LL, Tuberville TD, Seigel RA. 2006. Workshop on the ecology, status, and management of the gopher
tortoise (Gopherus polyphemus). Joseph W. Jones Ecological Research Center, 16–17 January 2003: final results and recommendations. Chelonian Conserva-tion and Biology 5:326–330.
Smith RB, Tuberville TD, Chambers AL, Herpich KM, Berish JE. 2005. Gopher tortoise burrow surveys: external characteristics, burrow cameras, and truth. Applied Herpetology 2:161–170.
Stober JM, Smith LL. 2010. Estimating abundance of small gopher tortoise populations: total counts versus line transect distance sampling. Journal of Wildlife Management 74:1595–1600.
Strindberg S, Buckland ST, Thomas L. 2004. Design of distance sampling surveys and geographic informa-tion systems. Pages 190–228 in Buckland ST, Anderson DR, Burnham KP, Laake JL, Borchers DL, Thomas L, editors. Advanced distance sampling. Oxford, UK: Oxford University Press.
Thomas L, Buckland ST, Rexstad EA, Laake JL, Strindberg S, Hedley SL, Bishop JRB, Marques TA, Burnham KP. 2010. Distance software: design and analysis of distance sampling surveys for estimating population size. Journal of Applied Ecology 47:5–14.
Thompson S. 2002. Sampling. 2nd edition. New York: Wiley.
[ESA] U.S. Endangered Species Act of 1973, as amended, Pub. L. No. 93-205, 87 Stat. 884 (Dec. 28, 1973). Available: http://www.fws.gov/endangered/esa-library/pdf/ESAall.pdf.
U.S. Fish and Wildlife Service. 2011. 12-month finding on a petition to list the gopher tortoise as threatened in the eastern portion of its range. Federal Register 76:14445130–14445162.
U.S. Fish and Wildlife Service. 1987. Endangered and threatened wildlife and plants; determination of threatened status for the Gopher Tortoise Recovery plan. Federal Register 52:12925376–25380.