A
CTIVE
H
UMAN
I
NTELLIGENCE
FOR
S
MART
G
RID (AHISG):
FEEDBACK CONTROL OF REMOTE
POWER SYSTEMS
A
THESIS
SUBMITTED TO THE
U
NIVERSITY OF
C
ANTERBURY
IN PARTIAL FULFILMENT OF THE REQUIREMENTS
FOR THE
D
EGREE OF
D
OCTOR OF
P
HILOSOPHY
by
Miraz Mohamed Fulhu
April 2014
Department of Mechanical Engineering
College of Engineering
University of Canterbury
A
CKNOWLEDGEMENTS
I am thankful to God for giving me patience, guidance and opportunities through all the people who helped me during this research. I would like to express my gratitude to everyone who supported me. The completion of this PhD thesis has been an exciting journey of both academic exploration and self-discovery which, would not have been possible without the continued support of some incredible people.
First of all, I would like to acknowledge the New Zealand Aid Programme (NZAID) for giving me the opportunity to study in this wonderful country through their scholarship. I would like to express utmost gratitude to my senior supervisor, Professor Susan Krumdieck, for her support, patience and encouragement throughout the research period. The basic foundation for this research comes from her remarkable, perceptive ideas and her gift of thinking beyond the boundaries. I was also fortunate to have Professor Pat Bodger as my assistant supervisor. His excellent and invaluable support was always available whenever it was needed. This research project progressed smoothly with the help of both of my wonderful supervisors and their invaluable comments, suggestions and directions.
the development of the MATLAB® simulation. A very special thanks to Dr. Muaviyath Mohamed for his continued support throughout my PhD research. He provided inspiration and support as a colleague, a close friend and as a brother.
A big thanks to the Maldivian community in Christchurch who helped my family and I feel at home during our stay here. Their warm and welcoming support during the most difficult times faced by everyone following the two major earthquakes (on 4 September 2010 and 22 February 2011) will always be treasured. We enjoyed every bit of the social gatherings, picnics and unforgettable trips.
C
ONTENTS
ACKNOWLEDGEMENTS ... i
CONTENTS... iii
LIST OF ACRONYMS ... ix
LIST OF FIGURES ... xi
LIST OF TABLES ...xv
ABSTRACT ... xvii
CHAPTER 1: INTRODUCTION ...1
1.1 Motivation ... 1
1.2 Objectives ... 4
1.3 Outcomes ... 5
1.4 Thesis Organization ... 5
CHAPTER 2: LITERATURE REVIEW ...7
2.1 Remote area power supply (RAPS) systems ... 8
2.1.1 Mini-grids ... 8
2.1.2 Energy sources ... 9
2.1.3 Hybrid systems ... 10
2.2 Control strategies utilized in RAPS systems ... 13
2.3 Smart grid ... 14
2.5 Human behavior in the context of energy use ... 19
2.6 Demand side management and demand response ... 21
2.6.1 Demand response programs ... 23
2.6.2 Advantages of using demand response programs ... 27
2.6.3 Voluntary demand response... 28
2.7 Energy audit and energy survey ... 29
2.7.1 Energy audit ... 29
2.7.2 Energy survey ... 31
2.8 Energy modelling ... 32
2.8.1 Top-down approach ... 32
2.8.2 Bottom-up approach ... 33
2.8.3 Method of diversified demand ... 34
2.9 Summary ... 37
CHAPTER 3: THEORY OF PARTICIPATORY DEMAND RESPONSE ...39
3.1 Introduction ... 40
3.2 Basic concept behind PDR ... 40
3.3 Design of the PDR system ... 43
3.3.1 Traditional model of electric power generation ... 43
3.3.2 Participatory demand response system model ... 44
3.4 Voluntary participation potential ... 49
3.5 Reference elements of the PDR model ... 50
3.5.1 Knowledge ... 51
3.5.2 Reason... 52
3.5.3 Education ... 52
3.6 Summary ... 53
CHAPTER 4: IMPLEMENTATION OF PDR CONTROL IN A MINIGRID ...55
4.1 Introduction ... 56
4.2 End-use load characterization and classification ... 58
4.2.2 Valuation or adaptability survey ... 62
4.2.3 Survey of the powerhouse operators ... 62
4.3 Obtain utility records ... 64
4.4 Reference load curves and fuel consumption control ... 65
4.4.1 Reference load curves ... 65
4.4.2 Real-time monitoring and fuel consumption control ... 66
4.5 Design of utility operator control system to generate feedback signal ... 69
4.5.1 Consumption rate sensor and situation controller sub-system 70 4.5.2 Demand forecast sub-system ... 71
4.5.3 Human behavior monitoring sub-system ... 74
4.5.4 Power generation sub-system ... 75
4.6 Graphic user interface of UFCOCS ... 75
4.6 Summary ... 78
CHAPTER 5: CONCEPT VALIDATION ...81
5.1 Case study island ... 82
5.1.1 Electrical power generation ... 82
5.1.2 Fuel supply and storage ... 83
5.1.3 Power transmission and distribution ... 85
5.1.4 Powerhouse operation and tariff structure ... 87
5.2 Key concepts for validation ... 88
5.2.1 PDR control system ... 88
5.2.2 Operator control system ... 90
5.3 Fenfushi case study ... 90
5.3.1 Constraint scenario 1 (CS1) ... 91
5.3.2 Constraint scenario 2 (CS2) ... 92
5.3.3 Constraint scenario 3 (CS3) ... 93
5.3.5 Constraint scenario 5 (CS5) ... 94
5.4 Summary ... 94
CHAPTER 6: RESULTS AND ANALYSIS...97
6.1 Energy audit and survey results ... 98
6.1.1 Dwelling information ... 98
6.1.2 Household plumbing system ... 100
6.1.3 Monthly power cost ... 102
6.1.4 Household energy consumption ... 106
6.1.5 Customer concerns ... 110
6.2 Energy use during power generation shortage ... 118
6.3 Reference load curves for Fenfushi ... 121
6.4 PDR from resource constrained scenarios ... 123
6.4.1 Constraint scenario 1 (CS1) ... 123
6.4.2 Constraint scenario 2 (CS2) ... 126
6.4.3 Constraint scenario 3 (CS3) ... 128
6.4.4 Constraint scenario 4 (CS4) ... 131
6.4.5 Constraint scenario 5 (CS5) ... 133
6.5 Fuel consumption comparison ... 136
6.6 Operator survey analysis and OCS validation ... 139
6.6.1 Powerhouse operators ... 139
6.6.2 Managing powerhouse duties ... 140
6.6.3 OCS validation ... 140
6.6.4 Validation of the method used for load forecasting ... 141
6.7 Summary ... 142
CHAPTER 7: CONCLUSION, RECOMMENDATIONS AND FUTURE WORK ...145
7.1 Conclusions ... 146
7.2 Limitations in the case study ... 150
7.4 Potential future work ... 152 REFERENCES ...155
APPENDICES ...175
A1. Hourly Variation Factors calculated by (Gönen, 1986) for different household items ... 177 A2. Average diversified demand variations with respect to the number of residential loads (Source: (Gönen, 1986)) ... 179 A3. Fenfushi island powerhouse daily data log sheet ... 181 A4. Adaptability survey questionnaire ... 183 A5. Approximate fuel consumption rates of different rated generators
(Source: (DieselService&Supply, 2013)) ... 187 A6. Number of general household appliances used by the surveyed
households in Fenfushi island ... 189 A7. UFCOCS screenshots and code ... 191 A8. Matlab code for the simulation ... 233 A9. Ethical approval obtained from the Maldives government to conduct
the survey ... 245 A10. Human Ethics Committee approval obtained from the University of
L
IST OF
A
CRONYMS
A/S ancillary services market programs
ADD average diversified demand
AHISG active human intelligence smart grid
BES battery energy storage
BOP building occupancy profile
CAP capacity market programs
CO2 carbon dioxide
COE cost of energy
CPP critical peak pricing
CS1 constraint scenario 1
CS2 constraint scenario 2
CS3 constraint scenario 3
CS4 constraint scenario 4
DB demand bidding
DG diesel generator
DLC direct load control
DR demand response
DRP demand response programs
DSM demand side management
DUF demand use factor
ED-CPP extreme day critical peak pricing
EDP extreme day pricing
EDRP emergency demand response programs
EU european Union
FFC forecasted fuel consumption
GA genetic algorithm
GDP gross domestic product
GMD group maximum demand
GUI graphic user interface
HES hybrid energy system
HVF hourly variation factor
I/C interruptible/curtailable programs
IBP incentive based programs
IHDFI in-house display / feedback interface
LCOE levelised cost of energy
LPSP loss of power supply probability
LV low voltage
MCD medium constrained demand
MD maximum demand
MDD maximum diversified demand
ND normal demand
NREL National Renewable Energy Laboratory
OCS operator control system
PBP price based programs
PDR participatory demand response
PLC power line communication
PSO particle swarm optimization
PV photovoltaic
RAPS remote area power supply
RES renewable energy sources
RET renewable energy technology
RFC real-time fuel consumption rate
RTP real-time pricing
SCD severely constrained demand
SM smart meter
TBP time based programs
TOU time of use
UFCOCS Uility-Fuel-Constraint Operator Control System
VDR voluntary demand response
VPP voluntary participation potential
L
IST OF
F
IGURES
FIGURE 1.1:STANDARD PRESENTATION OF A FEEDBACK CONTROL SYSTEM ... 3
FIGURE 2.1:GENERAL SCHEMATIC OF A REMOTE MINI-GRID ... 9
FIGURE 2.2:STRUCTURAL DIAGRAM OF THE THEORY OF PLANNED BEHAVIOR ... 20
FIGURE 2.3:DEMAND SIDE MANAGEMENT ACTIVITIES ... 22
FIGURE 2.4:ARCHITECTURE OF AN ELECTRICITY DEMAND MODEL ... 34
FIGURE 3.1:KRUMDIECK'S REGIONAL ENERGY-ENVIRONMENT-ECONOMY SYSTEM MODEL ...41
FIGURE 3.2:TRADITIONAL OPEN FLOW ELECTRICITY SYSTEM ... 44
FIGURE 3.3:PDR FEEDBACK CONTROL SYSTEM MODEL ... 45
FIGURE 4.1:AUDIT SHEET -BUILDING OCCUPANCY PROFILE ... 59
FIGURE 4.2:ELECTRICAL END-USE APPLIANCE AUDIT SHEET (PART 1) ... 60
FIGURE 4.3:ELECTRICAL END-USE APPLIANCE AUDIT SHEET (PART 2) ... 61
FIGURE 4.4:POWERHOUSE OPERATOR QUESTIONNAIRE 1 ... 63
FIGURE 4.5:POWERHOUSE OPERATOR QUESTIONNAIRE 2 ... 64
FIGURE 4.6:CONTROL OF FUEL CONSUMPTION RATE WITHIN TOLERANCE LIMITS ... 68
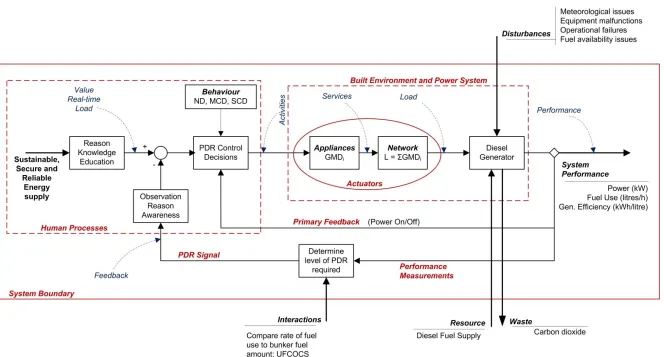
FIGURE 4.7:GENERAL ILLUSTRATION OF THE PDR DESIGN SHOWING THE LOCATION OF UFCOCS ...69
FIGURE 4.8:UTILITY-FUEL-CONSTRAINT OPERATOR CONTROL SYSTEM (UFCOCS) MODEL ...70
FIGURE 4.9:THREE STAGES OF THE HOURLY FORECAST GENERATION FUNCTION ... 73
FIGURE 4.10:INPUT DATA REQUIRED FOR UFCOCS FROM THE OPERATOR ... 75
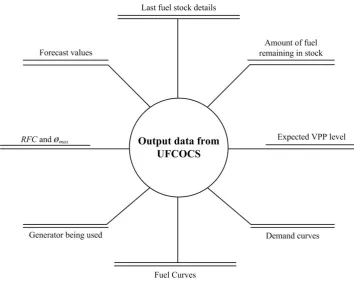
FIGURE 4.12:OUTPUT DATA FROM THE UFCOCS ... 77
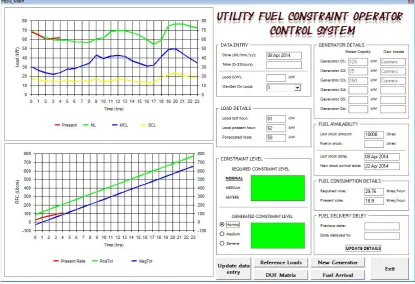
FIGURE 4.13:SCREEN SHOT OF THE UFCOCS INTERFACE FRONT PAGE ... 78
FIGURE 5.1:GENERATOR ARRANGEMENT IN FENFUSHI POWERHOUSE ... 83
FIGURE 5.2:DIESEL FUEL DELIVERY AND TRANSFER ... 84
FIGURE 5.3:MAIN FUEL STORAGE TANKS LOCATED OUTSIDE THE POWERHOUSE BUILDING ...84
FIGURE 5.4:SMALLER DAY TANK LOCATED INSIDE THE POWERHOUSE BUILDING ... 85
FIGURE 5.5:DISTRIBUTION CONTROL PANEL ... 86
FIGURE 5.6:DISTRIBUTION FEEDER CABLE LAYOUT ... 86
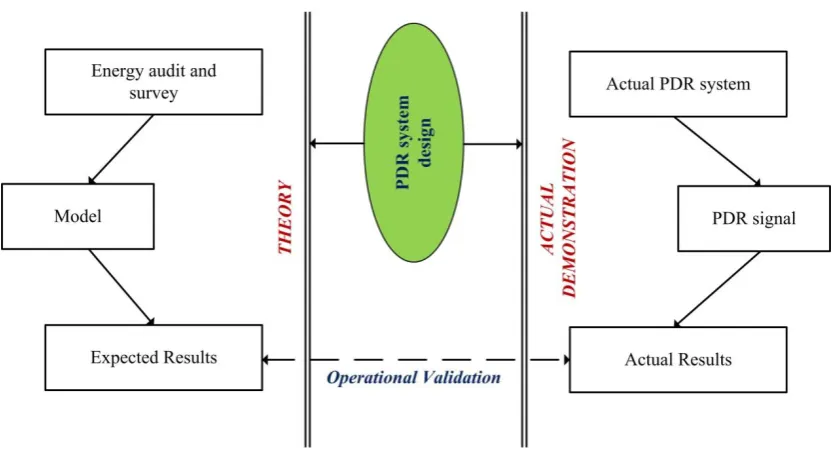
FIGURE 5.7:PDR SYSTEM VALIDATION APPROACH ... 89
FIGURE 6.1:AGE OF THE HOUSE ... 99
FIGURE 6.2:A BATHROOM OF A HOUSEHOLD IN FENFUSHI SHOWING OPEN WELL, DHANI AND THE ELECTRIC WATER PUMP ...101
FIGURE 6.3:INSIDE OF AN OPEN WELL ... 102
FIGURE 6.4:ISLAND AVERAGE OF MONTHLY ELECTRIC POWER COST ... 103
FIGURE 6.5:VARIATION OF AVERAGE POWER COST WITH NUMBER OF BEDROOMS AND HOUSEHOLD OCCUPANCY ...104
FIGURE 6.6:VARIATION OF AVERAGE POWER COST WITH ADULTS AND WITH THE REST OF THE OCCUPANTS ... 105
FIGURE 6.7:DAILY LOADS OF FENFUSHI ISLAND FOR THE MONTHS OF MARCH 2012 TO OCTOBER 2012 ... 106
FIGURE 6.8:APPLIANCE SATURATION RATE FOR COMMON HOUSEHOLD APPLIANCES . 107 FIGURE 6.9:PERCENT OF HOUSEHOLD HAVING FANS AND AIR CONDITIONERS ... 108
FIGURE 6.10:PERCENTAGE SHARE OF DAILY ENERGY CONSUMED ... 108
FIGURE 6.11:INSTALLED CAPACITY AND THE AVERAGE MONTHLY POWER COST, FOR THE SURVEYED HOUSEHOLDS ... 109
FIGURE 6.12:CORRELATION BETWEEN INSTALLED CAPACITY AND THE AVERAGE MONTHLY POWER COST, FOR THE SURVEYED HOUSEHOLDS ... 109
FIGURE 6.13:CUSTOMERS' OPINIONS ON THE APPLIANCE RESPONSIBLE FOR THE MAXIMUM SHARE OF THE ENERGY ... 110
FIGURE 6.14:CUSTOMER RESPONSE TO ELECTRICITY BILL CONCERN... 111
INCIDENTS ... 113
FIGURE 6.17:TYPES OF POLLUTION AFFECTING CUSTOMERS, DUE TO POWER
GENERATION ... 114
FIGURE 6.18:CUSTOMERS' OPINIONS ON THE REASONS FOR POWER FAILURES ... 115
FIGURE 6.19:CUSTOMERS' RESPONSES TO POWERHOUSE OPERATION ... 116
FIGURE 6.20:MAXIMUM POWER OUTAGES ACCEPTABLE DURING A CONSTRAINED SITUATION ... 117
FIGURE 6.21:HOW LONG IS TOO LONG FOR A SINGLE POWER CUT? ... 117
FIGURE 6.22:APPLIANCES THAT CAN BE STOPPED DURING A CONSTRAINED
SITUATION ... 118
FIGURE 6.23:CUSTOMERS' RESPONSES AS TO THE MAXIMUM NUMBER OF LIGHTS
USED IN A CONSTRAINED PERIOD ... 119 FIGURE 6.24:CUSTOMER RESPONSE TO REDUCE FAN USE DURING A CONSTRAINT ... 120 FIGURE 6.25:CUSTOMERS' RESPONSES AS TO WHAT THEIR MOST ESSENTIAL
APPLIANCES ARE ... 120 FIGURE 6.26:HOURLY VARIATION FACTORS FOR SOME APPLIANCE CATEGORIES ... 122 FIGURE 6.27:REFERENCE LOAD CURVES FOR FENFUSHI ... 123
FIGURE 6.28:BOXPLOT FOR HOURLY LOAD VARIATION ON SATURDAYS, SHOWING THE TIME OF PDR FOR CS1 ... 124
FIGURE 6.29:LOAD CURVES FOR CS1 AND AVERAGE FOR SATURDAYS ... 125
FIGURE 6.30:BOXPLOT FOR HOURLY LOAD VARIATION ON SUNDAYS, SHOWING THE TIME OF PDR FOR CS2 ... 127
FIGURE 6.31:LOAD CURVES FOR CS2 AND AVERAGE FOR SUNDAYS ... 127
FIGURE 6.32:BOXPLOT FOR HOURLY LOAD VARIATION ON FRIDAYS, SHOWING THE TIME OF PDR FOR CS3 ... 129
FIGURE 6.33:LOAD CURVES FOR CS3 AND AVERAGE FOR FRIDAYS ... 130
FIGURE 6.34:BOXPLOT FOR HOURLY LOAD VARIATION ON MONDAYS, SHOWING
THE TIME OF PDR FOR CS4 ... 131
FIGURE 6.35:LOAD CURVES FOR CS4 AND AVERAGE FOR MONDAYS ... 132 FIGURE 6.36:BOXPLOT FOR HOURLY LOAD VARIATION ON FRIDAYS, SHOWING THE
L
IST OF
T
ABLES
TABLE 2.2:AVERAGE DIVERSIFIED DEMAND PER CUSTOMER (IN KW) FOR
DIFFERENT NUMBER OF APPLIANCES ...36
TABLE 5.1:SUMMARY OF AVAILABLE GENERATORS ...83
TABLE 5.2:FENFUSHI ISLAND TARIFF STRUCTURE ...88
TABLE 6.1:AGE OF SURVEYED HOUSEHOLDS IN FENFUSHI ...98
TABLE 6.2:COMPARISON OF NUMBER OF BEDROOMS IN THE SURVEYED HOUSES ON FENFUSHI WITH THAT OF STATISTICAL DATA FOR THE ATOLL ...100
TABLE 6.3:AVERAGE HOUSEHOLD OCCUPANCY STATISTICS ...100
TABLE 6.4:DESCRIPTIVE INTERPRETATION OF THE R2VALUE ...105
TABLE 6.5:DESCRIPTIVE INTERPRETATION OF THE PERCENTAGE VALUE ...111
TABLE 6.6:HOURLY VARIATION FACTORS ESTIMATED FOR FENFUSHI ...121
TABLE 6.7:ESTIMATION RESULTS FOR THE CS1 ANALYSIS ...126
TABLE 6.8:ESTIMATION RESULTS FOR THE CS2 ANALYSIS ...128
TABLE 6.9:ESTIMATION RESULTS FOR THE CS3 ANALYSIS ...130
TABLE 6.10:ESTIMATION RESULTS FOR THE CS4 ANALYSIS ...133
TABLE 6.11:ESTIMATION RESULTS FOR THE CS5 ANALYSIS ...135
TABLE 6.12:FUEL CONSUMPTION AND LOAD DETAILS FOR CS1(15SEPTEMBER 2012) ...136
TABLE 6.13:FUEL CONSUMPTION AND LOAD DETAILS FOR CS2(23SEPTEMBER 2012) ...137
TABLE 6.15:FUEL CONSUMPTION AND LOAD DETAILS FOR CS4(08OCTOBER 2012) .138
TABLE 6.16:SUMMARY OF ALL THE CONSTRAINT SCENARIO RESULTS ...139
A
BSTRACT
Fuel supply issues are a major concern in remote island communities and this is an engineering field that needs to be analyzed in detail for transition to sustainable energy systems. Power generation in remote communities such as the islands of the Maldives relies on power generation systems primarily dependent on diesel generators. As a consequence, power generation is easily disrupted by factors such as the delay in transportation of diesel or rises in fuel price, which limits shipment quantity. People living in remote communities experience power outages often, but find them just as disruptive as people who are connected to national power grids. The use of renewable energy sources could help to improve this situation, however, such systems require huge initial investments. Remote power systems often operate with the help of financial support from profit-making private agencies and government funding. Therefore, investing in such hybrid systems is uncommon.
dioxide intensity) and the risk of black-outs due to peak loads. However, there is no information available on the significant link between the constraints in resources and the feedback to the customers. In resource-constrained power grids such as those in remote areas, there is a critical relationship between customer demand and the availability of power generation resources.
This thesis develops a feedback control strategy that can be adopted by the electrical power suppliers to manage a resource-constrained remote electric power grid such that the most essential load requirements of the customers are always met. The control design introduces a new concept of demand response called participatory demand response (PDR). PDR technique involves cooperative behavior of the entire community to achieve quality of life objectives. It proposes the idea that if customers understand the level of constraint faced by the supplier, they will voluntarily participate in managing their loads, rather than just responding to a rise in the cost of energy. Implementation of the PDR design in a mini-grid consists of four main steps. First, the end-use loads have to be characterized using energy audits, and then they have to be classified further into three different levels of essentiality. Second, the utility records have to be obtained and the hourly variation factors for the appliances have to be calculated. Third, the reference demand curves have to be generated. Finally, the operator control system has to be designed and applied to train the utility operators.
C
HAPTER
1
I
NTRODUCTION
The aim of this chapter is to provide introductory material on the research work presented in this thesis. The motivation and objectives behind the research presented are detailed in sections 1.1 and 1.2, respectively. In sections 1.3 and 1.4, research outcomes and thesis organization are discussed.
1.1 Motivation
The electrical power grid is undoubtedly the most important technical infrastructure available today and can be considered the foundation for modern life. It is considered the basic building block of modern industrial economies, and future economic growth is critically dependent on it (Ayres, 2008). Furthermore, most of the essential services associated with human well-being depend on the quality of electric power available. For this reason, a reliable and secure supply of electricity is of utmost importance for society.
Driscoll, Golay, & Peters, 2005). At present, the main source of energy is from fossil fuels—namely coal, oil and gas—providing more than 85% of primary energy demand. However, the increase in this form of energy use has led to a huge increase in the amount of carbon dioxide discharged into the atmosphere. Burning fossil fuels for electricity generation alone accounts for 22% of global greenhouse gas emissions (Jeffs, 2010). Thus, creating a reliable and efficient power system that is both sustainable and environmentally friendly has become more of a challenge.
One of the preferred solutions to this problem is the use of renewable energy technology (RET), namely solar photovoltaic (PV) and wind-power, coupled with battery energy storage (BES). These technologies have been integrated into diesel generator (DG) systems to reduce the consumption of fuel. While integrating these technologies into DG systems reduces the cost of generating energy, the overall capital costs of these systems is relatively prohibitive when compared to DG only systems, at least this was the case until oil prices increased. Increasing oil prices during last few years have made the reduction of fuel consumption a goal in power generation not only for economic reasons, but also for reliability concerns. In most of the diesel generator - renewable energy technology (DG-RET) hybrid systems, diesel generators are used as a support system that only kick in when the RET system is unable to supply the requested power (Ashok, 2007).
Peak demand is another considerable problem for both the security and cost of generation in power systems. Peak demand is the maximum demand any particular system reaches within a considered duration. As it is, this is not a problem. The problem with peak demand arises when the difference between the peak demand and the next closest demand value is considerably greater. Some load control strategies for peak demand management and load shape management have been implemented and are now being used by energy providers. Demand response (DR) is a demand side management (DSM) tool that is being used to manage peak demand by influencing human behavior. There are various types of information that can be fed back to consumers to bring about a necessary change in behavioral patterns. Studies have shown that security, environmental concern and price are factors that receive consumer attention (Gyamfi, Krumdieck, & Brachkney, 2009).
addressed by economics, engineering and science independently (Krumdieck, 2007). Krumdieck (2007) proposes that projects such as the integration of RET into power systems or considering consumer behavior changes using demand side management tools are simply focusing on a component-level, while a system-level, multidisciplinary approach is required to achieve a sustainable solution. As a consequence, new control mechanisms need to be developed to incorporate the regional energy system constraints into the relationship between electrical power suppliers and their consumers. To design such control mechanisms, an understanding of how the basic feedback control system functions is mandatory. The standard presentation of a feedback control system design is illustrated in Figure 1.1.
Figure 1.1: Standard presentation of a feedback control system (Krumdieck 2007)
If the operation of a power generation system is used as an example of a feedback control system, the directive would be the desired load by the customers. In this case, the performance would be the actual load generated. The set points would be the system voltage and frequency. The actuator would be the generator's fuel supply controller, or the governor, and the external input would be the diesel fuel. All these affect the forward elements which, in this case, would be the diesel generators. Transducers detect the actual load generated, and the electronic calibrators, or feedback elements, feed the signal back to the comparator. The importance of signal processors in sustainable operation of a system is illustrated in this example. However, the controller will only operate according to its pre-existing design and cannot bring about any changes on its own.
This example shows that in the power generation system, there is no feedback link between the availability of diesel fuel and the system directives. Hence, in case of a fuel availability constraint, the controller does not have any feedback signal that can activate the customers to reduce their demand. This thesis develops a feedback control system that addresses the aforementioned link required for sustainable power generation in a remote electric power grid.
1.2 Objectives
The main purpose of the research presented in this thesis is to develop and evaluate a real-time feedback control strategy of a resource-constrained remote electric power grid using participatory demand response (PDR). Different methods of demand control for power grids are already being used by different electrical providers. The method adopted in this research has not yet been attempted and this is supported by the literature review in Chapter 2. The PhD research presented herein sought to meet the following objectives:
Investigate the resource constraints in remote electric power grids.
Design a control strategy that integrates consumer participation in managing
the community electric power demand.
Implement this design into a remote power grid to validate the key concepts.
1.3 Outcomes
The main contribution of this research is a real-time feedback control strategy for a resource-constrained remote power grid using a novel concept introduced as participatory demand response (PDR). In addition to this main contribution, the following outcomes are achieved:
Classification of end-use load into three levels of essentiality, namely
deferrable, optional and essential loads.
An energy audit and energy survey methodology for a remote island
community.
Three levels of voluntary participation potential from the consumers. These
levels are used as reference load curves and are generated using the concept of maximum diversified demand.
A computer-based utility operator control system named
Utility-Fuel-Constraint Operator Control System (UFCOCS).
The introduction of an electrical demand forecast methodology that utilizes a
demand-use-factor (DUF) matrix.
An estimated hourly variation factors (HVF) table for the island of Fenfushi,
which can be used in similar remote islands in the Maldives.
1.4 Thesis Organization
logical sequence of information, from reviewing the available literature to the application and testing of the developed methodology. A brief description of the chapters that follow is provided below.
Chapter 2: This chapter provides a critical review of the literature on the
remote area power supply systems and different control strategies being used to manage energy demand.
Chapter 3: The theory of participatory demand response (PDR) is covered in
this chapter, which provides an explanation of the main concepts as well as the control system design concepts.
Chapter 4: This chapter provides a detailed description of the implementation procedure for introducing the developed PDR control system into a remote electric power grid.
Chapter 5: The concept validation procedure, including case study scenarios,
for the PDR system developed in this thesis is discussed in this chapter.
Chapter 6: This chapter presents the evaluation results of the PDR system developed in this research. The statistical analysis carried out for the scenarios developed in Chapter 5 for validating the PDR model are presented, along with the energy audit and survey results.
Chapter 7: Conclusions, recommendations and suggestions for future work
are discussed in this chapter.
C
HAPTER
2
L
ITERATURE
R
EVIEW
"You can never have an impact on society if you have not changed yourself"
-Nelson Mandela-
E
NERGY is a commodity that is essential to everyone in modern society. It is arequirement for all of our everyday services. However, energy supply and consumption is also an issue that many do not think about until they are confronted with an energy crisis. Remote communities face different kinds of energy crisis on a frequent basis, which will be explained in this chapter.
2.1 Remote area power supply (RAPS) systems
Maintaining a secure and reliable power supply in remote areas is a major challenge for energy engineers and the utility industry. Installation of distribution lines from an existing national grid is considered uneconomical due to factors such as difficult geographical terrain for a line to go through and the low level of load that needs to be supplied (Mondal, Kamp, & Pachova, 2010). Remote power by grid extension also suffers from low power quality and high transmission and distribution losses (Ambia, Islam, Shoeb, Maruf, & Mohsin, 2010; Moharil & Kulkarni, 2009). The most viable solution for supplying power to remote communities is by installing a local mini-grid that satisfies the community demand.
2.1.1 Mini-grids
Figure 2.1: General schematic of a remote mini-grid
Most remote power supplies have at least two diesel generators, often with different capacities, in a powerhouse serviced by local operators (van Alphen, van Sark, & Hekkert, 2007). The normal operating regime for a remote power generation system servicing a mini-grid involves running one generator at a time with manual roll-over between generators of different sizes to accommodate the normally expected peak loads or anticipated load drop-offs. Synchronous operation of multiple generators with automatic roll-over is much more expensive than manual operation. Remote areas typically have load patterns with peaks at morning and evening meal times, and minimums during mid-day and night (Camerlynck, 2004; Ijumba & Singh, 2004; Underwood, Ramachandran, Giddings, & Alwan, 2007). These patterns are used by the local operator to decide on the appropriate generator to use and the time for roll-over. This type of operating scheme is basically open-flow control with prescribed set point management and little or no real-time analysis or management.
2.1.2 Energy sources
& Pearce, 2011). LCOE is the complete life cycle cost of a power generating technology per unit of electricity, and is expressed in $/kWh. LCOE allows comparison of different modes of generation despite the difference in their cost structures (Ueckerdt, Hirth, Luderer, & Edenhofer, 2013).
The main drawback of using RES such as solar and wind is the fluctuating nature of their availability. Solar PV systems require sunlight, hence they are limited to the time when radiation from the sun is available. Similarly, wind turbines only generate electric power when there is enough wind for the generator to operate. Unlike fossil fuels, sunshine and wind can be neither stored nor transported to their place of use. They need to be converted to another form such as electricity, which is then either transmitted or stored.
One of the most common forms of electricity storage in power systems is the lead-acid battery. The main problem with this form of storage is that it can store only a comparatively small amount of electrical energy compared to the amount normally required for consumption. The other disadvantage of using battery energy storage (BES) is the losses involved. Coulombic losses and Voltaic losses (Dell & Rand, 2001) are examples of losses that may occur in the batteries. Coulombic loss, or coulombic inefficiency, can be defined as the electrical current wasted in non-productive side reactions; corrosion in battery components is an example. Voltaic loss, or voltaic inefficiency, is the measure of the difference between the charging and discharging voltage. The voltage required to charge a battery is always greater than the discharge voltage. Due to these losses, the overall electrical efficiency for electrochemical processes generally falls in the range of 50−75%. As a result, a system including BES becomes costly in terms of installation as well as operation and maintenance (Su, Huang, & Lin, 2001).
2.1.3 Hybrid systems
system dynamics depending on their operating characteristics. Thus, the use of a hybrid system can improve overall flexibility, reliability and efficiency of the electric power system (Shaahid & Elhadidy, 2007; Urbanetz, Braun, & Rüther, 2012).
Hybrid systems are becoming a more accepted option for remote power generation systems. There are two main reasons for power generation using hybrid systems in remote areas. Independent use of RES results in over-sizing the system due to reliability concerns, which increases the investment cost. Similarly, independent use of a diesel-only system can have high operation and maintenance costs, even though the initial investment is low (Elhadidy & Shaahid, 2000). A hybrid system consisting of RES coupled with DGs can be considered one of the best options for RAPS systems. Such hybrid systems can achieve a high rate of renewable energy penetration and also maintain a stable supply of electric power (Rehman & Al-Hadhrami, 2010; Segurado, Krajačić, Duić, & Alves, 2011). In an Alaskan village, by upgrading the DG stand-alone system to a DG-Wind hybrid power system, the power suppliers were able to get a 50% reduction in diesel fuel consumption. Furthermore, they also achieved a 30% saving in the annualized cost (Clark & Isherwood, 2004).
To utilize the hybrid system efficiently and economically, it should be sized accordingly, such that it operates in the most optimum conditions in terms of investment and system reliability. Different optimization techniques are being used and have been reported in the literature. (Zhang, et al., 2013) presented a method for the component sizing of hybrid systems based on the optimization of power dispatch simulations. This methodology involved evaluating and minimizing the COE in the system power dispatch simulations, which included the capital depreciation cost, fuel cost, emissions damage cost, and also the maintenance and replacement cost of the entire project life cycle.
minimum. (Kalantar & Mousavi G, 2010) also presented a hybrid system optimization methodology based on economic analysis using GA. The hybrid system, which can be used to supply electricity to isolated rural areas, consisted of a wind turbine, a solar array, a micro-turbine and a battery bank.
Particle swarm optimization (PSO) is another technique that is used for hybrid system sizing optimization. It is based on the theory of swarming, and belongs to the evolutionary computation techniques (Kennedy & Eberhart, 1995). The PSO technique was used by (Sa, x, nchez, Ramirez, & Arriaga, 2010) for the optimal sizing of a hybrid system such that the demand of an isolated load is met. The methodology developed allowed calculation of the best system configuration that could deliver the required energy supply reliably, while maintaining a desirable level of system economics. (Mohammadi, Hosseinian, & Gharehpetian, 2012) also presented a method that utilizes the PSO technique for optimizing the design of a micro-grid with a hybrid system consisting of a PV array, wind turbine and a battery bank for energy storage. The optimization algorithm developed was applied to an LV network which was operating under different market policies, in order to obtain the minimum micro-grid cost.
Literature has also shown the use of other optimization techniques such as simulated annealing (Ekren & Ekren, 2010), neural networks (Mellit & Benghanem, 2007; Mellit, Kalogirou, & Drif, 2010) and stochastic approaches (Kaplani & Kaplanis, 2012; Z. Zhou et al., 2013). Apart from the few described above, more techniques are available in the literature dedicated to hybrid system optimum sizing.
found in (Belmili, Haddadi, Bacha, Almi, & Bendib, 2014).
2.2 Control strategies utilized in RAPS systems
Most remote power systems often suffer from security issues such as brown-outs and black-outs, and power reliability issues such as frequency and voltage fluctuations. Security of power can be threatened by natural phenomena such as meteorological issues, or accidental problems such as equipment malfunctions and operational failures (Bompard, Huang, Wu, & Cremenescu, 2013). In stand-alone diesel generator systems, failure in fuel delivery or shut-down of a generator can lead to serious security issues. Similarly, low wind and solar radiation can disrupt the power supply from wind turbines and solar PV systems. To minimize these threats, as discussed in
section 2.1.3, hybrid systems are becoming a popular technology for the power generation sector in remote power systems. However, the use of RES augments concerns for power reliability issues, such as frequency and voltage fluctuations, due to the intermittent nature of their availability. To reduce these fluctuations, the use of energy storage devices such as batteries has been adopted by power engineers (Ali Nandar, 2013).
Three types of strategies are practiced as control strategies in RAPS systems. The initial strategy utilized in remote power systems is to have a power availability time schedule. This is to ensure that the system is able to operate at times when the customers require it most, and the supply schedule remains uninterrupted throughout the month. These types of scheduled systems normally incorporate a single diesel generator. An example for a time scheduled operation is the power supply on the coral atolls of Tokelau. In Tokelau electricity is supplied from around 7.00 or 8.00 a.m. until 3.00 or 4.00 p.m. during day time. The evening supply is from around 5.30 p.m. until around midnight (Hamm, 2007).
in power generation or as a result of failures in distribution infrastructure. For example, as a result of the attempted coup in the Maldives on 3 November 1988 (Singh, 2012), all the islands in the Maldives were advised to generate power only at specific times of the day in order to minimize the use of diesel fuel. This measure was taken by the government in response to the shortage in fuel and its availability during the time of national emergency.
The most recent strategy is the use of hybrid systems for RAPS. Remote hybrid power systems with RES normally incorporate a diesel generator or a battery bank (sometimes both) as a backup source for periods when the renewable resource is insufficient in meeting the demand. Hybrid systems reduce the amount of risk on the system security due to the reduction in conventional fuel use. As a backup source, a diesel generator improves system reliability by supplying the system with the power required when renewable sources are unable to meet the demand (Merei, Berger, & Sauer, 2013). Batteries are normally used to enhance system reliability by minimizing the sudden surges in frequency and voltage caused by fluctuations in the RES (Aghamohammadi & Abdolahinia, 2014; Tan, Li, & Wang, 2013). When the system is generating more power than required, the excess power is used to charge the battery bank, which can later be discharged into the grid to fill in any unmet load.
2.3 Smart grid
The traditional power grid is considered a centralized and service provider controlled network system. It acts as a network with a one-way transmission of power that flows from the generating station to the consumers. In most developed countries there is no consumption limit for end-users and the supplier is responsible for supplying the consumers' fluctuating demands (Crossley & Beviz, 2010). This fluctuation can be problematic when demand starts to outgrow what the supplier can provide. Under such circumstances, without a feedback technology, the electric power grid can be a difficult system to operate. As a result, it is of utmost importance to change the power grid into a much smarter one.
defined as a modern electric power grid that is technically superior and sustainable compared to the traditional grid. Such a system should have well established communication and monitoring capabilities (Wang, Xu, & Khanna, 2011), and enhanced control and management functionalities (Mei & Zhu, 2013). The feedback technology incorporated into a smart grid should keep both the utility company and the consumer updated.
While smart grids are already being developed by some countries, a few countries such as the United States have already started to implement the technology (Ghosh, Pipattanasomporn, & Rahman, 2013). Countries including Korea (Sung-Yong & Beom-Jin, 2009), India (Mukhopadhyay, Soonee, Joshi, & Rajput, 2012) and China (Uslar, Rohjans, & Specht, 2012) are concentrating on implementing such systems in the near future. Even though China has not fully implemented the use of smart grids, they have been leading the smart grid technology implementing process amongst the developing economies (Nejad, Saberian, Hizam, Radzi, & Ab Kadir, 2013). Of the top ten countries for federal investments on smart grids in the year 2010, China led with an investment of US$7.32 billion (Ghosh, et al., 2013).
The simplest form of the smart grid has four features:
an in-house display and smart feedback interface
a smart meter for monitoring energy usage
a technically enhanced bidirectional communication−enabled distribution
network
a supplier side interface
categorized and conveyed effectively in order to promote energy-saving behaviour. Studies have shown that proper layout and quality of feedback could result in achieving energy savings of 5%−15% (Burgess & Nye, 2008; Darby, 2006). Detailed research on the key design specifications of this type of display has been carried out by (Anderson & White, 2009).
The level of information required by the IHDFI cannot be monitored by traditional meters with rotating disks. To display appropriate and precise energy consumption details, advanced digital meters that can monitor real-time energy consumption data are required. Such digital meters, also called smart meters (SM), must be able to record hourly or more frequent end-use consumption, and transmit the data over a communication network to the utility provider (Ehrhardt-Martinez, Donnelly, & Laitner, 2010). This makes the SM one of the most critical devices required by the smart grid. Using the SM offers several advantages:
enabling two-way communication between consumers and suppliers
enabling suppliers to better manage the demand during peak load times
enabling more accurate billing for consumers
enabling implementation of better tariff models
In the European Union (EU), Italy's penetration rate for smart meters has reached 85%, while France, Ireland, the Netherlands, Norway and Spain project to completely switch over to SM technology by the year 2020 (Faruqui, Harris, & Hledik, 2010). In the United States, there were a total of 36 million smart meters installed as of May 2012. This number is estimated to reach approximately 65 million units by the year 2015 (I.E.E., 2012).
distribution network (Celli, Ghiani, Pilo, & Soma, 2013). These enhanced functions can introduce self-healing of the network to reduce interruption time, and carry out intentional islanding to improve reliability (Brown, Suryanarayanan, & Heydt, 2010), since feeder-level component failures account for almost 80% of consumer interruptions (Hammoudeh, Mancilla-David, Selman, & Papantoni-Kazakos, 2013). Different methods of incorporating communications technology into the smart grid have been tested. Some of these include internet based architecture, power line communication (PLC) architecture and wireless networks (Gao, Xiao, Liu, Liang, & Chen, 2012).
The fourth main component of the smart grid is the supplier side control interface. One of the fundamental operations of the supplier is to ensure that consumer demand is met. The supplier must be able to monitor the entire network in order to maintain a reliable and secure power grid. With the help of a smart monitoring system, the supplier is able to conduct different demand side management activities like real-time pricing or direct load control, which can help in maintaining a healthy power grid. The smarter control interface also enables the supplier to integrate different types of power generation technologies, such as solar PV and wind energy, hence reducing the utilization of fossil fuels for power generation (Alagoz, Kaygusuz, & Karabiber, 2012; Järventausta, Repo, Rautiainen, & Partanen, 2010).
2.4 End-use load characterization
The end-use electrical demand of any community can be broadly classified into three main categories. These include governmental demand, commercial or industrial demand and residential demand.
Governmental demand
Commercial / Industrial demand
In most remote areas this sector mostly consists of small businesses such as retail shops and cafés. In some island communities it can also include commercial facilities such as boat yards where boats are built and repaired.
Residential demand
This is the electrical load required by the residential sector of the community. While residential energy is responsible for about a third of total global energy use (IEA, 2008), it is the main sector contributing to the maximum demand within a remote community. Residential end-use equipment can vary from electrical lighting to high power consuming devices such as air-conditioners. Of all household end-use appliances, refrigerators, TVs, washing machines, electric irons and air-conditioners account for the highest consumption of electricity (Daioglou, van Ruijven, & van Vuuren, 2012; Rosas-Flores & Gálvez, 2010). However, the majority of consumers have no knowledge of which appliance in their household consume the most energy. In a study conducted by (Mansouri, Newborough, & Probert, 1996), when residents were asked about the first, second and third most energy consuming electrical appliances in their household, the majority of respondents selected the washing machine, while the top three energy consumers were the lighting, freezer and dishwasher.
Each of the three categories of demand mentioned above can be further classified into
deferrable, optional and essential loads, depending on the essentiality of each of the appliances. A deferrable load can be defined as the power consumed by an appliance that can have its time of utilization deferred within the day or the week. Deferrable load can also include those appliances that can be totally isolated from the grid until a constraint has subsided. For example, in remote island communities, the use of a washing machine can be replaced by washing by hand.
These loads are different from deferrable loads in the sense that these loads cannot be completely taken off grid. Optional loads can vary from person to person or from household to household.
The essential loads are defined as the power consumed by appliances that, if power demands were unmet and these appliances failed, would have a negative impact on the health and wellbeing of consumers. During an energy audit and survey, these loads should be very clearly identified. The aim of the power supplier should always be to provide this load to the consumer. In a lot of places, an example of such a load would be the fridge/freezer.
By classifying the end-use load into these categories, it is easier for an energy engineer to design a demand response program. To acquire this information it is important to carry out an energy audit survey. However, before designing a survey, consumer behavior towards energy use should be understood.
2.5 Human behavior in the context of energy use
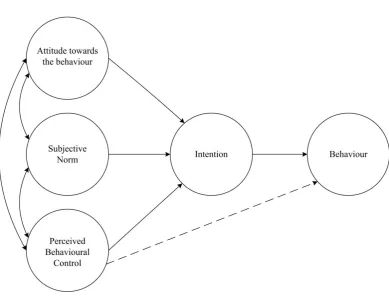
The theory of planned behavior (Ajzen, 1991) is another model that is often used in psychological studies. This is an extended version of the theory of reasoned actions. This theory states behavior is explained by an individual’sintention (BI) to engage in a particular behavior. The individual’sintention depends on his or her attitude (A) towards that behavior, or how the individual evaluates the given behavior, and the
[image:42.595.86.476.352.652.2]subjective norm (SN), which is a social factor and depends on the social pressure to carry out a particular behavior (Ajzen & Madden, 1986). Perceived behavioral control is the third factor that determines behavioral intentions (Ajzen, 1991). Perceived behavioral control (PBC) is a measure of an individual's perception towards carrying out a given behavior, which may vary depending on the situation and type of action (Ho, Tsai, & Day, 2011). Figure 2.2 shows a structural diagram of the theory of planned behavior.
Figure 2.2: Structural diagram of the Theory of Planned Behavior (Ajzen 1991)
Eq. 1
where w1, w2 and w3 are regression weight correction factors. The attitude is further specified as individual salient beliefs (bi) about a relevant attribute, multiplied by the evaluations (ei) of those attributes. Subjective norms are given as the product of the normative beliefs (nbj) multiplied by the motivation to comply (mcj) to those. The perceived behavioral control is comprised of the sum of the control beliefs (cbk) multiplied by the perceived facilitation (pfk) of the control factors (Ho, et al., 2011).
The theory of planned behavior is considered to be a good predictor of behavior and has been used to predict hygienic food handling behaviors (Mullan & Wong, 2009; Phillip & Anita, 2010), predict bad driving habits (Chan, Wu, & Hung, 2010; Forward, 2009; Moan & Rise) and predict eco-friendly activities (Han, Hsu, & Sheu, 2010; Tonglet, Phillips, & Read, 2004)
2.6 Demand side management and demand response
In the late 1970s when demand side management (DSM) programs were first introduced, they were aimed at creating awareness of energy conservation amongst customers. Load management programs came into practice in the 1980's and by the end of the decade, DSM activities were widespread (Bock, 1998; Gellings & Chamberlin, 1993). The most widely accepted definition of DSM is:
"Demand Side Management is the planning, implementation, and monitoring of those utility activities designed to influence customer use of electricity in ways that will produce desired changes in the utility's load shape, i.e., changes in the time pattern and magnitude of a utility's load" (Gellings, 1985).
Figure 2.3: Demand side management activities (source:(Gellings and Smith 1989; Grover and Pretorius 2007))
DSM techniques are now being practiced by power suppliers in most countries to manage peak demand issues (Qureshi, Nair, & Farid, 2011; Rankin & Rousseau, 2008). Utility providers use different activities either directly caused or indirectly stimulated by the provider, that are designed to influence customers to consume electricity in such a way that the utility load curve is in a desired form (Grover & Pretorius, 2008).
Demand response (DR) is a DSM technique that involves participation of end-users where they respond to signals given by the electrical power suppliers by managing the amount of energy used (Kwag & Kim, 2012). Studies have shown that when end-users are aware of their usage, they tend to manage their total consumption to some extent. Large differences have been observed in end-users' preferred feedback mechanisms, depending on factors such as dwelling type, age of the 'head of household' and energy consumption levels (Vassileva, Odlare, Wallin, & Dahlquist, 2012).
consumers were provided with data on the power consumption of different appliances, there was a 12% reduction in power consumed by the appliances displayed. A 5% reduction in power consumption by appliances that were not displayed was also observed (Ueno, Inada, Saeki, & Tsuji, 2006a; Ueno, Sano, Saeki, & Tsuji, 2006b). Similarly, Vassileva et al. (2012) found that using an interactive web page to display household consumption feedback achieved a 15% reduction in electricity consumption from those households that visited the web page at least once (Vassileva, et al., 2012).
Electricity price, participation level of customers, as well as incentive and penalty values are other factors that affect the level of power consumption in households (Moghaddam, Abdollahi, & Rashidinejad, 2011). Dynamic electricity pricing is a DR technique that is normally used to reduce peak demand on the electric power grid (Avci, Erkoc, Rahmani, & Asfour, 2013; Ericson, 2011; Gyamfi, Krumdieck, & Urmee, 2013). A dynamic tariff is designed such that the price per unit ($/kWh) of electricity consumed is higher at times when the load on the system is at a peak and the price per unit ($/kWh) is lower during the off-peak hours. Consumers tend to shift their peak load from the periods of high tariffs to times when the tariff is lower, while maintaining the same total energy consumption. The impacts of dynamic electricity pricing on price spikes, peak demand, consumer energy bills, power supplier profits and congestion costs have been explored by Valenzuela et al. (2012), with the help of an agent-based model known as Electricity Market Complex Adaptive System or EMCAS. The model provides consumers with day-ahead forecasts of peak and off-peak prices in an attempt to influence customers to use energy at different times of the day (Valenzuela, Thimmapuram, & Kim, 2012).
2.6.1 Demand response programs
Demand Response Programs can be classified into two main categories, namely: incentive based programs (IBP) and price based programs (PBP) / time based programs (TBP) (Aalami, Moghaddam, & Yousefi, 2010a, 2010b; Albadi & El-Saadany, 2008).
2.6.1.1 Incentive based programs (IBP) include:
In direct load control (DLC) programs, the utility or system operator has the ability to shut down or cycle the power supply to a customer’s appliance remotely, on short notice, for a short period of time. Most appliances that are shut down or cycled are ones that consume high levels of power. Typically, remotely controlled appliances in developed countries include air conditioners, water heaters and swimming pool pumps. One such program in the USA achieved a total demand reduction of 1000MW during normal conditions and 2000MW during emergency condition (Ericson, 2009; Strbac, 2008).
Interruptible/Curtailable programs
With Interruptible/Curtailable (I/C) programs, the participants receive upfront incentive payments, bill credits or rate discounts. Participants are asked to curtail a specific block of electric load or curtail their consumption to a predefined level during system contingencies. Customers should typically respond within 30−60 minutes of being notified by the utility. If the participants do not respond, they can face penalties, depending on the program terms and conditions. The number of times or hours that such interruptions can be called by the utility provider is limited to not more than 200 hours per year (Aalami, et al., 2010b).
Demand bidding programs
In demand bidding (DB) programs, customers bid on the price at which they are willing to offer a specific load reduction or identify the amount of load they are willing to curtail for a given price. Once a bid is accepted, customers can face penalties if they do not curtail the load by the amount specified in the bid. This type of program helps to maintain a steady supply and demand without having to increase the generation capacity. Some techniques that are currently used include programmable thermostats to control air conditioning and heating systems (Grover & Pretorius, 2007; Strbac, 2008).
Emergency demand response programs
case, the curtailment is voluntary (Nikzad & Mozafari, 2014).
Capacity market programs
Capacity market programs (CAP) are offered to customers who can commit to providing pre-scheduled load reductions when system contingencies arise. Customers usually receive a day-ahead notice of events and are penalized if they do not respond when directed.
Ancillary services market programs
Ancillary services (A/S) market programs allow customers to bid on load curtailment in the electricity market as operating reserve. If the bids are accepted, customers are paid the spot market price for committing to be on standby. If load curtailments are required, they are paid the spot market energy price for doing so (Partovi, Nikzad, Mozafari, & Ranjbar, 2011).
2.6.1.2 Price based programs (PBP) or Time based programs (TBP) include:
Time of use pricing
Time of use (TOU) pricing programs are the basic type of PBP. These programs use any rate scheme that differs according to different blocks of time, whether by time of day or by season. The rate during peak periods is higher than the rate during off-peak periods. The simplest TOU rate has two time blocks: the on-peak period and the off-peak period (Gellings & Chamberlin, 1993; Tishler & Ye, 1993). The cost effectiveness of this program generally depends on three factors: the utilization amount of different customers, tariff characteristics such as the ratio of peak to off-peak prices and the length of the peak period, and the nature of the peak load (Hill, 1991). These pricing schemes are a key approach to DSM in most countries, and so they are widely used. Significant amounts of reduction in peak power and energy shortages have been achieved by the use of this tariff structure in a number of utilities (Shaikh & Dharme, 2009; Strbac, 2008).
Critical peak pricing (CPP) rates use a pre-specified price for higher electricity overlaid on TOU rates or normal flat rates. These are used during contingencies or when market conditions meet a pre-defined criteria, for a limited number of days or hours per year (Jazayeri et al., 2005). Customers participating in these programs are informed about the increase in price a day prior to the action. Empirical evidence for the efficacy of CPP can be found in a research conducted in California by (Herter, 2007). Herter observed an average 41% reduction in load was achieved over two hour hot-water CPP events when households were provided with sophisticated end-use controls. It was also observed that without the end-use controls, an average 13% reduction in load was achieved over five hour hot-water CPP events. A study by Faruqui and Sergici (2010) also supported this data. In the range of experiments they discussed, the CPP tariffs encouraged a drop in peak demand that ranged 13%−20%. When accompanied with enabling technologies, the reduction in peak demand is in the range of 27%− 44% (Faruqui & Sergici, 2010).
Extreme day pricing
Extreme day pricing (EDP) programs are similar to CPP except that the higher price for electricity is in effect for the whole 24 hours of the maximum number of critical days, which are known a day ahead.
Extreme day critical peak pricing
Extreme day critical peak pricing (EDCPP) is a variation of CPP in the sense that, CPP rates for peak and off-peak hours apply during extreme days, but there is no TOU pricing on the remaining days of the year.
Real-time pricing
costs in either real-time or on an as-requested basis. Customers plan their consumption for the day depending on the daily forecasts of hourly electricity prices provided to them by the utility (Aalami, et al., 2010a; Albadi & El-Saadany, 2008; Gellings & Chamberlin, 1993). In economic terms, real-time pricing shifts the demand from the peak periods and makes the demand price more elastic, and therefore, more balancing, with fewer supply-side adjustments.
2.6.2 Advantages of using demand response programs
The improved resource-efficiency resulting from greater interaction between power consumers and their suppliers can be considered the biggest advantage of demand response programs. The overall benefits of demand response can be categorized into the following four groups.
Participant financial benefits
All those who participate in the DR programs receive savings on their electric bill if they use less electric power during the peak periods. Customers participating in classical IBP programs can receive incentive payments for their participation, while those participating in the market-based IBP programs can receive payments according to their performance (Jazayeri, et al., 2005; USDOE, 2006).
Market-wide financial benefits
Due to the efficient utilization of electric power as a result of DR programs, a market-wide price reduction of electricity can be expected. This also results in lower demand for more costly power generation. Since the power can be utilized in a more efficient way, the cost of upgrades in the transmission and distribution infrastructure can be avoided. In turn, this can be reflected in the cost of electricity (USDOE, 2006).
Reliability benefits
minimize their own risk of having power interruptions or outages. These programs also provide more options and resources for the system operator to maintain the reliability of the system (Affonso & Silva, 2010; Goel, Qiuwei, Peng, & Yi, 2005).
Market performance benefits
Customers participating in DR programs have more choices in the market, even if there is no retail competition. Participants are able to manage their own usage since they have the opportunity to affect the market especially with the market-based programs and dynamic pricing programs. This has been the main driver for the DR programs, especially for large consumers, for a lot of the utilities. DR minimizes the ability of the main market players to exercise power in the electricity market. During the 2000−2001 California electricity crisis, it was reported that a 5% demand reduction could have resulted in a price reduction of 50%. This can be expected because the generation cost increases exponentially near maximum generation capacity. Hence, a huge reduction in generation cost can be achieved by a small reduction in the demand (Spees & Lave, 2007).
2.6.3 Voluntary demand response
Voluntary demand response (VDR) involves the end-user's participation in changing the amount of energy used by changing normal behavior patterns in order to achieve goals the end-user thinks are important. The power supplier provides information about the operation of the system to improve understanding of how end-use behavior impacts different factors, including carbon emissions, price and security of supply. VDR is a developing area of study with limited literature available on its application.
avoided transmission and distribution investment cost showed that the project could pay for itself after four years (Gyamfi & Krumdieck, 2012). The results of the Eco-living Program carried out in Singapore indicates that a combined use of leaflets and stickers to create awareness amongst consumers can reduce the average consumption by as much as 15.8% (He & Kua, 2013).
2.7 Energy audit and energy survey
The accuracy of an energy analysis depends on the amount of data that can be obtained and analyzed. Sufficient data for analysis can be obtained by carrying out an energy audit along with a detailed energy survey. This section describes how an energy audit and energy survey of a remote island energy system can be carried out.
2.7.1 Energy audit
An energy audit is an excellent tool for finding operational and equipment improvements that will conserve energy and minimize energy costs (Escrivá-Escrivá, Santamaria-Orts, & Mugarra-Llopis, 2012). It is a key tool in providing a systematic approach for decision making in the management of energy. In a broader perspective, an energy audit can be defined as a process to evaluate where energy is being consumed within a building or any other facility. It can identify the opportunities available for energy conservation (Capeheart & Spiller, 2004; Dall’O’, Speccher, & Bruni, 2012; Shen, Price, & Lu, 2012). Energy audits are subdivided in to three basic types or levels (Thumann & Younger, 2008).
Level 1 - "Walk-through Audit"
This is the basic starting point for any energy optimization process. It is a simple visual inspection of all the energy using systems in-order to obtain the general information. The process doesn't require many resources and is the least expensive level of auditing.
a walk-through energy audit.
1. Conduct a meeting with appropriate personnel to identify the areas where the auditors' attention should be focused during the audit.
2. Prepare a questionnaire and a checklist.
3. Send the questionnaire and the checklist to the place being audited atleast one week prior to the audit in order to allow sufficient time for the relevant person to get organized.
4. Form an energy audit team and train them in order to conduct the walkthrough energy audit. Each audit team should be accompanied by an expert auditor.
The most important feature of a walkthrough energy audit is that it creates a benchmark which can be later utilized by other sources for future analysis or study purposes (Saidur, et al., 2009; Zhu, 2006). A level-2 standard audit requires this benchmarking in order to carry out the detailed analysis of the facility.
Level 2 - "Standard or General Audit"
A Level 2 audit starts with the findings of the walk-through audit, and further evaluates the energy systems in detail. The standard or general audit will lead to the identification of potential energy efficiency improvements and significant conservation opportunities.
A standard audit requires data on energy usage profiles, utility bills and additional metering of any specific energy consuming systems (Kabir, Abubakar, & El-Nafaty, 2010). Detailed interviews with operating personnel are carried out for a better understanding of the systems. The Level 2 audit results in recommendations for improving the efficiency of operation and maintenance, as well as for hardware changes (Alajmi, 2012).
Level 3 - "Computer Simulation"