Acoustic Features of the Vocalisations of Two
Children Pre- and Post-Cochlear Implantation:
The Effects of Auditory Feedback
A thesis submitted in partial fulfilment
of the requirements of the degree of
Master of Audiology
By Simone Coyle
Department of Communication Disorders
University of Canterbury
Abstract
Acknowledgements
I would like to give sincere thanks to my thesis supervisor Professor Michael Robb of the Department of Speech and Language Therapy at the University of Canterbury. Thank you for your understanding and helping me through a challenging year.
I would also like to thank Professor Kathleen Wermke for providing the raw data, without which this thesis would not have been possible. It was a pleasure to meet you during your visit to New Zealand, and I valued the opportunity to experience your passion for the field of speech development.
Thank you to my classmates, the real MVPs, for their unfailing support throughout the rollercoaster of these years of study. I look forward to taking the next step of our professional lives with you all.
Table of Contents
ABSTRACT ... VII
ACKNOWLEDGEMENTS ... IX
TABLE OF CONTENTS ... XI
LIST OF FIGURES ... XIV
LIST OF TABLES ... XV
LIST OF ABBREVIATIONS... XVI
1 LITERATURE REVIEW ... 1
1.1 INTRODUCTION ... 1
1.1.1 Terminology. ... 1
1.2 COCHLEAR IMPLANTS:HISTORY AND DESIGN ... 2
1.3 AUDITORY FEEDBACK AND SPEECH PRODUCTION ... 4
1.4 THE DIVAMODEL OF SPEECH PRODUCTION ... 5
1.4.1 Alternatives to the DIVA model. ... 7
1.5 AUDITORY FEEDBACK AND HEARING IMPAIRED INFANTS ... 8
1.6 STAGES OF SPEECH DEVELOPMENT ... 9
1.7 ANATOMICAL DEVELOPMENT OF THE INFANT VOCAL TRACT ... 11
1.8 PAEDIATRIC AUDITORY STUDIES:EARLY IMPLANTATION AND SENSITIVE PERIODS ... 14
1.9 ACOUSTIC PARAMETERS OF THE INFANT VOICE ... 17
1.9.1 Fundamental frequency: development in normal hearing infants. ... 17
1.9.2 Fundamental frequency: development in hearing impaired infants. ... 19
1.9.3 Vocal duration: development in normal hearing infants. ... 20
1.9.4 Vocal duration: development in hearing impaired infants ... 21
1.9.5 Noise parameters: types of measures. ... 22
1.9.7 Noise: development in hearing impaired infants. ... 24
1.10 EFFECTS OF COCHLEAR IMPLANTATION ON ACOUSTIC PARAMETERS OF INFANT VOICE. ... 24
1.11 REVIEW OF THE LITERATURE ... 27
1.11.1 Literature limitations: experimental designs and analyses. ... 28
1.11.2 Evidence of auditory feedback within infant voice literature. ... 29
1.12 STATEMENT OF THE PROBLEM ... 30
1.13 STUDY HYPOTHESES ... 32
2 METHODOLOGY ... 33
2.1 PARTICIPANTS ... 33
2.1.1 Participant 1: AD... 33
2.1.2 Participant 2: AE. ... 34
2.2 DATA COLLECTION ... 35
2.3 DATA PROCESSING ... 35
2.4 DATA ANALYSIS ... 36
2.4.1 Duration. ... 37
2.4.2 Fundamental Frequency. ... 37
2.4.3 Noise. ... 40
2.4.4 Calculation of Noise Index. ... 42
3 RESULTS ... 43
3.1 CHILD AD ... 44
3.1.1 Duration. ... 44
3.1.2 Fundamental Frequency. ... 45
3.1.3 Noise Index. ... 46
3.2 CHILD AE ... 55
3.2.1 Duration. ... 55
3.2.2 Fundamental Frequency. ... 55
4 SUMMARY OF RESULTS ... 65
5 DISCUSSION ... 67
5.1 DURATION ... 68
5.2 FUNDAMENTAL FREQUENCY ... 73
5.3 NOISE INDEX ... 76
5.4 LIMITATIONS ... 81
6 CLINICAL IMPLICATIONS AND FUTURE DIRECTIONS ... 84
6.1 CLINICAL IMPLICATIONS ... 84
6.2 FUTURE DIRECTIONS FOR RESEARCH ... 85
7 SUMMARY AND CONCLUSIONS ... 87
List of Figures
Figure 1.1: The multiple parts of a cochlear implant ... 4
Figure 1.2. A simple schematic of the DIVA model of speech production ... 7
Figure 1.3. Stages of speech development in the first year of life ... 11
Figure 1.4. Anatomical differences between the infant and adult vocal tract ... 13
Figure 1.5. Anatomic and physiologic changes to the lungs and breathing system .... 14
Figure 1.6. Noncry fundamental frequency studies on normal hearing infants ... 19
Figure 2.1. Visualisation of the measurement of vocal segment duration ... 37
Figure 2.2. Example of pitch measurement in Praat ... 39
Figure 2.3: Spectrographic example of pitch shifts within a single vocal segment .... 40
Figure 2.4. Spectrographic example of subharmonics within a vocal segment ... 41
Figure 2.5. Spectrographic example of pulse register phonation ... 42
Figure 3.1. Distribution of vocalisation durations for child AD ... 49
Figure 3.2. Median duration of vocalisations produced by AD ... 50
Figure 3.3. Distribution of vocal segment f0 for child AD ... 51
Figure 3.4. Median f0 of vocalisations produced by AD ... 52
Figure 3.5. Distribution of vocalisation noise index (NI) for child AD ... 53
Figure 3.6. Median noise index (NI) of vocalisations produced by AD ... 54
Figure 3.7. Distribution of vocalisation duration for child AE during Phases 1-3 ... 59
Figure 3.8. Median durations of vocal segments produced by child AE ... 60
Figure 3.10. Median f0 of vocalisations produced by child AE ... 62
Figure 3.11. Distribution of NI values for child AE during Phases 1-3 ... 63
Figure 3.12. Median NI of vocalisations produced by child AE ... 64
List of Tables
List of Abbreviations
ABR Auditory brainstem response
CDAP Cask Data Application Platform
CI Cochlear implant
DAF Delayed auditory feedback
dB decibels
dB HL decibels Hearing Level
DIVA Directions In Velocities of Articulators
EHDI
Early Hearing Detection and Intervention
ENT Ear, Nose and Throat
f0 fundamental frequency
FDA Food and Drug Administration
fMRI
functional Magnetic Resonance Imaging
HA Hearing aid
HNR Harmonics to noise ratio
Hz Hertz
Md Median
MDVP Multidimensional Voice Program
ms Milliseconds
NH Normal hearing
NHR Noise to harmonics ratio
NI Noise index
OAE Oto-acoustic emissions
PET Positron Emission Tomography
s Seconds
SD Standard Deviation
TAF Transformed auditory feedback
USA United States of America
1 Literature Review
1.1 Introduction
This literature review aims to investigate the effects of restored auditory feedback on the vocal parameters of paediatric cochlear implantees. The literature on vocal analysis of cochlear implantees has largely focused on adults and older children, whilst the evidence regarding infants is neither complete nor consistent. First, the design and purpose of cochlear implants is summarised. Second, the concept of auditory feedback is introduced and
elaborated upon in terms of current models of speech production. This is related back to the importance of auditory feedback access for infant speech development. Of course, anatomical development plays a role in speech development as well, and these factors are highlighted. Next, the benefits of exploring the vocal development of hearing impaired infants through rehabilitation processes are explored, and the arguments for early cochlear implantation are noted. Acoustic parameters of infant voice are addressed, in terms of the literature on both normal hearing and hearing impaired infants. This review is limited to literature including the vocal parameters fundamental frequency, vocal duration, and noise proportions. Findings on the effects of infant cochlear implantation with regards to these vocal parameters are
highlighted, and finally conclusions are drawn to note the limitations of these studies. From this conclusion, a current research question is produced and hypotheses are drawn regarding the available vocal data of two infants undergoing cochlear implantation.
1.1.1 Terminology. It is firstly necessary to clarify some broad terms used in this
progress from the first year to the second year of life during longitudinal analyses. As this
thesis explores the vocal analysis of two toddlers who are at speech development stages of an infant, the swapping between terms is sometimes necessary; however accurate descriptors have been used where possible.
There are also various terms to describe people with hearing loss, such as deaf, Deaf, hard of hearing, and hearing impaired. (Luey, Glass, & Elliott, 1995). Deaf written with a capital ‘d’ generally represents individuals who identify with the Deaf community and Deaf culture. The children in this report are too young to identify with a culture and so this term has not been used. Hard of hearing often refers to people who communicate via speech and have anywhere from a mild to severe hearing loss. Again, this term is used infrequently with preverbal and congenitally deaf children. The term ‘hearing impaired’ has been a popular phrase in the past but is now becoming less commonplace. However this expression is still regularly referred to in literature, and so has been used here when the original report has also done so. Lastly, ‘deaf’ with a lower case ‘d’ generally describes someone with a severe to profound hearing loss, who largely communicates with hearing people (using speech) and associates with the hearing culture (Luey et al., 1995). The cochlear implanted children referred to in this literature review are generally born to hearing parents, and also present with very severe to profound hearing losses. Therefore the terms ‘deaf’ and ‘hearing impaired’ are used interchangeably to describe them.
1.2 Cochlear Implants: History and Design
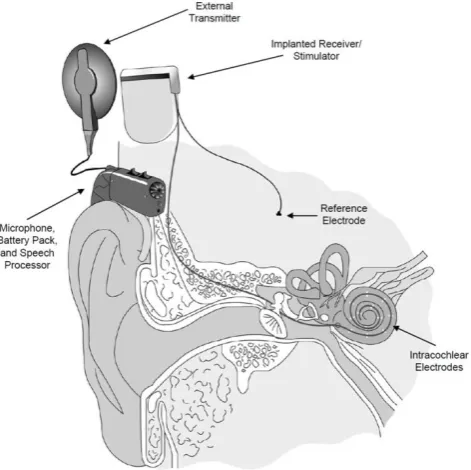
the temporal bone of the skull (Patrick & Clark, 1991; Wilson & Dorman, 2008). As shown
in Figure 1.1, a speech processor (microphone) is worn behind the ear and
electromagnetically transmits sounds to the receiver, which transforms the information into an electrical signal that is used to stimulate the corresponding areas of the auditory nerve. CIs therefore function to improve the hearing abilities of individuals with severe
sensorineural losses, as they allow auditory information to bypass any cochlear and inner ear damage.
Figure 1.1: The multiple parts of a cochlear implant. External components pick up sound
(speech) information and transmit this to the implanted components, which electrically stimulate the auditory nerve. Reprinted from Wilson and Dorman (2008, p. 34)
1.3 Auditory Feedback and Speech Production
Auditory feedback describes one of the mechanisms by which an individual moderates his or her own voice. The phenomenon was first investigated by Lee (1950a,), who found that playing a delayed version of a person’s own voice could cause the subject to develop a stutter, raise the pitch or amplitude of their voice, and slow their speaking rate. The effects of time-delayed auditory feedback (DAF) on speech production continued to be investigated into the following decades, with particular emphasis on the technique’s ability to treat speech disorders such as stuttering (Borsel, Reunes, & Bergh, 2003; Fairbanks &
(Andrade & Juste, 2011; Ingham, 1993). As DAF became well-researched, so did the vocal
response of pitch-transformed auditory feedback (TAF). Multiple studies have confirmed the parallel change to a speaker’s pitch in response to an increase or decrease of the feedback’s pitch (Burnett, Senner, & Larson, 1997; Larson, Burnett, Kiran, & Hain, 2000).
More recently, functional magnetic resonance imaging (fMRI) and positron emission tomography (PET) technologies have allowed for the investigation of neural areas implicated in auditory feedback control. Tourville, Reilly, and Guenther (2008) demonstrated the
activation of a neural pathway between auditory error cells in the somatosensory cortex (temporo-parietal region) and corrective articulator motor areas in the frontal lobes in response to pitch-shifted auditory feedback. Error cells are auditory neurons which detect mismatches between the expected outgoing auditory signal and the consequent incoming signal. The resulting activation of speech motor cells indicates the presence of corrective activations which send commands to the speech articulators following this mismatch. Comparable studies by Toyomura et al. (2007) and Parkinson et al. (2012) found similar pathways of activation, again with TAF. The former concluded that feedback control of pitch is dominated by the right hemisphere whilst the latter provided further evidence of the role of auditory error cells. Yet more analyses have demonstrated activation of these error cells by DAF, an effect not seen with normal rate, non-delayed feedback (Hashimoto & Sakai, 2003; Takaso, Eisner, Wise, & Scott, 2010). As Tourville et al. (2008) describe, these findings support the DIVA model of speech production.
1.4 The DIVA Model of Speech Production
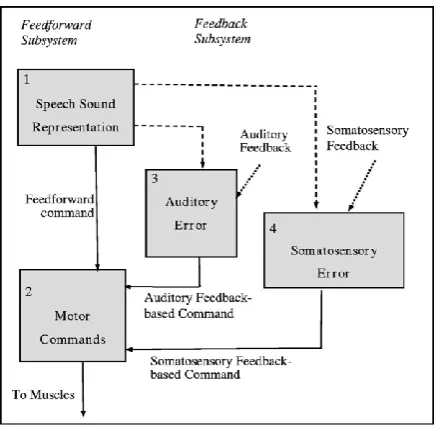
commands are controlled by sound map cells which are in turn activated by either
feedforward or feedback control subsystems (Guenther & Hickok, 2015). Feedback is divided into two types, known as the auditory feedback control subsystem (neural pathways
providing the sound map cells with information on what the subject hears) and the somatosensory feedback control subsystem (providing kinaesthetic and proprioceptive information on speech articulators/the vocal tract) (Guenther, 2006). The feedback subsystems therefore facilitate comparisons between output and input signals, whilst the feedforward system sends action commands directly from the premotor and primary motor cortices, as illustrated by Figure 1.2.
The DIVA model is regarded as flexible, and is periodically modified to incorporate the findings of new research. The first version was proposed in the 1990s and updated
still able to produce intelligible speech (albeit with some deviations) after many years of
[image:21.595.207.427.173.386.2]limited auditory feedback (Perkell et al., 1997).
Figure 1.2. A simple schematic of the DIVA model of speech production. Cortical neurons
are represented by boxes. Dashed lines represent the path of expected sensory signals (projections from the premotor to sensory cortices), dotted lines show afferent information projecting to the sensory cortex, and solid lines indicate efferent information which controls motor movements. Reprinted from Lane et al. (2005, p. 1638)
1.4.1 Alternatives to the DIVA model. Although the DIVA model is advocated by many researchers, some propose variations on these mechanisms of speech production. For
model. Hickok, Houde, and Rong (2011) built upon Larson and colleague’s notions but give
more emphasis to the feedforward subsystems, particularly in regards to activation of the error cells. Parkinson et al. (2012) highlighted the shortcomings of the DIVA model by assessing how it is interpreted. They argued that the DIVA model aims to conceptualise the control of vocalisation and phonation – i.e. the voice itself – whereas the control of speech is likely to require feedback of a greater degree and complexity than this model is able to represent.
Fundamentally however, all models share the same principal characteristics – a combination of (auditory and kinaesthetic) feedback and sensorimotor feedforward pathways. The growing literature and evidence base appears to only be increasing the similarities
between the models. This is demonstrated by the addition of a kinaesthetic feedback loop to the forward model by Larson et al. (2008), just as is described in the DIVA model (Tourville et al., 2008).
1.5 Auditory Feedback and Hearing Impaired Infants
With these models in mind, the importance of auditory feedback in speech development is clear. Early studies using delayed auditory feedback on newborn cries discovered that cry duration decreased with increased DAF (Cullen, Fargo, Chase, & Baker, 1968). In contrast, the duration of words for children over the age of two years increased with DAF (Siegel, Fehst, Garber, & Pick, 1980). Further analyses indicated that the effect for children over two years was consistent, but not for those younger (Belmore, Kewley-Port, Mobley, & Goodman, 1973). This suggested that auditory feedback may play a different role in speech control after the acquirement of language, compared to pre-speech development.
Hammerschmidt, Jürgens, & Zwirner, 2004, 2006). One study of preverbal vocalisations
found that the amount and structure of simple single noncry vocalisations produced was unaffected by hearing ability, whilst vocal sequences (i.e. babbling) were significantly less frequent overall for hearing impaired (HI) infants when compared to those with normal hearing (NH) (Scheiner et al., 2006). Although severely hearing impaired infants may be provided with hearing aids at an early age, the development of babbling is often much later than normal hearing infants – if it develops at all (Iyer & Oller, 2008; Scheiner et al., 2004). This indicates the great significance of sufficient auditory feedback in the development of speech, particularly in achieving the babbling stage at a normal developmental rate.
There is also evidence that cochlear implants provide restoration of auditory feedback. For example, cochlear implanted children appear to show similar responses to DAF as normal hearing children (Tye‐Murray, 1992), as well as display faster development of babbling than unimplanted deaf children (Colletti et al., 2005; Schauwers, Gillis, Daemers, De
Beukelaer, & Govaerts, 2004). Furthermore, studies on the rapid emergence of babbling after the acquirement of auditory feedback through CIs indicate that CIs are crucial aids to
encourage infant vocal exploration and the subsequent development of babbling (Fagan, 2014, 2015).
1.6 Stages of Speech Development
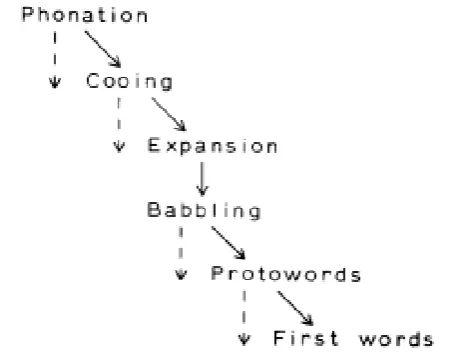
Kent and Murray (1982) and Oller, Eilers, Neal, and Schwartz (1999) give concise overviews of the stages of infant phonation development over the first year of life. Kent and Murray (1982) reasoned that although disputes still arise on the identification and exact timing of these stages, the overall sequence of events was well-accepted worldwide (an example of which is shown in Figure 1.3). This notion still holds true today, with most
normal vocal development begins with a phonation stage, characterised by the production of
quasivowels and glottal sounds which ends at about two months of age. This is followed by cooing, otherwise known as a primitive articulation stage when the infant first learns
articulation movements. The cooing stage is characterised by an increase in the amount of vocalisations produced, as well as an increase in the variation of the sounds (Scheiner, Hammerschmidt, Jürgens, & Zwirner, 2002). Cooing develops into the expansion stage by eight months of age, when vowel and consonant sounds become more developed and begin to be used together (also known as vocal play). Vocal play also involves the introduction of new sounds to the infant’s repertoire, such as squeals, growls, raspberries, yells, and more. This stage is when infants being to truly explore the types of vocalisations they are able to produce (Stark, 1981). Expansion leads towards babbling (reduplicated or canonical babbling)
between five and ten months of age as the vowel and consonant sounds are combined in sequences to create syllables. Finally the infant produces protowords, followed by the first meaningful spoken words emerging around 10-18 months of age (Kuhl & Meltzoff, 1996).
As described by Oller et al. (1999), these speech studies do not generally include sounds which they term ‘fixed vocal signals’ (p. 225) such as laughs or cries, nor vegetative sounds. In the past these sounds have not been regarded as representative of speech and language development in the same way as nonfixed vocal signals, and are more often used to investigate topics relating to pathologies or the health status of infants (Chittora, 2016; Kheddache, 2015, Rothganger, 2003). Nevertheless, some studies have related cry
development to that of speech and language (Fuamenya, Robb, & Wermke, 2015; Mampe, Friederici, Christophe, & Wermke, 2009).
suggests, auditory feedback has been found to have a crucial effect on the timely
[image:25.595.198.435.147.327.2]development of speech and language (particularly from the babble stage onwards).
Figure 1.3. Stages of speech development in the first year of life, the dashed lines represent
the possible retention of earlier vocal behaviours, even as the infant enters successive stages. Reprinted from Kent and Murray (1982, p. 361)
1.7 Anatomical Development of the Infant Vocal Tract
which consequently vibrate, each cavity’s variable shape changes the air flow’s resonance,
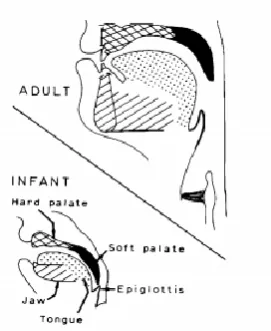
which influences the acoustic qualities of the vocalisation. Each cavity is smaller and shorter in infants, with the entire vocal tract lengthening more than twice over by adulthood at uneven rates between the structures (Vorperian et al., 2009). One such example is that the infant pharyngeal cavity is shorter with respect to the rest of the tract, but grows
proportionately more during development (Kent & Murray, 1982). This lengthening decreases the frequency of the infant’s vocalisations, as described by the acoustic theory (Fant, 1971). The angle of the oropharyngeal bend also changes, becoming almost 90° by adulthood (Mugitani & Hiroya, 2012). At around four to six months of age the infant’s voice becomes more resonant due to changes in the velum and epiglottis (structures of the soft palate) which reduces the nasality of vocalisations (Sasaki, Levine, Laitman, & Crelin, 1977). These physical changes are collectively illustrated in Figure 1.4.
On a cellular level, the structure of paediatric vocal folds is also notably different to that of adults (Hartnick, Rehbar, & Prasad, 2005). In young infancy, this begins as a
monolayer of cells and develops into a bilayer by around five months of age (Boseley & Hartnick, 2006). By the time a child reaches seven years old a third layer forms and the structure resembles fully developed adult vocal cords. The cricothyroid muscle of the larynx aids in the tension of the vocal folds and comprises a larger proportion of the laryngeal muscles in infants than in adults (Kahane & Kahn, 1984). Although gender differences exist in the structure of adult vocal tracts, these do not begin to appear until at least three years of age (Vorperian et al., 2011).
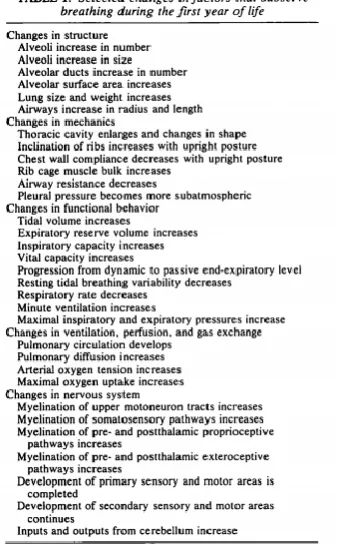
reorganisation and myelination of the central nervous system also influence infant sound
production. A more list of these factors is depicted in Figure 1.5.
[image:27.595.248.384.322.488.2]Although anatomical maturation surely plays a role in the large variability and changes depicted in paediatric acoustic studies, Vorperian et al. (2009) note that most of the developmental changes have been attributed to increased speech motor and neuromuscular control (i.e. the refinement of the neural pathways noted in the DIVA model), rather than the sheer size and shape of the cavities.
Figure 1.4. Anatomical differences between the infant and adult vocal tract. Reprinted from
Figure 1.5. Anatomic and physiologic changes to the lungs and breathing system, which may
play a role in infant vocal development. Reprinted from Boliek, Hixon, Watson, and Morgan (1996, p. 2)
1.8 Paediatric Auditory Studies: Early Implantation and Sensitive Periods
Although many studies attempt to make clarifications regarding the effect of deafness or auditory deprivation on infant development (and therefore, the converse process of
auditory development with appropriate sensory stimulation), our current knowledge of
it can be assumed that prior to implant activation, their access to audition is low. This
assumption relates to a common candidacy criterion for infant cochlear implantation – individuals need to be confirmed to derive insufficient benefit from hearing aids for appropriate speech and language development, as evidenced by audiometric results or the absence of related developmental milestones (Bradham & Jones, 2008; Cohen, 2004; 2018).
Therefore even if hearing aids are worn prior to CI activation, the children’s acquired auditory access from aids can be deemed small, supported by literature reviews which show deaf children gain more speech and language benefit from CIs than HAs (Bittencourt, Torre, Bento, Tsuji, & Brito, 2012; Bond et al., 2009). With this in mind, the activation of cochlear implants is most often considered the key event in restoring audition, and most studies on the effects of auditory feedback in cochlear implantation do not consider the prior wearing of aids at all.
month of age, follow-up evaluations for non-passed screenings by 3 months of age, and
infants with confirmed hearing losses should be given appropriate intervention by 6 months of age. Yoshinaga-Itano and colleagues recently completed a follow-up study to her
prominent 1998 work on the benefits of early intervention, which showed that adherence to these guidelines is successful in providing improved vocabulary outcomes (Yoshinaga-Itano, Sedey, Wiggin, & Chung, 2017).
With this research in mind, literature supports the benefits of early cochlear implantation, so long as it is medically appropriate to carry out the surgery. Extensive evidence shows that if auditory feedback is restored during the sensitive period of the auditory system (or as young as possible), (s)he is more likely to catch up to the
developmental level of his/her normal hearing peers – particularly in regards to reaching the canonical babble stage (Colletti et al., 2005; Grant, Cheng, & Niparko, 1999; Sharma, Dorman, & Spahr, 2002; Sharma, Spahr, Dorman, & Todd, 2002). A sensitive period is the time frame in which a sensory system undergoes rapid neurological development, often occurring in infancy and young childhood (White, Hutka, Williams, & Moreno, 2013). Because cortical reorganisation, myelination, and neural synapse strengthening are occurring at an accelerated pace during this time, it is important for the system in question to be
adequately stimulated in order for full functioning in the future. For the speech-motor system, this entails gaining access to a wide range of auditory and somatosensory sensations in order to develop vocal motor control, as well as speech and auditory processing abilities
1.9 Acoustic Parameters of the Infant Voice
Many parameters have been used in the literature to assess speech development as well as differences between that of deaf and normal hearing children. This review has been refined to focus on three of these parameters: fundamental frequency, noise, and duration. Therefore the papers chosen here for review are those which are able to provide some information on these acoustic features. As these measures are usually taken to compare features pre- and post-intervention for HI children, most literature concerning infants with hearing loss has been included in the section on the effects of CI on voice.
1.9.1 Fundamental frequency: development in normal hearing infants.
Fundamental frequency (f0) describes the lowest frequency band found within a certain sound signal, and is analogous to the perception of pitch. According to the acoustic theory and source filter models of speech production, this characteristic is related to the laryngeal tone of the vocal tract; i.e. the taughtness of the vocal folds in response to the contraction of the laryngeal muscles (Fant, 1971). It is clear from the history of auditory feedback studies that control and development of f0 is somewhat dependent on auditory feedback, although anatomical changes to the vocal tract and vocal cords also play a role (Larson, 1998; Mugitani & Hiroya, 2012). In particular, the physical development between ages 2-3 years have been indicated in f0 values (Mugitani & Hiroya, 2012).
and Robb (1996) show the opposite effect – a parallel increase in age and f0 that was
suggested to be related to the development of intentionality within cries over the first year.
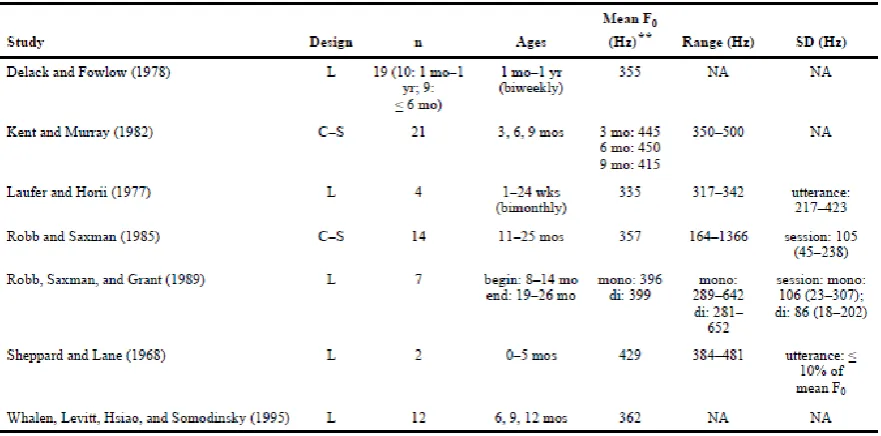
Young infant noncry data are less common in the literature, but a concise overview of created by Iyer and Oller (2008), and has been reproduced in Figure 1.6. This summary highlights the amount of variation that has been identified between each study (but also within each study; subject-to-subject and vocalisation-to-vocalisation). The noted papers investigated f0 of typically developing infants at varying ages until approximately 2 years of age. Mean f0 values were measured between 335 Hz by Laufer and Horii (1977) and 450 Hz by Kent and Murray (1982). As Iyer and Oller (2008) hypothesise, this may be due to both the age range of the studies but also the procedural methods undertaken, such as which vocalisations were included for analysis. These studies showed either a decrease or no change to mean f0 with an increase in age. Again, procedural variations such as the longitudinal nature of some studies were thought to affect whether f0 patterns were observed. Kent and Murray (1982) noted a particular decrease in f0 between six and nine months of age. The conclusions of the investigation by Iyer and Oller showed that age-matching deaf and normal hearing infants resulted in a significant difference between mean f0 values; however
matching the groups by their stages of vocal development gave no statistically significant difference. As deaf infants are known to show slower vocal development than their NH peers, this analysis is of particular note.
Nakatani, and Kondo (2006) described that the mean vocal f0 decreased over the first five
[image:33.595.84.525.166.384.2]years of life of three children, but did not give f0 values.
Figure 1.6. Noncry fundamental frequency studies on normal hearing infants. Reprinted from
Iyer and Oller (2008, p. 918)
infants (average 368.5 Hz for deaf infants versus 354.9 Hz for normal hearing infants) until
13.5 months of age, but the difference was not statistically significant.
Studies of older children with hearing loss are generally less variable than their infant counterparts, showing more examples of atypical vocal profiles with high f0, although this is still far from consistent (Higgins, McCleary, Ide-Helvie, & Carney, 2005; Ryalls &
Larouche, 1992).
From these studies, it can de determined that in normal hearing infants, f0 tends to decrease with age. Deaf infants generally exhibit f0 values that are higher or no different to that of normal hearing infants.
1.9.3 Vocal duration: development in normal hearing infants. Duration describes the length of vocalisations produced by an infant. Before the development of speech, this is usually measured by the onset and offset of voice during a single expiration (Fuamenya et al., 2015). Fuamenya et al. (2015) investigated the cries of 20 normal-hearing infants over the first three months of life. Cry duration showed a significant increase between months 1 and 2, which was sustained for month 3. The authors suggest this change may be due to the increase in respiratory lung volume at this age, as well as the increase in neurological control within the speech-motor system. Kent and Murray (1982) found the typical vocal duration of NH infants at 3,6, and 9 months of age to be less than 400ms, although histograms presented show the duration distributions to become more skewed to the right as the infants age. Robb and Saxman (1988) Kubaska and Keating (1981) investigated word duration in three NH infant’s speech who were between 15 and 35 months old. Speech samples of word durations were taken every fortnight and showed that although some single words decreased in duration but the majority did not. The authors acknowledge that once a child is able to produce
(1995) found that the mean word duration of seven NH children aged between 8 and 26
months decreased, whilst the mean duration of nonword vocalisations (those which could not be likened to words by auditory analysis) did not change. Lyakso and Grigor’ev (2015) also found a decrease in duration of vowel-like utterances of 115 NH children between 3 and 9 months of age.
1.9.4 Vocal duration: development in hearing impaired infants The sequence of studies by Van Den Dikkenberg-Pot et al. (1998) on deaf infant speech development found interesting results in regards to duration: from 8.5-10.5 months of age, deaf infants begin to increase the duration of their vocalisations. This was hypothesised to be related to the relative complexity of the sounds, as they also noted changes to phonation. In contrast, infants with normal hearing displayed an increase in duration between 6.5-8.5 months as they entered the babbling phase, but then consistently exhibited a decrease in duration as they moved towards producing protowords and further speech development. These divergences lead to a
statistically significant difference between the two groups from ages 10.5 months to 16.5 months. Again this was noted to be potentially related to the relative complexity of word production, compared to canonical babble. Over the 18 month period, the average duration of vocalisation by deaf infants was 996.7ms compared to 883.3ms for normal hearing infants.
1.9.5 Noise parameters: types of measures. Speech noise is described as segments of vocalisations which are aperiodic in nature, with irregular vibrations and no discernible pitch (f0). These characteristics arise when the vocal folds vibrate in an irregular manner (Buder, Chorna, Oller, & Robinson, 2008). The literature takes note of several variations of noise measures, which are very similar but with some important points of difference. In general, all measures give an indication of the ‘roughness’ of a vocalisation.
The most commonly used measure is harmonics to noise ratio (HNR). This is calculated by measuring the total duration of harmonicity in the vocalisation, and dividing this by the duration of aperiodicity (Hocevar-Boltezar et al., 2006). Conversely, noise to harmonic ratio (NHR) also features – the inverse of HNR. These measures are carried out on individual vocalisations, and then an average is often taken per session or condition. Another measure of noise is the noise index, as described by Fuamenya et al. (2015). In this technique, the authors used the sum of noise over a total recording session, and divided this by the sum of periodicity of the same session. The noise index therefore calculated as one measurement per session, rather than the average of multiple calculations per session. However as noted in Fuamenya et al. (2015) (and outlined below) the noise index of each session was in fact summed and averaged for each month of recording. Therefore, the noise index could be thought of as essentially analogous to the NHR in previous studies.
Noise measurements are able to be taken from a variety of vocal samples; however
the most commonly used method in paediatric studies is the production of the sustained vowel /a/. This is often chosen because it is easy for most young children to articulate,
regardless of their level of speech development. An example of the way in which children are asked to make this sound was described by Maturo et al. (2012, p. 957); “Subjects were asked to sustain the phrase “ah” at a comfortable pitch and volume using a normal speaking voice for over 4 seconds. After 3 rounds of practice, the fourth production of “ah” was recorded”. Noise studies of early infancy use spontaneous vocalisations such as cries or coos, instead of an intentionally produced sound.
1.9.6 Noise: development in normal hearing infants. Fuamenya et al. (2015)
investigated the cries of 20 normal-hearing infants over the first three months of life using the measure of noise index. Over the three months, mean noise index showed a significant
decrease from 0.2 in month 1 to 0.08 in month 3. The authors postulate these changes are due to both neural and anatomical changes, demonstrating the ‘fine-tuning’ of phonation
development. Maturo et al. (2012) investigated the acoustic features of 335 children between four and 18 years of age in order to establish a normative acoustic database for children. The data for males and females was assessed separately, and the average NHRs of a sustained ‘ah’ vocalisation for the 14 girls and 12 boys who were four years old were both 0.12 (SD = 0.03 and SD = 0.02 respectively). Overall, the average NHR between 4 years and 18 years was 0.11 (SD = 0.02) for girls and 0.12 (SD = 0.03) for boys. The authors note that these values are similar to previous acoustic databases which include the NHR of paediatric voices (Campisi et al., 2005; Tavares, Labio, & Martins, 2010). They also quote the CSL
respectively, whilst Campisi et al. (2005) found the average NHR of /a/ for 50 males and 50
females aged 4-18 years old to be 0.11 (SD = 0.002).
Scheiner et al. (2002) examined preverbal vocalisations of seven normal hearing infants in the first year of life. Although no values were stated, the harmonic to noise (HNR) ratio was said to increase over the period for all types of vocalisations – i.e. the amount of noise in each sample decreased. This was postulated to be due to the strengthening of speech motor control systems. Robb and Saxman (1988) did not measure noisiness directly, but noted that 6% of the noncry samples from 14 NH children aged 11-25 months contained elements perceived to be harsh (such as biphonation, harmonic doubling and f0 shifts).
1.9.7 Noise: development in hearing impaired infants. Dehqan and Scherer (2011) assessed 14 boys with profound hearing losses who wore hearing aids (5-6.75 years old). Measuring /a/, they found a lower HNR (i.e. higher noise ratio) for these boys when
compared to their normal hearing peers. This suggests poor laryngeal muscle control, but also that hearing aids may not supply adequate auditory feedback for profound losses.
1.10 Effects of cochlear implantation on acoustic parameters of infant voice.
As expected, many researchers have investigated the effects of CI on vocal
presence and direction of any change seen after implant activation. However the exact
parameter values given by these papers are less significant.
Most studies on the effects of CI in children use a non-randomised, pre/post intervention design, taking measures before and after CI activation. Hocevar-Baltezar and colleagues produced two papers in succession of the effects of CI on children’s’ voices (Hocevar-Boltezar et al., 2006; Hocevar-Boltezar, Vatovec, Gros, & Zargi, 2005). Both studies included CI effects on mean vocal f0 and NHR before and after implant activation, using the sustained vowel /a/. The first involved 31 children (mean age 6.24 years) who were assessed pre-CI and 2, 12, and 24 months post-activation. They found a significant
improvement in NHR, and although mean f0 decreased over time, the effect was not
significant by the 24 month follow up (Hocevar-Boltezar et al., 2005). Overall, the children implanted before the age of four years showed significant improvements in NHR whereas those implanted after showed significant improvements to f0. The second study compared prelingually deaf children (mean age 5.89 years) to postlingually deaf adults, pre-CI activation and 6 months later. F0 showed no significant improvement in either group, however mean NHR decreased from 0.17 to 0.14 in the children (and showed no change in adults) (Hocevar-Boltezar et al., 2006). The authors theorised that the use of the sustained vowel /a/ instead of standard speech samples may have contributed to the lack of observable change to f0; other authors have also found varying results using /a/.
between 6 months and 2 years. This study analysed the habitual fundamental frequency
(HFF) of vowels /a/, /i/ and /u/ and found that the 6 month CI user group fell outside the HFF norms (average HFF of /a/ = 315Hz), whilst the CI users of 2 years approximated norms (average HFF of /a/ = 266Hz). Paediatric norms were stated as 240-280Hz.
Wang et al. (2017) followed 30 children who received cochlear implants between four and six years old for 24 months after implantation. They found that prior to implantation, the f0 of deaf children was significantly higher than that of their normal hearing, age-matched peers. F0 slowly decreased after CI activation and reached levels close to the normal hearing children after 24 months. The normalisation of acoustic parameters after CI use is supported by de Souza, Bevilacqua, Brasolotto, and Coelho (2012), as well as Seifert et al. (2002) who albeit only found a significant deviation from normal f0 values for children implanted after 4 years of age.
Less investigations have been carried out on CI’s effect on vocal duration, however an excerpt from a recent presentation found the duration of isolated vowels in two young CI recipients (under 2 years of age) to be longer than that of their normal hearing peers (Binos, 2017, September 21-22). These children were followed for 6 months after CI activation. Shorter vowel durations were associated with greater development of vocal abilities;
therefore the findings indicate a weakness for CI’s performance. Another study showed that four deaf children of 9-14 years, who had been CI users for 2-4 years, exhibited longer speaking durations (via sentence speech analysis) than sex- and age-matched peers, but their vocal pitch was not significantly different from normal (Perrin, Berger-Vachon,
months). Mean vocalisation duration for the deaf infants was 0.633s pre-CI and 0.791s
post-CI. In comparison, normal hearing infants vocalised for a mean duration of 0.573s at the first time point, and 0.623s at the second. Although no statistical significance was found, the data does indicate a slight increase in vocal duration for both groups, however CI infants produced longer vocalisations both before and after implantation compared to NH peers. Jafari et al. (2017) compared /a/ f0 and vowel duration between children (mean age 72 months) wearing hearing aids, CIs, and those with normal hearing to find that the f0 of the HA group was significantly higher than NH children. No statistical significance was shown between the f0 of CI and NH children. In contrast, no difference was found in vowel duration between HA and CI, but both groups showed significantly longer vowel durations than their NH peers.
Poissant, Peters, and Robb (2006) employed a different approach to investigating the effects of CI – by measuring the voice of six HI children (average age 7 years, average CI use 2.8 years) with the CI in on/off positions. The f0 of monosyllabic speech words was
significantly higher for most children when the CI was turned off, although two children showed the opposite pattern. However this finding shows HI children still somewhat rely on auditory feedback through the CI for pitch control. An earlier, smaller study using older children with CIs (11-14 years old) showed differing results, with the average voice f0 slightly increasing when the implant was switched off (Fourcin, Abberton, Richardson, & Shaw, 2011).
1.11 Review of the Literature
the varying ages of the infants, different treatment of the data (such as inclusion/exclusion
criteria), and variations on definitions used for each parameter, as well as the measuring methods undertaken, as Iyer and Oller (2008) addressed. Iyer and Oller approached these limitations from the perspective of noncry f0 studies, but the same critiques can be applied across the field of infant acoustic analysis.
1.11.1Literature limitations: experimental designs and analyses. The investigations on the voice of NH and HI infants show how age and physiological development affect vocalisations, both with and without the presence of auditory feedback. These confounding factors, such as size and shape of the vocal tract as well as cognitive ability add difficulty to comparing studies of differently aged infants. Investigations such as Hocevar-Boltezar et al. (2005) use a pre- and post-intervention design which reduces the amount of confounding factors, but the paediatric population they assessed was around 6 years old – much older than many children currently undergoing cochlear implantation (James & Papsin, 2004).
Therefore, comprehensive evidence of CI vocal effects on young infants is still missing from the literature.
In order to measure an acoustic parameter, each team of researchers must decide upon a definition of their measurement as well as inclusion/exclusion criteria. As Iyer and Oller (2008) describe, for f0 this may include a minimum or maximum f0 value in order to be included in the analysis. For example, those studies which exclude squeals will very likely conclude with lower mean f0 values than studies which do include squeals; likewise the minimum length of vocalisations that were measured may affect the results. The same can be said for noise measurements, when it is up to each researcher to define what counts as ‘noise’ in a sample. These aspects of analysis are often not explained in detail, if at all, in the
‘noise’ or how this was assessed. The lack of procedural specifications makes it extremely
difficult to compare data and give generalised comments on multiple papers.
The procedure of taking measurements and describing these features is particularly important in the analysis of infants and young children, because the amount of possible variation for each definition and method increases as the child ages. Very young infants are generally unable to produce intentional sounds, and so studies focus on spontaneous
vocalisations; for example Campisi et al. (2002). As their development increases, many studies opt for the sustained vowel /a/, which has the advantage of being able to be produced by relatively young infants as well as being more dependent on acoustic feedback rather than orosensitive control (Campisi et al., 2005). However, some older studies on school-aged children use speech samples, for example the reading of a text passage or list of words (Poissant et al., 2006), which could give quite different results to a sustained vowel sound.
As previously mentioned, the underlining ethical boundaries of investigating infant development are crucial factors in the variation of results. Research and academic studies are not able to control the age at which children undergo cochlear implantation, and there is no way to feasibly regulate the amount of previous auditory stimulation via hearing aids as well as numerous other factors which may impact their vocal development.
1.11.2Evidence of auditory feedback within infant voice literature. Literature on auditory feedback effects and the infant voice are still somewhat disconnected. Well established speech models such as DIVA exist, which place great emphasis on auditory feedback in development (Tourville & Guenther, 2011). There are also several studies on the differences between NH and HI vocal development (Maturo et al., 2012; Van Den
essentially vocal ‘snapshots’ before and after implantation (although there maybe be several
snapshots post-CI, e.g. Hocevar-Boltezar et al. (2005). It is likely that some acoustic changes can occur in a much shorter time frame than these studies represent. This may be partly due to the relatively recent introduction of implantations for infants under one year of age, but also a lack of appropriate data in order to facilitate valid analyses. To ideally study the impact of auditory feedback on voice, the infants need to be old enough to produce well developed vocalisations (albeit with deviations from the norm), have had extremely limited past access to auditory feedback, be chronologically within the sensitive period of audiological
development as well as be independently undergoing cochlear implantation that can be closely followed.
1.12 Statement of the Problem
Many of the aforementioned studies provide useful information on the acoustic features of children’s speech following CI activation and provide some evidence of the effect of auditory feedback on infant vocal development. Nevertheless there remain few reports which investigate young infant vocal changes before, during, and after speech on a
prolonged near-full auditory deprivation to auditory stimulation (as complete as is currently
possible) with the activation of the CIs.
1.13 Study Hypotheses
1.
H1: Duration of vocalisations decreases upon CI activation H0: Duration of vocalisations do not decrease upon CI activation
2.
H1: Vocalisation f0 decreases upon CI activation
H0: Vocalisation f0 does not decrease upon CI activation
3.
H1:Noise Index decreases upon CI activation
H0:Noise Index does not decrease upon CI activation
4.
H1: The pattern of variation of these acoustic parameters will be at a stable baseline prior to CI, and increase post-switch on.
2 Methodology
The data for this study consisted of vocal recordings from two toddlers, which had been previously gathered by the Centre for Pre-Speech Development & Developmental Disorders at the University of Würzburg (Germany), under the direction of Prof. Kathleen Wermke. The speech recordings and corresponding spectrographic images were a part of the Centre’s acoustic database of pre-linguistic and early linguistic development in children. Prof. Wermke provided the processed speech recordings and spectrographic images, as well as the methodological information on data collection detailed below. At the time of data collection, approval was given from the Ethics Committee of the University of Würzburg (Approval number 143/04).
2.1 Participants
Vocal recordings from four toddlers were provided by Prof. Wermke. The data of two toddlers were discounted from this analysis as there was deemed to be an insufficient amount of vocalisations recorded either pre- or post-cochlear implantation. The recordings for the remaining two toddlers covered at least 3 weeks of the pre-implantation and post-switch on stages, as well as the interim period between implantation surgery and CI switch-on. Both toddlers were admitted to the otolaryngology clinic at the University of Würzburg (Klinik und Poliklinik für Hals-, Nasen-, und Ohrenkrankheiten, plastische und ästhetische
Operationen, Universitätsklinikum Würzburg) and underwent cochlear implantation between February 2004 and September 2005. They both presented with congenital, bilateral profound sensorineural hearing losses with negative histories of metabolic disease, cognitive
impairment or multiple disabilities.
The results of the ABR showed no response to sounds up to 90dB HL in the right ear and no
response to sounds up to 100dB HL in the left ear. This indicates AD was born with a profound bilateral sensorineural hearing loss, with the cause attributed to hereditary disease. He was provided with bilateral hearing aids at 80 days (2.5 months) old, however his mother reported that he did not readily accept these and she did not notice any behavioural changes when he wore them. For these reasons, his mother did not believe the hearing aids were providing benefit to her son, and AD wore the aids infrequently until after CI surgery. AD underwent cochlear implantation surgery on the right side at 359 days (approximately 12 months) old, with the initial switch-on of the device occurring 44 days later when he was 403 days (13 months) old. He was fitted with a Pulsar 100 CI by MED-EL. In the period between the surgery and CI switch-on, AD wore a hearing aid on the left side. He also continued to wear the left hearing aid after CI switch-on. A total of 21 occasions of vocal recordings were analysed, between the ages of 332 days old and 423 days old, with a sum of 1050 vocal sounds examined.
2.1.2 Participant 2: AE. AE was referred for audiologic assessment at 407 days (15 months) old, when her parents became concerned of her lack of language development. Prior to this, her mother had approached the paediatrician several times with concerns over AE’s lack of babbling compared to her peers, which the doctor had attributed to a slight
days later at 552 days (18.4 months) old. AE did not continue to regularly wear a hearing aid
on the left side during the time between surgery and switch-on (except for day 550), nor did she resume wearing it after CI switch-on. A total of 13 occasions of vocal recordings were analysed, between the ages of 477 days old and 575 days old, with a sum of 629 vocal sounds examined.
2.2 Data Collection
The total recordings provided for child AD were made between 09/12/04 and
22/06/05, from 300 days old until 495 days old. Recordings provided for child AE were made between 21/01/05 and 18/07/05, from 465 days old until 643 days old. The recording sessions were organised to be approximately weekly (± 4 days), and were carried out during
appointments in the ENT clinic at the University of Würzburg and at the children’s homes. The aim was to record spontaneous vocal utterances of the children. Each child’s parents were provided with training and instructions on carrying out the recordings to ensure they were as consistent as possible. As recordings in the home environment brought more
drawbacks such as environmental and speech background noises, the frequency and length of these recordings was increased at times. Child AD’s spontaneous vocal utterances were recorded with a Sony TCD-D3 recorder before the 23/03/05 and a Tascam –DA-P1 thereafter, whilst child AE’s utterances were recorded with a Tascam DA-P1 recorder.
2.3 Data Processing
and segmented by separating them at the end of each expiration by the child. The files were
then processed into WAV format, and organised according to recording day. Overly noisy or otherwise poor recordings were omitted. Spectral analysis was carried out using an additional MDVP module, and screenshots of these spectrograms were provided with the processed sound files.
2.4 Data Analysis
The sound files collected for AD and AE were further analysed in the present study. Auditory and spectral analyses were carried out in order to assess the type of vocalisation and introduce further inclusion/exclusion criteria. All spontaneous vocal utterances that were not jointly judged by the researcher and Prof Wermke to be comfort sounds were excluded. This included cries, laughs, gurgles and raspberries; however non-distress squeals were retained. Several sound files contained too much background noise to be assessed accurately, and so were also discounted. Any vocalisations that were measured to have duration of less than 300ms were rejected, as this is commonly used as a minimum comfort sound length in speech and language analyses (Gregory, Tabain, & Morgan, 2010). The data also included longer files of multiple vocalisations, called series recordings. These were included to show how some of the sounds fit together in time, but were not necessary for this analysis.
Data analysis was carried out using version 6.0.28 of Praat speech analysis software (Boersma, 2017). The data were imported into Praat and visualised as a narrowband
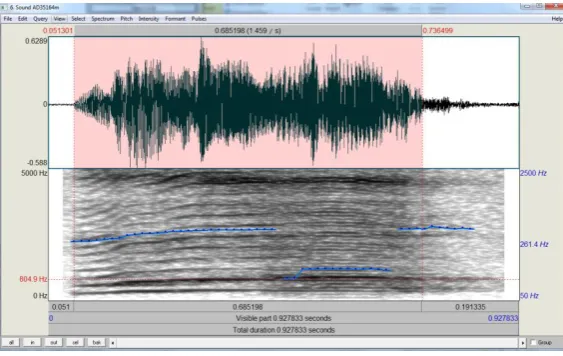
2.4.1 Duration. Duration was defined as the time between the onset and offset of visible acoustic energy “in the expiratory phase of a single respiratory cycle”. To measure vocal segment duration, vertical cursors were placed at the point of onset and offset of the
[image:51.595.174.456.220.398.2]spectrogram and the duration noted. An example of measuring duration is included (Figure 2.1).
Figure 2.1. Visualisation of the measurement of vocal segment duration . The cursors were
placed around the vocal segment (highlighted in red). The selected duration is depicted in seconds at the top of the Praat spectral analysis view.
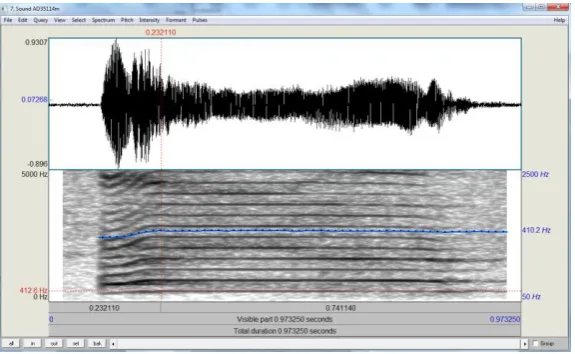
which superimposes a quantifiable pitch curve onto the spectrogram, as displayed in Figure
2.2. The unit of the pitch curve was set to Hz (logarithmic), which measures the average of the logarithms of the pitch values in a given selection of the sample, and then transforms the result back to Hz. This gives a result which is equivalent to the geometric mean pitch of the selected sample, allowing for a better representation of the overall f0 and giving less
emphasis to any extreme values.
For each sample, the pitch line was examined to ensure it correctly fit the f0 band. In cases where the software had inaccurately measured another harmonic other than f0, the pitch range was adjusted to rectify the error. Sometimes this had to be adjusted several times for one sample in order to find an appropriate mean f0 (see Figure 2.3). For samples which contained noise segments in the middle of periodic parts of the vocalisation, several different methods of analysis were carried out. When the average pitch segments were of a similar f0, the segment with the longest duration (which was also acoustically and visually judged to be a good representation of the sample) was used to calculate f0 by placing cursors around this area of the spectrogram and using the ‘get pitch’ function of Praat.
were taken for the sample and the average of these numbers was used. To increase accuracy
[image:53.595.173.461.247.424.2]when multiple f0 were taken and averaged, the duration of each measured f0 portion was kept consistent for the sample. For several of the vocalisations, an echo of the former f0 after a pitch shift was detected by the Praat pitch function, and not able to be adjusted. In these few cases, the pitch curve did not entirely represent the f0 of the sample but was still judged to be a fair representation.
Figure 2.2. Example of pitch measurement in Praat . The pitch contour is shown as a blue
Figure 2.3: Spectrographic example of pitch shifts within a single vocal segment , separated
by a period of noise. The blue pitch contour is seen to accurately measure the pitch of the second periodic segment, but not the first.
2.4.3 Noise. The definition of noise was adapted from Fuamenya et al. (2015) and Robb (2003): any part of the signal where there was either the absence of a clearly visible f0 and harmonics, the presence of subharmonics, and/or the acoustic features of noise (a ‘roughness’ quality to the sound) for a length of at least 50ms. This was measured by placing vertical cursors around each noise band in a recording and summing the noise duration.
The two predominant types of noise identified in the recordings were subharmonics (see Figure 2.4) and pulse register phonation (‘vocal fry’; see Figure 2.5). Vocal fry was defined as “the appearance of very closely spaced harmonics often resulting in temporal resolution of individual glottal pulses in the waveform and sometimes also the spectrogram, and a clear perception of a low “zipper-like” quality” (Buder et al., 2008, p. 6). In some recordings, the quality of the recording was too low to show the glottal pulses in the
fry could be identified more readily and accurately by using a combination of auditory and
spectral analysis rather than spectral analysis alone. This was supported by the identification of vocal fry by Prof. Wermke. Subharmonics were defined as “the abrupt appearance in the narrowband spectrogram of intervening harmonics, doubling, tripling, or even higher integer multiples in relation to the surrounding set” (Buder et al., 2008, p. 6). These were more easily identifiable by spectrogram visualisation, but sometimes required changing the dynamic range for confirmation. Some frequency shifts contained reverberations that appeared on the spectrogram in a similar manner to subharmonics, but these were not
[image:55.595.172.459.356.534.2]included as noise – often measuring less than 50ms or missing the acoustic characteristics of subharmonics.
Figure 2.4. Spectrographic example of subharmonics within a vocal segment. Cursors have
Figure 2.5. Spectrographic example of pulse register phonation (vocal fry) within a vocal
segment. Cursors have been placed around the section of vocal fry, and the duration of this segment is displayed at the top of the software
2.4.4 Calculation of Noise Index. The calculation of a Noise Index (NI) was based on the previous paper by Fuamenya et al. (2015). This was defined as the proportion of the total recording which consisted of noise, and was calculated by dividing the amount of noise by the total duration for each sample. In Fuamenya et al. (2015), an NI was calculated per recording session (summing the individual noise segments as well as the total duration of each segment, and then dividing these), however for this study an NI was calculated for each cry, which were then summed and averaged for each recording session.
3 Results
The results are presented in two sections. The first section comprises the acoustic analysis of child AD and the second covers the analysis for child AE. The analyses include data for f0, duration, and noise index (NI) for each vocal segment. The participants’ data analyses are divided into three phases: before CI surgery (Phase 1), after CI surgery and before CI switch-on (Phase 2), and after CI switch-on (Phase 3).
For child AD, Phase 1 includes recordings measured over the three weeks
immediately pre-surgery (six separate recording sessions). He typically did not wear hearing aids during these sessions. Phase 2 covers a period of four weeks post-surgery and pre-switch on, starting two weeks after surgery (seven sessions total), when he generally wore a hearing aid on his left side. Phase 3 includes three weeks post-switch on (eight sessions),
predominantly conducted with the CI on and no hearing aid worn on the left side.
Child AE’s first Phase comprises the three weeks prior to surgery, when she typically wore hearing aids bilaterally (three sessions total). Phase 2 began one week after surgery, and included six sessions over the subsequent five weeks when she did not use amplification. Phase 3 includes three sessions over the three weeks after CI switch-on, when the CI was activated on the right and no hearing aid was worn on the left.
Each dependent variable (f0, duration, NI) is represented by way of phase-specific histograms and a box and whisker plot. In order to facilitate visualisation and comparison between the two participants, the histogram bins and x-axis maximums for each
duration results are presented in histograms according to bin lengths of 250ms. The NI results
are displayed in histograms according to a bin length of 0.1.
3.1 Child AD
The weekly results across the three phases for each acoustic measure are displayed in Table 1. These same results are displayed as Figures in Appendix A. A summary of the results as described per Phase is given in Table 3. Collectively, Phase 1 included a total of 283 vocal segments. Phase 2 contained 236 vocal segments and Phase 3 contained 289 vocal segments.
3.1.1 Duration. The durations of child AD’s vocalisations across the three phases are shown in histogram form in Figure 3.1 and box and whisker form in Figure 3.2. During Phase 1, the mean duration was 1.09s (SD = 0.65; Md = 0.91). This increased to 1.29s (SD = 0.75; Md = 1.29) during Phase 2, and further to 1.71s (SD = 0.91; Md = 1.59) in Phase 3.
Examination of the histograms shows that durations are initially skewed to the left in Phase 1, but the central spread of values moves to the right over the three phases. This indicates a general increase in the duration of vocal segments and the data displays a more normal distribution by Phase 3. A prominent modal peak is seen at 0.5-0.75s in Phase 1, whereas Phase 2 shows the modal peak at 0.75-1s. By Phase 3, the histogram takes on a bimodal shape, with the most prominent peak at 1.75-2s. After each modal peak the
distribution of data steeply declines; indicating that the phase distributions are still somewhat skewed to the left over each phase.
visibly increased from Phase 1 to Phase 3, and more outliers of longer durations were seen
once the CI was switched on. Therefore across the three phases, there was both an increase in the range of vocal durations (also indicated by the standard deviation values), as well as an increase in the mean and median durations. It must be noted vocal segments of less than 300ms were not analysed, and so this was consistently the minimum duration measured across the phases.
The variation of mean duration decreases after CI switch-on. The CV of mean duration is 60% for Phase 1, which decreases to 58% for Phase 2 and further to 53% for Phase 3.
3.1.2 Fundamental Frequency. Figure 3.3 displays the results for f0 plotted in a logarithmic scale over the three phases. Mean f0 increased between Phase 1 and Phase 2, from 471Hz (SD = 309; MD = 360Hz) to 698Hz (SD = 531; Md = 422.82). During Phase 3, mean f0 decreased to 619Hz (SD = 455.38; Md 432.74).
The histograms of Figure 3.3 show the f0 data consistently skewed to the left, towards lower f0 values. The modal peak of Phase 1 is seen at 250-375Hz; whereas in Phases 2 and 3 it is apparent at 375-500Hz. Phases 2 and 3 also indicate the presence of a greater number of higher f0 vocalisations, particularly above 1500Hz.
The variation of mean f0 increases after CI switch-on when compared to Phase 1 (no
amplification), however the highest amount of variation is noted in Phase 2, when hearing aids are worn consistently for the first time. The CV of Phase 1 is given as 66%, Phase 2 as 76% and Phase 3 as 74%.
3.1.3 Noise Index. Figure 3.5 displays the change in child AD’s NI values across the three phases. Mean NI increases over time, from 0.25 (SD = 0.29; Md = 0.17) in Phase 1 to
0.31(SD = 0.30; Md = 0.24) in Phase 2 and 0.36 (SD = 0.31; Md = 0.30) in Phase 3.
Over the three phases, the spread of data does not change greatly, except for a reduction in the size of the large modal peak at 0-0.1. In general, the histograms illustrate an increase in uniformity of NI values by Phase 3.
The box and whisker plots of figure 3.6 also indicate this uniformity by Phase 3, with median NI values rising across the time periods. Calculated NI values are between 0 and 1, and so although the range of values doesn’t change there is a general smoothing of
distributions around the median, and the interquartile range increases. For example, in phases 1 and 2 the lower 50% of values are so concentrated that there is no observable lower
whisker. This emerges in the Phase 3 boxplot.
Out of the 283 vocalisations analysed in Phase 1, 176 contained at least some noise and so were calculated to have a NI above 0. This equates to approximately 62% of the vocal segments containing noise. In Phase 2, 169 samples out of 236 were found to have a noise index of more than 0 (71% of the segments), and in Phase 3 this figure increased to 227 out of 289 segments (78%). Therefore the amount of vocal segments containing noise
The variation of mean NI decreases with the activation of CI. The CV of Phase 1 is
Table 1. Average vocal parameters per session for Child AD
Age (days) n
Duration (s) Fundamental Frequency (Hz) Noise Index
Mean SD Mean SD Mean SD
Phase 1
332 59 1.37 0.95 349.86 128.68 0.17 0.17
334 11 1.09 0.41 389.51 193.16 0.11 0.11
335 73 1.15 0.62 423.48 194.00 0.21 0.26
351 73 0.89 0.38 603.40 425.04 0.41 0.33
354 9 0.54 0.15 743.66 520.28 0.28 0.32
355 58 1.07 0.56 477.47 283.81 0.22 0.29
Phase 2
373 45 1.16 0.82 871.12 549.60 0.21 0.24
381 50 1.22 0.63 630.46 456.18 0.34 0.30
388 11 1.17 0.61 459.27 109.06 0.24 0.29
390 9 1.53 0.60 656.22 452.99 0.19 0.18
391 55 1.11 0.59 938.1 669.90 0.42 0.32
392 35 1.06 0.73 548.24 514.91 0.12 0.19
402 31 2.14 0.66 423.97 101.54 0.50 0.30
Phase 3
403 51 1.95 1.09 638.28 422.06 0.46 0.34
404 13 1.71 0.82 918.08 685.94 0.40 0.31
405 14 0.88 0.35 722.58 660.22 0.55 0.39
406 6 1.40 0.62 559.47 511.27 0.42 0.41
409 16 0.92 0.44 1636.0 850.62 0.12 0.21
410 85 1.72 0.55 539.87 228.82 0.41 0.30
417 51 1.71 0.80 451.48 96.28 0.29 0.22
422 21 1.26 0.63 577.87 211.42 0.19 0.28
S
TI
C
F
EAT
URES
P
R
E
- AN
D POS
T
- C
OCHLEA
R
I
MP
LAN
TAT
IO
N
49
Phase 1 Phase 2 Phase 3
Figure 3.2. Median duration of vocalisations produced by AD across the three phases of data