Bruno Dhuime, Chris J. Hawkesworth, H´el`ene Delavault, Peter A. Ca-wood
PII: S0037-0738(17)30136-7
DOI: doi:10.1016/j.sedgeo.2017.06.001
Reference: SEDGEO 5197 To appear in: Sedimentary Geology
Received date: 10 April 2017 Revised date: 1 June 2017 Accepted date: 2 June 2017
Please cite this article as: Dhuime, Bruno, Hawkesworth, Chris J., Delavault, H´el`ene, Cawood, Peter A., Continental growth seen through the sedimentary record,Sedimentary Geology(2017), doi:10.1016/j.sedgeo.2017.06.001
ACCEPTED MANUSCRIPT
Continental growth seen through the sedimentary record
Bruno Dhuime1,2*, Chris J. Hawkesworth1,3, Hélène Delavault1, Peter A. Cawood3,4
1School of Earth Sciences, University of Bristol, Wills Memorial Building, Queen’s Road,
Bristol BS8 1RJ, UK
2
CNRS-UMR 5243, Géosciences Montpellier, Université de Montpellier, France
3
Department of Earth Sciences, University of St. Andrews, North Street, St. Andrews KY16
9AL, UK
4
School of Earth, Atmosphere and Environment, Monash University, Melbourne, VIC 3800,
Australia
*Corresponding author: [email protected]
Abstract
Sedimentary rocks and detrital minerals sample large areas of the continental crust, and they
are increasingly seen as a reliable archive for its global evolution. This study presents two
approaches to model the growth of the continental crust through the sedimentary archive. The
first builds on the variations in U-Pb, Hf and O isotopes in global databases of detrital zircons.
We show that uncertainty in the Hf isotope composition of the mantle reservoir from which
new crust separated, in the 176Lu/177Hf ratio of that new crust, and in the contribution in the
databases of zircons that experienced ancient Pb loss(es), adds some uncertainty to the
individual Hf model ages, but not to the overall shape of the calculated continental growth
curves. The second approach is based on the variation of Nd isotopes in 645 worldwide
fine-grained continental sedimentary rocks with different deposition ages, which requires a
correction of the bias induced by preferential erosion of younger rocks through an erosion
parameter referred to as K. This dimensionless parameter relates the proportions of younger to
ACCEPTED MANUSCRIPT
in the crust from which the sediment derived. We suggest that a Hadean/Archean value of K =
1 (i.e., no preferential erosion), and that post-Archaean values of K = 4–6, may be reasonable
for the global Earth system. Models built on the detrital zircon and the fine-grained sediment
records independently suggest that at least 65% of the present volume of continental crust was
established by 3 Ga. The continental crust has been generated continuously, but with a marked
decrease in the growth rate at ~3 Ga. The period from >4 Ga to ~3 Ga is characterised by
relatively high net rates of continental growth (2.9–3.4 km3 yr-1 on average), which are similar
to the rates at which new crust is generated (and destroyed) at the present time. Net growth
rates are much lower since 3 Ga (0.6–0.9 km3 yr-1 on average), which can be attributed to
higher rates of destruction of continental crust. The change in slope in the continental growth
curve at ~3 Ga is taken to indicate a global change in the way bulk crust was generated and
preserved, and this change has been linked to the onset of subduction-driven plate tectonics.
At least 100% of the present volume of the continental crust has been destroyed and recycled
back into the mantle since ~3 Ga, and this time marks a transition in the average composition
of new continental crust. Continental crust generated before 3 Ga was on average mafic,
dense, relatively thin (<20 km) and therefore different from the calc-alkaline andesitic crust
that dominates the continental record today. Continental crust that formed after 3 Ga gradually
became more intermediate in composition, buoyant and thicker. The increase in crustal
thickness is accompanied by increasing rates of crustal reworking and increasing input of
sediment to the ocean. These changes may have been accommodated by a change in
lithospheric strength at around 3 Ga, as it became strong enough to support high-relief crust.
This time period therefore indicates when significant volumes of continental crust started to
become emergent and were available for erosion and weathering, thus impacting on the
ACCEPTED MANUSCRIPT
Keywords
Continental growth; Hadean/Archaean; plate tectonics; zircon; shale; U-Pb/Hf/Nd/O isotopes
1. Introduction
The continental crust has evolved over billions of years, helping to create the environment we
live in and the resources we depend on. Understanding how and when it formed is an
important step in unravelling the evolution of the Earth system, yet these questions remain
matters of considerable discussion. This is because most rocks in the geological record derive
from pre-existing crustal rocks (e.g., Hutton, 1788), and so it remains difficult to unpick from
the present record processes of crust generation from processes of crustal destruction,
reworking and preservation (Hawkesworth et al., 2009, 2010; Belousova et al., 2010; Condie
et al., 2011; Voice et al., 2011; Dhuime et al., 2012; Arndt, 2013; Vervoort and Kemp, 2016;
Iizuka et al., 2017). The present-day composition of the bulk continental crust is well
constrained, with studies converging towards an average andesitic composition (i.e., SiO2
~57–65%) (Taylor, 1964; Rudnick and Gao, 2003; Hacker et al., 2011). Its intermediate/felsic
composition is widely explained by a two-stage model in which juvenile (proto)continental
crust is extracted from the mantle, followed by differentiation through partial melting and/or
fractional crystallization (e.g., Rudnick, 1995). The rates and timing of the net addition of new
crust to the continental landmass, commonly referred to as 'continental growth', remain matters
of debate.
A number of studies have attempted to evaluate the volumes of continental crust through the
evolution of the Earth, using different approaches and proxies. A summary of cumulative
ACCEPTED MANUSCRIPT
is presented in Fig. 1. The most extreme scenarios suggest that the volume of continental crust
at the Archaean-Proterozoic boundary may have been less than 25%, or more than 100%, of
the present-day volume (Fig. 1, curves 'V&J' and 'F', respectively). Some curves are relatively
smooth (e.g., curves 'O’N' and 'Be'), and so represent continuous growth of the continental
crust, whereas others are stepped (e.g., curves 'T&M' and 'C&A') suggesting episodic growth.
Between such end-members a number of scenarios have been envisaged, where the locus and
the intensity of breaks in slope in the curves are linked to changes in the timing and rates of
continental growth.
Sediments derived from continental sources (here after referred to as 'continental sediments')
cover vast tracks of continental crust, with for instance the 15 largest rivers draining ~30% of
the surface area of the continental crust (Goldstein et al., 1984; Milliman and Syvitski, 1992).
Ancient sediments deposited million to billions of years ago preserve information on the
continental crust that has been destroyed and is no longer available for sampling through
magmatic rocks (McLennan and Taylor, 1982; O'Nions et al., 1983; Allègre and Rousseau,
1984; Goldstein and Arndt, 1988; Goldstein and Jacobsen, 1988). As a consequence, the
sedimentary record is increasingly seen as a reliable archive for the global evolution of the
continental crust through time, and over the last decade there has been increasing interest in
using the information available in the ever-growing databases of detrital zircons to model the
growth of the continental crust (Rino et al., 2004; Condie et al., 2005; Wang et al., 2009,
2011; Belousova et al., 2010; Iizuka et al., 2010; Condie et al., 2011; Dhuime et al., 2012;
Parman, 2015). In parallel there has been a recent interest in exploring the processes that bias
the sedimentary record (Dhuime et al., 2011b; Cawood et al., 2013) in order to better
constrain growth models based on bulk sediment data (Allègre and Rousseau, 1984; Michard
ACCEPTED MANUSCRIPT
The mineral zircon is a key minor constituent of the igneous rocks generated in the production
of the continental crust, which together with its physiochemical resilience and the
development of microanalytical techniques enabling the rapid determination of its isotopic
and trace element compositions, makes zircon an important archive of the evolution of the
continental crust. Importantly, detrital zircons remain one of the few records of geological
processes in the first 500 million years of Earth’s history, a period for which no rocks are
known to have been preserved (Mojzsis et al., 2001; Wilde et al., 2001; Watson and Harrison,
2005; Blichert-Toft and Albarède, 2008; Harrison et al., 2008; Hopkins et al., 2008, 2010;
Harrison, 2009; Kemp et al., 2010; Trail et al., 2011; Bell et al., 2015a). Initial studies of the
continental record using zircon relied on their U-Pb age distribution in modern river
sediments to model continental growth (Rino et al., 2004, 2008). The development of in situ
Lu-Hf analyses in zircon by laser ablation multi-collector inductively coupled plasma mass
spectrometry (LA-MC-ICP-MS) (Griffin et al., 2000; Iizuka et al., 2005; Kemp et al., 2005),
rapidly followed by an explosion of the number of LA-MC-ICP-MS laboratories, has
highlighted that 80–90% of zircons analysed have Hf isotopic compositions that are not in
equilibrium with the composition of new continental crust extracted from the upper mantle at
the time they crystallised (Belousova et al., 2010; Voice et al., 2011; Roberts and Spencer,
2015). This reaffirms that most rocks of the continental crust derive—at least in part—from
pre-existing crustal material, as was argued by Hutton in the eighteenth century (Hutton,
1788). As a consequence, continental growth curves based solely on distributions of U-Pb
crystallisation ages will be strongly influenced by ages that reflect the reworking of
continental crust, and as such they can only be considered as reflecting the minimum volume
of continental crust that was present at a particular time (Komiya, 2011; Hawkesworth et al.,
ACCEPTED MANUSCRIPT
An initial difficulty in modelling the growth of the continental crust is how to evaluate the
proportion of newly generated crust over that of reworked pre-existing crust at different times,
as recorded in zircons and continental sediments – and the extent to which this proportion has
changed through time (e.g., Belousova et al., 2010; Iizuka et al., 2010; Dhuime et al., 2012).
In this contribution we discuss how variations in U-Pb, Hf and O isotopes in detrital zircons
can be used to model the growth of the continental crust, and the strengths and limitations of
this approach. We demonstrate through the combination of this approach, and an independent
approach based on the variation of Nd isotopes in fine-grained continental sedimentary rocks
with different deposition ages, building on the equations of Allègre and Rousseau (1984), that
by 3 Ga the volume of the continental crust was at least 65% of the present volume. Finally
we use these results, along with data from the literature, to develop a preliminary model for
the evolution of the continental crust that takes into account changes in the rates at which
crust was generated and destroyed.
2. Detrital zircon record
2.1. Continental growth models based on the combination of U-Pb, Hf (and O) isotopes
Belousova et al. (2010) were the first to model the growth of the continental crust on the basis
of variations in the proportion of new relative to reworked crust, using a worldwide U-Pb and
Hf isotopes database of over 13,000 zircons, largely of detrital origin. Their database was
broken down into 45 time slices, each of 100 Ma duration. For each 100 Ma interval, the
proportion of juvenile crust addition (Xjuv) was calculated by counting the number of zircons
with U-Pb ages (NU-Pb age) in that interval, and the number of zircons with Hf model ages
ACCEPTED MANUSCRIPT
Xjuv = Nmodel age / (NU-Pb age + Nmodel age). (1)
A continental growth curve was built from the cumulative proportions of juvenile crust
addition through time (Fig. 2, black curve), and this model suggests that ~50% of the present
volume of continental crust was present by 3 Ga (Belousova et al., 2010).
However, the Hf isotope composition of the zircons analysed may reflect mixtures of both
juvenile and older reworked material (Kemp et al., 2007), and so individual model ages may
be hybrid ages and hence not represent true periods of crust formation (Arndt and Goldstein,
1987). Thus a significant uncertainty remains over the shape of continental growth curves that
rely solely on model ages. This issue can in part be tackled by combining oxygen isotopes
with U-Pb and Hf isotopes (Hawkesworth and Kemp, 2006b; Kemp et al., 2006). 'Mantle-like'
zircons, i.e., zircons in high temperature equilibrium with mantle-derived magmas, have a
narrow range of δ18
O (typically δ18O = 5.3 ± 0.6‰ (2 s.d.; Valley et al., 1998)), and δ18O in
zircons are higher or lower when their parent magmas contain a contribution of supracrustal
material (e.g., sediments deriving from pre-existing crust). Periods of juvenile crust formation
are taken to be characterised by zircons that have mantle-like δ18O and limited variation in
their Hf model ages irrespective of their U-Pb ages (Kemp et al., 2006). Conversely periods
dominated by crustal reworking produce 'supracrustal' zircons, typically with elevated δ18
O
values (Valley et al., 2005; Spencer et al., 2014) and a large variation of hybrid Hf model ages
at similar U-Pb ages (Kemp et al., 2006; Vervoort and Kemp, 2016). To the extent that Hf
isotope ratios of supracrustal zircons may represent mixtures, they will not record true periods
of crustal growth (Kemp et al., 2006).
A difficulty in developing models of continental growth based on zircons is therefore in
ACCEPTED MANUSCRIPT
representative of the average continental crust, and for which O isotope data are not available
(Belousova et al., 2010; Condie et al., 2011; Voice et al., 2011; Roberts and Spencer, 2015).
Dhuime et al. (2012) explored the extent to which the variations between Hf model ages and
δ18
O in zircons for which such data are available might be parameterised in order to better
correct for the bias induced by the presence of zircons with hybrid Hf model ages in datasets
with no O isotope data. They found, using a global U-Pb, Hf and O isotope database of 1376
zircons analyses, that the proportion of 'true' crust formation to hybrid Hf model ages
calculated for every 100 Ma time slice is ~0.73 between the Hadean and 3.2 Ga. After 3.2 Ga
this proportion gradually decreases to ~0.2 at 2 Ga, then increases to ~1 at present, following
a second-order polynomial relationship with an R2 = 0.91 (Fig. 2, inset). Dhuime et al. (2012)
used this relationship to correct for the contribution of hybrid Hf model ages in a worldwide
database of 6972 U-Pb and Hf analyses of zircons from young sediments. They defined the
proportion of juvenile crust addition (Xjuv) for every 100 Ma time slice of this database as:
Xjuv = NNC ages / (NNC ages + NRC ages), (2)
with NNC ages = number of calculated new crust ages, as:
NNC ages = Nmodel ages * 0.73 t for t>3.2 Ga, (3)
NNC ages = Nmodel ages (2.894E-7 t2 + 1.085E-3 t + 1.243) for t0-3.2 Ga; (4)
and NRC ages = number of reworked crust ages, calculated as the difference between the total
number of U-Pb ages within a given time slice, and the number of zircons with similar U-Pb
ages and Hf model ages within the same time slice.
Dhuime et al. (2012) calculated the continental growth curve presented in Fig. 2, from the
cumulative proportions of juvenile crust addition through time. This curve suggests that by 3
Ga the volume of the continental crust was ~65% of the present volume, and that there was a
ACCEPTED MANUSCRIPT
curves calculated from large U-Pb and Hf in zircon databases in the absence of O isotope data
(Belousova et al., 2010; Roberts and Spencer, 2015).
2.2. Critical parameters influencing zircon-based continental growth models
Continental growth models that rely on zircon Hf model ages are regarded as controversial
(Arndt, 2013; Arndt and Davaille, 2013; Guitreau and Blichert-Toft, 2014; Roberts and
Spencer, 2015; Couzinié et al., 2016; Payne et al., 2016; Vervoort and Kemp, 2016; Iizuka et
al., 2017; Rollinson, 2017), principally because the calculation of zircon Hf model ages may
be influenced by a number of factors; (i) the Hf isotope composition of the reference reservoir
from which model ages are calculated; (ii) the 176Lu/177Hf isotope ratio of the crustal source of
the magmas from which the zircons crystallised; and (iii) underestimation of the
crystallisation age of apparently concordant zircons that experienced ancient Pb loss(es). The
extent to which zircon datasets preserve a representative record of the evolution of the crust
may also play a role in continental growth models. The influence of these parameters on the
shape of the global continental growth curves is evaluated below.
2.2.1. Influence of the isotope composition of the source reservoir of the new continental crust
Geochemical mass balance calculations indicate that about 80% of the continental crust that is
preserved today was generated along destructive plate margins (Rudnick, 1995; Hawkesworth
and Kemp, 2006a). This implies that subduction-related magmas should be used to constrain
the isotope composition of the continental crust at the time of its formation, at least for the
period of time when plate tectonics has been operating. Consequently, Dhuime et al. (2011a)
suggested that model ages, traditionally calculated for crust derived from the depleted mantle
(e.g., DePaolo, 1981; Goldstein et al., 1984; DePaolo et al., 1991), should be calculated using
ACCEPTED MANUSCRIPT
present-day isotope composition of that new crust (εHf = 13.2 ± 1.1) was determined from the
data of modern intraoceanic magmatic arcs worldwide, and Dhuime et al. (2011a) proposed a
linear evolution for the new crust, with a chondritic uniform reservoir (CHUR)-like isotope
composition at the time of Earth’s formation (Fig. 3). Model ages calculated from the Hf
isotope composition of the new crust are up to 300 Ma younger than model ages calculated
from the depleted mantle, and all calculations for the Dhuime et al. (2012) model presented in
Fig. 2 were done using the Dhuime et al. (2011a) new crust evolution model.
In order to evaluate the extent to which the isotope composition of the source reservoir of the
new continental crust may affect the shape of the continental growth curves calculated from
the zircon data, continental growth curves were recalculated assuming two different models
for the inferred source reservoir of the new continental crust: (i) a traditional depleted
mantle-like evolution, from a CHUR-mantle-like isotope composition at the time of Earth’s formation until
εHf = 17 at present (Salters and Stracke, 2004; Workman and Hart, 2005) (Fig. 3A, green
curve); and (ii) a CHUR-like evolution for the new crust between Earth’s formation and ~3.8
Ga, as suggested by Vervoort et al. (2013), and followed by a linear evolution up to εHf = 13.2
at present (Fig. 3A, orange curve). The similar shapes of the continental growth curves
obtained with these different methods (Fig. 3B, C) and the model of Dhuime et al. (2012)
(Fig. 2) suggest that no significant bias results from the choice of the reference curve for the
Hf isotope ratios of new continental crust in the calculation of model ages when large datasets
are considered.
2.2.2. Influence of the 176Lu/177Hf ratio inferred for the crustal source
There is some uncertainty over the 176Lu/177Hf ratio of the crustal source of the magmas from
ACCEPTED MANUSCRIPT
et al., 2008; Harrison, 2009; Kemp et al., 2010; Guitreau et al., 2012; Payne et al., 2016;
Vervoort and Kemp, 2016). This uncertainty propagates into the calculation of Hf model ages,
which makes the robustness of individual model ages difficult to evaluate. A value of
176
Lu/177Hf = 0.015, typical for the bulk continental crust (e.g., Taylor and McLennan, 1995;
Rudnick and Gao, 2003; Hacker et al., 2011), was preferred in the models of Belousova et al.
(2010) and Dhuime et al. (2012) (Fig. 2), and a graphical representation of the calculation of
the Hf model ages with this method is shown in Fig. 4A (grey segment and grey star (0)). In
order to test the effect of having different 176Lu/177Hf ratios, two extreme case scenarios are
explored: (i) a crustal source that is more felsic/evolved than the bulk crust (176Lu/177Hf =
0.009, red segment), and for which calculated model ages are represented by the red star (1)
in Fig. 4A; and (ii) a crustal source that is more mafic than the bulk crust (176Lu/177Hf = 0.022,
green segment), and for which calculated model ages are represented by the green star (2).
The resulting continental growth curves are shown in Fig. 4B and 4C for 176Lu/177Hf = 0.009
and 176Lu/177Hf = 0.022, respectively. The shapes of the continental growth curves in Figs. 2
and 4B,C are similar, which suggests that variations in the 176Lu/177Hf of the crustal sources
have minimal impact in the calculation of continental growth models based on large sets of
zircon data.
2.2.3. Influence of ancient Pb loss(es) on the calculation of crust formation ages
The calculation of zircon Hf model ages of crust formation critically relies on good estimates
of the U-Pb crystallisation age of the zircon, as well as on the Hf isotope ratio of the zircon at
the time of crystallisation. Greater confidence in the accuracy of the crystallisation ages can in
principle be achieved by filtering discordant U-Pb analyses (e.g., analyses with a discordancy
greater than 5–10%) in zircon databases, however some uncertainty remains over the
ACCEPTED MANUSCRIPT
if the zircons have experienced ancient Pb loss(es). The effect of ancient Pb losses in the
calculation of initial Hf isotope ratios and model ages of crust formation has been discussed in
a number of studies (e.g., Kemp and Whitehouse, 2010; Guitreau and Blichert-Toft, 2014;
Claesson et al., 2015; Vervoort and Kemp, 2016), and a graphical summary is given in Fig.
5A. The proportion of detrital zircons that have experienced ancient Pb losses remains
difficult to address in large datasets, and the extent to which analyses affected by Pb loss(es)
may affect the shape of continental growth curve remains unclear. One simple test is to select
grains with Archaean ages in large U-Pb and Hf detrital zircons databases, then subtract a
random amount of time from their crystallisation ages to simulate Pb loss, and use the
altered/modified database to recalculate a continental growth curve. The Dhuime et al. (2012)
dataset was selected, random amounts of time between 0–500 Ma were subtracted from the
crystallisation ages of Archaean grains using an in-house Excel spreadsheet (the average
reduction was ~250 Ma), and a new continental growth curve was calculated from the altered
database (Fig. 5B). Its aspect remains similar to that of the curve obtained from the original
dataset, which suggests that the effect of ancient Pb losses is small on the shape of continental
growth curves based on large U-Pb and Hf datasets.
2.2.4. Influence of the nature and the size of zircon databases on continental growth models
The sampling strategy, and more specifically the extent to which specific sets of data best
record the global evolution of the continental crust, is a key issue in continental growth
studies. Belousova et al. (2010) used a database of over 13,000 zircons sampled worldwide.
This database contains zircons of both magmatic and detrital origin, but it is dominated by
detrital zircons, both from ancient and younger sediments. Dhuime et al. (2012) used a
smaller database of ~7000 zircons for their model, containing only detrital zircons with
ACCEPTED MANUSCRIPT
the assumption that since 'young' sediments typically contain zircons with a wide range of
ages, they may provide records that are more representative of the entire magmatic history of
the crust than zircons in igneous rocks or in old sediments. More recently Roberts and
Spencer (2015) compiled the U-Pb and Hf data for magmatic and detrital zircons available in
the literature ultimately to add nearly 30,000 analyses to the Belousova et al. (2010) database.
In order to test the sensitivity of the Dhuime et al. (2012) continental growth model to the use
of other databases, the equations of Dhuime et al. (2012) (see Section 2.1) were applied to
both the Belousova et al. (2010) and the Roberts and Spencer (2015) databases to build the
continental growth curves presented in Fig. 6A and 6B, respectively. These curves point
towards slightly lower volume of ancient crust, as for instance the volume of >3 Ga crust is
~60% of the present volume in Fig. 6A and 6B, compared with ~65% in Fig. 2. Despite these
differences, these curves can be considered as similar, especially in comparison with the
range of growth curves in Fig. 1. Lower volumes of Archaean crust obtained from the
Belousova et al. (2010) and the Roberts and Spencer (2015) databases may also reflect an
underestimation of the proportions of juvenile crust at that time, which can be predicted in
datasets that include ancient rocks and sediments (see equation (1)).
2.2.5. Summary
Difficulties in establishing the initial Hf isotope ratios of new crust, the 176Lu/177Hf of that new
crust, and in the numbers of zircons that experienced ancient Pb loss(es) in the databases, adds
some uncertainty to the individual model ages, but not to the overall shape of the continental
growth curves being modelled (Figs. 2–5). The shape varies slightly depending on which U-Pb
and Hf sets of data are used in the calculations (Fig. 6), but overall the conservation of the
global aspect of the continental growth curves is reassuring as it strengthens approaches based
ACCEPTED MANUSCRIPT
3. Fine-grained sediments record
3.1. Background
Fine-grained continental sedimentary rocks, most of which are described as 'shales' in the
literature, have been widely used to unravel the processes of crustal differentiation,
maturation and reworking that occurred on large spatial and temporal scales (Nance and
Taylor, 1976, 1977; McLennan and Taylor, 1982; Hamilton et al., 1983; O'Nions et al., 1983;
Frost and O'Nions, 1984; Davies et al., 1985; Michard et al., 1985; Miller and O'Nions, 1985;
Taylor and McLennan, 1991; Condie, 1993; Gao and Wedepohl, 1995; Jahn and Condie,
1995; Rudnick and Gao, 2003; Bindeman et al., 2016; Tang et al., 2016). The Rare Earth
Elements (REE) contents of sediments have long been of particular interest (e.g., Nance and
Taylor, 1976, 1977), because REE have a low solubility in water and so they are less subject
to fractionation in the sedimentary cycle than many other elements. Sm and Nd are especially
relevant because they are the parent and daughter elements of a long-lived radioactive decay
chain, and because the 147Sm/144Nd ratios show a limited range of variation in fine-grained
continental sedimentary rocks (e.g., mean 147Sm/144Nd = 0.116 ± 0.013 s.d., from a
compilation of 645 samples worldwide; references are provided in Section 3.3).
Allègre and Rousseau (1984) were the first to use the geochemical properties of the Sm-Nd
system in shales to develop a model for the growth of the continental crust. More specifically,
they used a box-model approach and the variation of Nd model ages in eight samples of
Australian shales with deposition ages ranging 3.3–0.2 Ga to generate a continental growth
curve. In their model the present-day continental crust was arbitrarily subdivided into seven
ACCEPTED MANUSCRIPT
were taken as the sources from which continental sediments were eroded, and then deposited
every 500 Ma at t1 = 2.5 Ga, t2 = 2 Ga, t3 = 1.5 Ga, t4 = 1 Ga, t5 = 0.5 Ga and t6 = 0 Ga. These
deposition ages constitute six consecutive steps in the box-model of Allègre and Rousseau
(1984). For each step tn, they calculated the mass fraction of juvenile crust present in the bulk
sediment. To do so they considered that the sources of the sediments can be considered in
terms of two continental blocks (Fig. 7): a young block of mass fraction [x] made of juvenile
crust (green block), and an older block of mass fraction [1-x] that represents the average of all
the continental segments formed in previous events (brown block). A major difficulty was to
evaluate the extent to which the proportions of different source rocks in the sediments may be
biased through erosion processes. Allègre and Rousseau (1984) argued that young orogens
have a higher relief than older continental segments, and that since rocks are more prone to
erosion as the relief increases due to their greater potential energy (Ahnert, 1970; Pinet and
Souriau, 1988; Summerfield, 1991; Milliman and Syvitski, 1992; Summerfield and Hulton,
1994), the preferential erosion of high-relief young crust over low-relief old crust ultimately
results in an over-representation of younger source rocks in continental sediments. It follows
that in the two-block model of Allègre and Rousseau (1984), sediment extracted from the
young block has a mass fraction, here termed [y], such that [y] is > [x], because relatively
more sediment is derived from the younger source block of mass fraction [x]. Reciprocally,
sediment derived from the old block has a mass fraction [1-y] that is < [1-x] (Fig. 7).
The link between the relative proportions of source rocks of different ages in the catchment
area, and the proportion of those source rocks present in the sediment analysed, can be
expressed through an erosion parameter K. This parameter is dimensionless and was defined
by Allègre and Rousseau (1984) as:
ACCEPTED MANUSCRIPT
Using this parameterisation, Allègre and Rousseau (1984) calculated the mass fraction [x] of
the juvenile crust, for every step tn of their box-model, using the following equation:
[x] = 1 / ((K.[1-y]/[y]) + 1) (6)
The mass fractions [y] and [1-y] in the sediment issued from the young block and the old
block, respectively, were calculated from the mean age of the sediment Tsediment, for every step
tn of the box-model, using the following mixing equation:
Tsediment = [y].Tyoung + [1-y].Told (7)
with Tsediment = Nd model age of the sediment; Tyoung = age of the young block; and Told =
mean age of the old block made of all the continental segments formed in previous events.
By rearranging equation (7), the mass fraction [y] becomes:
[y] = (Tsediment - Told) / (Tyoung - Told) (8)
Once the value of [y] is reinserted into equation (6), the only unknown parameter left to
calculate [x] is the value of erosion parameter K. Allègre and Rousseau (1984) used assumed
values of K = 2, 4 or 6 in their model to generate three curves (Fig. 8A, red curves). The green
curve in Fig. 8A is the growth curve for K = 1, i.e., when [y] = [x] and no correction for the
preferential erosion of the young crust over the older crust is applied to the model. The grey
curves represent the effect of changing values of K, up to K = 50, on the global shape of the
modelled growth curves. The higher the value of K, the more young crust is overrepresented
in the sediment analysed, hence the larger the underestimation of the amount of old crust in
the source of the sediment, and so the larger the volume of ancient continental crust that is
actually present. These curves were established from the relative proportions of the mass
fractions [x] of juvenile crust in the segments of ages 2.75, 2.25, 1.75, 1.25, 0.75 and 0.25 Ga
ACCEPTED MANUSCRIPT
Thus the approach of Allègre and Rousseau (1984) seeks to evaluate the proportion of crustal
segments of different formation ages in the crust at the present day, and then infers that they
can be used as a proxy for the volumes of crust present at different times in the history of the
crust. This is similar to the approach of Condie (1998), and more recently Condie and Aster
(2010), who used the variation in U-Pb ages distribution of magmatic rocks with juvenile Nd
isotope ratios as a proxy for the variation of crustal volumes through time (see Fig.1, curve
'C&A'). On that basis the Allègre and Rousseau (1984) model suggests that both the volume
of >3 Ga juvenile rocks in the present crust and the volume of continental crust established by
3 Ga were ~25% of the present volume of crust for K = 2, and they increase to ~37% and
~46% for K = 4 and K = 6, respectively. These results contrast with the model proposed by
Dhuime et al. (2012) from the zircon record (Fig. 2), in which the volume of continental crust
present by 3 Ga is ~65% of the present volume. In the following sections we explore ways in
which the Allègre and Rousseau (1984) model might be reconciled with models in which
large volumes of crust were present early in Earth’s history (e.g., Fig. 1). These include (i)
variations in the value of the erosion parameter K; (ii) extension of the initial Nd isotope data
of Allègre and Rousseau (1984) on eight Australian shales to a worldwide dataset of 645
fine-grained continental sedimentary rocks considered to be more representative of the continental
crust, and (iii) other ways in which continental growth models might be developed from the
variations in Nd isotopes in fine-grained sediments.
3.2. Uncertainty over the global value of the erosion parameter K
Attempts to calculate the volume of crustal segments of different model ages from the Nd
isotope ratios of continental sediments critically depend on the value of the erosion parameter
K (Fig. 8). The value of this parameter that should be considered as representative of the
ACCEPTED MANUSCRIPT
1988; Kramers and Tolstikhin, 1997; Nägler and Kramers, 1998; Kramers, 2002; Tolstikhin
and Kramers, 2008), in part because only a few attempts have been made in measuring K in
natural systems. Goldstein and Jacobson (1988) estimated a value of K = 2.3 from the average
Nd isotope data of suspended loads in 31 rivers in North America, and they suggested that a
value of K = 2–3 may have been applicable through much of Earth’s history. Allègre et al.
(1996) used the Nd isotope data of suspended loads in four rivers from the Amazon Basin,
and the relative proportion of high-relief rocks in the rivers’ catchment areas, to calculate a
value of K = 5.8 for the Amazon Basin as a whole.
More recently Dhuime et al. (2011b) targeted the Frankland River in southwest Australia, a
'simple' system that only drains two continental blocks with distinctive age components
(Cawood et al., 2003), the Archaean Yilgarn craton and the Archaean to Proterozoic
Albany-Fraser orogen, in order to measure Kin situ in the same way as this parameter was originally
defined in the two-block model of Allègre and Rousseau (1984) (see Fig. 7). Dhuime et al.
(2011b) calculated K in three sample sites across the Frankland river, located at ~120 km, ~60
km and 0 km, respectively from the river mouth (Fig. 9). They used three different approaches
to determine the relative proportions of Yilgarn and Albany Fraser detritus in the sediment
samples: (i) the distribution of U-Pb ages in zircons, (ii) the distribution of Hf model ages in
zircons, and (iii) the Nd isotope composition of the bulk river sediments. They demonstrated
that these three approaches give similar results, and they used these data and the proportions
of the source rocks in the river catchment determined from a geological map to calculate K.
They showed that K varies along the river, with values of 4–6, 9–10 and 15–17 at 120 km, 60
km and 0 km from the river mouth, respectively (Fig. 9). Importantly the values of K increase
with the gradient of the river’s profile, with the two samples providing the highest K values
ACCEPTED MANUSCRIPT
an escarpment at ~80 km from the coast associated with Miocene-Pliocene uplift (Cawood et
al., 2003), and so from this period the increase in gradient of the river’s profile has resulted in
preferential erosion of material from the younger block (i.e., the Albany-Fraser Orogen), and
hence in higher calculated K values. Dhuime et al. (2011b) suggested that in order to avoid
local perturbations, the stable segment of the Frankland River is best sampled above the
escarpment, and that K values of 4–6 may be considered as better representative of mature
river systems that sample large areas of continental crust.
Cawood et al. (2013) used the variation in the running median of the Hf isotope composition
of zircons through time (Belousova et al., 2010) to argue that crustal melting is an important
process in the continental record. They highlighted that crustal melting is often associated
with crustal thickening, and hence with areas of high relief. As a consequence they suggested
that the bias in the sedimentary record might be dominated by erosion in areas of high relief
and, if correct, they suggested that the highest values of K so far measured in natural systems
(i.e., K = 15–17 in the Frankland River, see Fig. 9) may better account for the processes of
erosion and deposition of the sediments that dominate the geological record. It is striking that
for a value of K = 15, the continental growth curve of Allègre and Rousseau (1984) (Fig. 8A)
matches the shape of the curve of Dhuime et al. (2012) (Fig. 2), although the latter is based on
different geochemical and modelling approaches (see Section 2.1). However, it is important to
note that since the Allègre and Rousseau (1984) model is about the relative volumes of crust
of different ages at the present time, the K = 15 curve in Fig. 8A implies that ~65% of today’s
continental crust is >3 Ga old. Yet such large proportions of ancient crust preserved in the
present continental crust remain difficult to reconcile with a number of independent
ACCEPTED MANUSCRIPT
As noted in Section 3.1, the Allègre and Rousseau (1984) growth curve(s) can be usefully
compared with that of Condie and Aster (2010) (Fig. 1, curve 'C&A'), since both, in different
ways, provide estimates of the variation in the proportions of juvenile rocks of different ages
within the present crust. These growth models, and any other models based on this or similar
approaches, make the assumption that this variation preserved in the present-day crust reflects
the changes in the rates of continental growth through time (Condie, 1998; Condie and Aster,
2010; Arndt and Davaille, 2013; Arndt, 2013). The Allègre and Rousseau (1984) curve for K
= 15 suggests that the bulk present-day crust would be made of ~65% of crust older than 3
Ga, whereas the curve of Condie and Aster (2010) (Fig. 1) implies that only ~5% of that crust
is exposed at the Earth’s surface. This could be accommodated, for instance, by the presence
of large volumes of 'hidden' Archaean crust within the lithosphere (Begg et al., 2009;
Belousova et al., 2010). However large volumes of Archaean rocks within the present crust
seems unlikely when the mean age of the bulk continental crust is considered. For K = 1 (i.e.,
when no preferential erosion law is applied to the model), the model of Allègre and Rousseau
(1984) generates a mean age of 1.8 Ga for the present-day crust (calculated from the relative
proportions of the seven segments of ages 3.50, 2.75, 2.25, 1.75, 1.25, 0.75 and 0.25 Ga in the
present crust; see Section 3.1). This age is within error of the estimate for the mean age of
loess deposits of 1.82 ± 0.07 Ga recently obtained by Chauvel et al. (2014) (and see also
Goldstein et al. (1984) and Goldstein and Jacobsen (1988)). The mean age of the present-day
crust increases to 1.9 Ga for K = 2; then 2.2 Ga for K = 4; 2.4 Ga for K = 6; and 2.8 Ga for K
= 15. Since mass balance calculations of the crust–mantle system of Allègre et al. (1983) have
also constrained the mean age of the continental crust to between 2.0 and 2.4 Ga, the
implication is that global values of K ~15 may be too high. It thus appears unlikely that
significant volumes of old crust are hidden away somewhere at the present day, and K = 4–6
ACCEPTED MANUSCRIPT
There is increasing evidence that continents were mostly, if not entirely, below sea level until
3.0–2.5 Ga (Arndt, 1999; Flament et al., 2008, 2011, 2013; Dhuime et al., 2015; Tang et al.,
2016; Campbell and Davies, 2017; and see Section 4.2). This suggests that the preferential
erosion law of Allègre and Rousseau (1984) (Fig. 7) may not have applied throughout Earth’s
history, and that the value of the erosion parameter K may have not remained constant
through time (Cawood et al., 2013; Hawkesworth et al., 2013). Fig. 8B summarises
continental growth curves calculated for a two-stage evolution of the erosion parameter K,
with K = 1 (i.e., no preferential erosion) until 2.5 Ga and variable post-Archaean values
between 2 and 50. To avoid confusion with models that retain a uniform value of the erosion
parameter K, as in Allègre and Rousseau (1984), we use the notation 'K2s' to indicate models
calculated with a non-uniform, two-stage evolution of K. The differences between curves in
Fig. 8A and 8B typically remain small, because the age differences between younger and
older crustal sources were limited in the Archaean, and so the correction for the preferential
erosion of young rocks had relatively little effect in the estimation of the volumes of ancient
crust.
3.3. Continental growth from the Nd isotope record of fine-grained sediments worldwide
The original growth model developed by Allègre and Rousseau (1984) was established from
the analysis of a restricted number of sedimentary rock samples (i.e., eight shales) from the
Australian continent. The question remains as to whether this dataset can be taken as
representative of the crust, or whether other sets of data should be considered (Allègre and
Rousseau, 1984; Michard et al., 1985; Dia et al., 1990a). To address this issue, analyses of
645 fine-grained continental sedimentary rocks sampled worldwide were compiled from the
ACCEPTED MANUSCRIPT
sediments is plotted in Fig. 10. The variation of Nd model ages in sediments with similar
depositional ages may be large, but it is striking that when the running median of the data is
considered (Fig. 10, circles) the regression curve through the data has a trend very similar to
that defined by the Australian shales data of Allègre and Rousseau (1984) (diamonds). It thus
appears that the Australian samples can be considered as a reasonable proxy for the evolution
of the continental crust on a global scale (and see also Hawkesworth et al., 2010), and that the
growth curves generated by the original model of Allègre and Rousseau (1984) (Fig. 8) are
not significantly affected by being based solely on the Australian shales data.
3.4. Can the Nd in fine-grained sediments data be modelled differently?
In the box-model of Allègre and Rousseau (1984) the continental crust was arbitrarily split
into seven segments of ages binned at 500 Ma intervals, with the oldest segment of mean age
= 3.5 Ga. This choice was based on the pioneer study of Hurley and Rand (1969), in order to
simplify comparison between models. Since that time, a number of studies have provided
compelling evidence for continental crust older than 3.5 Ga (e.g., Stern and Bleeker, 1998;
Bowring and Williams, 1999; Wilde et al., 2001; Kemp et al., 2010), and thus for the present
study a box-model with an age of 4.4 Ga for the oldest continental segment was adopted. The
time-resolution of the modelling was improved by reducing the frequency of the steps from
500 Ma to 250 Ma, and the worldwide fine-grained sediments compilation (Fig. 10) was used
as input data.
The discussion of how bulk rock (fine-grained sediment) and mineral (zircon) databases have
been used to model the evolution of the continental crust, highlights the differences in the two
approaches. The first approach (hereafter referred to as 'Model 1') is based on the proportions
ACCEPTED MANUSCRIPT
approach (hereafter referred to as 'Model 2') involves estimating the proportions of juvenile
crust at different times in the history of the crust. Here, both approaches are applied to the
worldwide compilation of Nd isotope variations in fine-grained sediments (see Fig. 10). The
results are summarised in Fig. 11, and for the reasons discussed in Section 3.2, post-Archaean
values of K2s = 2, 4 and 6 were considered. Model 1 curves are calculated using the same
method as in the original study of Allègre and Rousseau (1984). These are presented as
dashed curves in Fig. 11, and they are broadly similar to the curves in Fig. 8. The calculated
proportion of present-day crust >3 Ga is 14% for K2s = 2, 21% for K2s = 4, and 27% for K2s =
6 (Fig. 11). The mean age of the present-day crust is 1.9 Ga if K2s = 2, 2.0 Ga for K2s = 4, and
2.1 Ga for K2s = 6. Model 2 curves (continuous curves in Fig. 11) are cumulative curves of the
proportion of juvenile crust calculated at each step tn of the box-model, using equation (6) of
Section 3.1. Importantly, these curves are very similar to the zircon curve of Dhuime et al.
(2012) (Fig. 11), which is reassuring in that both curves were calculated in similar ways.
These curves suggest that at least ~65% of the present volume of the continental crust was
established by 3 Ga, and there was a sharp change in the net rates of growth of the continental
crust at that time.
These results highlight how the calculated growth curves are sensitive to the ways in which
they are constructed, as in Model 1 or Model 2 (Fig. 11). We would argue that it is most
unlikely that the present-day distribution of rocks of different model ages preserved in the
continental crust (Model 1) is a plausible record of the volumes of crust of different ages that
were present throughout Earth’s evolution. We prefer approaches that rely on estimating the
relative proportion of juvenile and reworked crust through time (Model 2), as in the growth
models of Belousova et al. (2010) and Dhuime et al. (2012). Applying the Model 2 approach
ACCEPTED MANUSCRIPT
(2012) for a two-stage evolution of the continental crust based on inferred changes in the rates
of continental growth. The net growth rates calculated from the different curves plotted in Fig.
11 during Stage 1 (>4 Ga to ~3 Ga) range from 2.9–3.4 km3 yr-1, and they drop to 0.6–0.9 km3
yr-1 on average during Stage 2 (~3 Ga to the present day).
The zircon curve of Dhuime et al. (2012) was built from a database of ~7000 detrital zircons
with 'young' deposition ages ranging from the late Palaeozoic to the present day. This curve
gives the lowest estimate for the volume of crust present at 3 Ga (~65%). For K2s = 1, i.e., if
no preferential erosion is applied to the Nd in continental sediments Model 2 curves, a similar
volume of 3 Ga crust is obtained. As a consequence, the slight difference between the zircon
curve and the K2s = 2 to 6 curves for continental sedimentary rocks may be explained by an
overestimation of the proportion of young juvenile crust in the recent sediments from which
zircons were separated. This hypothesis suggests that the zircon curve would at best give an
estimate of the minimum volumes of crust that were established at different times, and the
best approximation for the 'true' volumes of crust at these times would be given by the K2s =
4–6 Model 2 curves in Fig. 11. Interestingly, Model 2 curves for K2s = 4–6 give ~70–75% of
the present volume of crust established by 3 Ga, which is entirely consistent with the recent
estimate of Pujol et al. (2013) based on the evolution of the atmospheric 40Ar/36Ar through
ACCEPTED MANUSCRIPT
4. Tectonic implications
4.1. Global onset of plate tectonics and variations in the rates of formation and
destruction of the continental crust through time
The timing for the global onset of plate tectonics remains debated, and it ranges from the
Hadean to the late Proterozoic depending on which proxies are considered (Kröner and Layer,
1992; de Wit, 1998; Komiya et al., 1999; Nutman et al., 2002; Stern, 2005; Brown, 2006;
Cawood et al., 2006; Moyen et al., 2006; Smithies et al., 2007; Van Kranendonk et al., 2007;
Dilek and Polat, 2008; Harrison et al., 2008; Hopkins et al., 2008; Pease et al., 2008; Shirey et
al., 2008; Nebel-Jacobsen et al., 2010; Hamilton, 2011; Shirey and Richardson, 2011; Dhuime
et al., 2012; Naeraa et al., 2012; Stern et al., 2013, 2016; Griffin et al., 2014; Ernst et al., 2016;
Hastie et al., 2016); and see Fig. 12). A number of recent models of continental growth show a
change in the average rate of growth at ~3 Ga (Fig. 12), and this was interpreted by Dhuime et
al. (2012) as reflecting a major change in the geodynamical setting(s) in which the continental
crust was formed and destroyed at that time (but see also Stern et al. (2016, 2017) for an
alternate interpretation). Dhuime et al. (2012) noted that the net growth rates of ~3 km3 yr-1
before 3 Ga (see Fig. 11) are broadly similar to recent estimates for crust generation rates
today (Scholl and von Huene, 2007, 2009; Stern and Scholl, 2010; Stern, 2011), suggesting
that there may have been little or no crustal destruction at that time. In contrast, the lower net
growth rates of ~0.8 km3 yr-1 may largely reflect higher crustal destruction rates, as subduction
zones became the major locus of crust formation and destruction after 3 Ga (e.g., Cawood et
al., 2006).
Shirey and Richardson (2011) compiled isotopic and bulk chemical data of silicate and
sulphide inclusions in diamonds from ancient lithospheric mantle keels, and showed that
ACCEPTED MANUSCRIPT
proposed that this reflects the onset of subduction and continental collision, in ways similar to
that at the present day. The combination of both the diamond inclusions data and the latest
continental growth models thus independently provide strong evidence for the widespread
development of 'modern style' subduction zones, and the onset of the Wilson cycle of oceans
opening and closing around 3 Ga. It is however important to note, as highlighted by Stern
(2005) and Stern et al. (2013, 2016, 2017), that there are few occurrences of rocks and
minerals that might unambiguously indicate modern-style plate tectonics processes, such as
ophiolites, blueshists and glaucophane eclogites, and lawsonite eclogites (Fig. 12), older than
~1 Ga.
The differences observed between continental growth curves and age distribution curves for
the juvenile crust that is preserved today (Fig. 11) can be accommodated by the destruction of
large volumes of ancient crust through subduction after the onset of plate tectonics. Recent
studies further suggested that ~3 Ga marked the transition between two different types of
continental crust. Continental crust generated before 3 Ga was on average mafic, dense and
relatively thin (<20 km) (Dhuime et al., 2015), and the upper crust sampled by sediments at
that time was also mafic (Tang et al., 2016). In contrast, continental crust that formed after 3
Ga gradually became more intermediate in composition, buoyant and thicker (Dhuime et al.,
2015). The rates of destruction of these two types of crust through time have been estimated at
every 500 Ma (Fig. 13), using the Nd in worldwide fine-grained sediments K2s = 6 Model 2
growth curve as the preferred 'best estimate' for the volume of continental crust established at
any time (Fig. 13, inset; and see Fig. 11, Model 2 continuous curve, and Sections 3.2 and 3.3),
and the K2s = 6 Model 1 curve for the proportions of continental segments of different ages
which are preserved in the crust today (Fig. 13 inset; and see Fig. 11, Model 1 dashed curve).
ACCEPTED MANUSCRIPT
time, with modelled mantle temperature (Korenaga, 2013), and rates decrease from ~4 to 3
km3 yr-1 between the Hadean and the present. The model predicts that about 50% of the
volume of the pre-3 Ga crust, presumably mafic and relatively dense (Dhuime et al., 2015;
Tang et al., 2016), was destroyed and replaced by younger crust within the ~1 Ga that
followed the onset of plate tectonics (i.e., from 3–2 Ga). Since ~2 Ga, the destruction of the
post-3 Ga crust, which is arguably more differentiated, more buoyant and thicker than the
pre-3 Ga crust (Dhuime et al., 2015), appears to become predominant. Finally this model predicts
that at least 100% of the present volume of the continental crust has been destroyed and
recycled back into the mantle since the onset of plate tectonics (Dhuime et al., in prep.). These
estimates open new perspectives for recent models of mantle evolution and crust–mantle
interaction through time (e.g., Honing and Spohn, 2016; Kumari et al., 2016; Walzer and
Hendel, 2017).
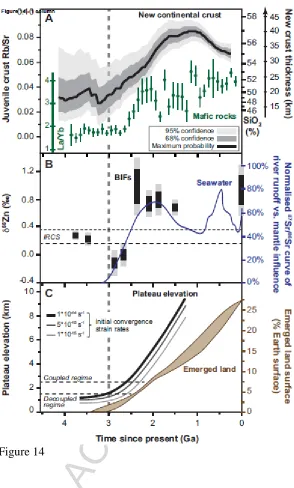
4.2. ~3 Ga as a key transition in Earth’s history
There is increasing evidence that ~3 Ga, and the inferred onset of plate tectonics around that
time, constitute a key transition in the evolution of the Earth system (Cawood et al., 2006;
Shirey and Richardson, 2011; Dhuime et al., 2012; Hawkesworth et al., 2016, 2017) (Figs. 14,
15). The secular cooling of the Earth, and associated changes in the mantle temperature and
rheology, allowed the transition from a regime dominated by 'vertical tectonics' to one
dominated by 'horizontal tectonics' (van Hunen et al., 2008; Sizova et al., 2010; Van
Kranendonk, 2010; Korenaga, 2011, 2013; van Hunen and Moyen, 2012; Debaille et al.,
2013; Gerya, 2014; Johnson et al., 2014, 2017; Gerya et al., 2015; Condie et al., 2016; Fischer
and Gerya, 2016; Van Kranendonk and Kirkland, 2016; Rozel et al., 2017). The Archaean
crust that is still preserved today has a bimodal silica composition (Kamber, 2015;
ACCEPTED MANUSCRIPT
rocks that outcrops at the surface is significantly greater than that occupied by greenstone
belts (Glikson, 1979; Condie, 1981; Kröner, 1985; Moyen and Martin, 2012). In contrast, the
average new continental crust that was generated before 3 Ga was mafic, with Rb/Sr ~0.03
and SiO2 ~48–50% (Fig. 14A) and the upper crust that was present at that time had an average
mafic composition (MgO ~15%; Tang et al., 2016). This suggests that the mafic and therefore
dense crust that was predominant before 3 Ga was preferentially destroyed and recycled back
into the mantle after the onset of plate tectonics; whereas the TTG crust, more felsic and
buoyant, remained preferentially preserved to ultimately dominate the preserved rock record.
Dhuime et al. (2015) demonstrated a systematic relationship between the Rb/Sr ratios (or the
SiO2 content) of rocks generated in modern-style subduction settings and crustal thickness at
the site of sampling. They applied this relationship to estimate the evolution in thickness of
the new continental crust that was formed since the onset of plate tectonics. The progressive
increase in the Rb/Sr ratios of the juvenile continental crust from 3 Ga onwards (Fig. 14A) is
taken to reflect the thickening of the continental crust through time, from ~20 km at 3 Ga to
~30-40 km towards the present. In parallel, mafic rocks show a marked increase in La/Yb
from ~2.7 Ga (Fig. 14B), along with a secular decrease in compatible element contents, and
an increase in incompatible element contents, which reflect a decrease in the degrees of
mantle melting through time (Keller and Schoene, 2012). These features in the mafic rocks
record can be attributed to partial melting of source(s) at depths in the stability field of garnet
rather than plagioclase, likely in response to thickening of the crust (Kemp et al., 2010;
Kamber, 2015), the progressive development/thickening of a continental lithosphere from ~3
Ga onwards (Griffin et al., 2014; Hawkesworth et al., 2017), and the development of
supercontinent cycles and widespread accretionary orogens after ~2.7 Ga (Campbell and
ACCEPTED MANUSCRIPT
There is a striking increase in the estimated crustal thickness (Fig. 14A) and both the rates of
crustal reworking (Dhuime et al., 2012) and the global increase of the sedimentary component
in the magmatic record, reflected by higher δ18O in zircons, since the late Archaean (Valley et
al., 2005; Spencer et al., 2014). The increase in crustal thickness is accompanied by an
increasing contribution of the sediment input to the ocean, which is evidenced by increasing
87
Sr/86Sr isotope ratios in seawater (Veizer, 1989; Shields and Veizer, 2002; Shields, 2007), as
well as increasing 66Zn in banded iron formations (BIF), a proxy for continental phosphorus
input to the ocean (Pons et al., 2013), from 3 Ga onwards (Fig. 14B). These changes may be
accommodated by a change in the lithosphere strength at around 3 Ga, as it became strong
enough to support high-relief crust (Rey and Coltice, 2008) (Fig. 14C). This therefore
indicates when significant volumes of continental crust became emergent (Arndt, 1999;
Flament et al., 2008, 2011, 2013; Campbell and Davies, 2017) (Fig. 14C) and were available
for erosion and surficial weathering to ultimately contribute to draw down of the CO2 and the
rise of the atmospheric oxygen at the Archaean-Proterozoic boundary (Kramers, 2002;
Campbell and Allen, 2008; Kump, 2008; Lee et al., 2016).
5. Future research directions
The models outlined here predict that (i) large volumes of mafic continental crust were
present early in Earth’s history; and (ii) the continental crust has been generated continuously,
but with a marked decrease in the rate of growth at ~3 Ga as subduction-driven plate tectonics
started. However, it is worth considering that these results remain model dependent and that
the debate remains open, regarding (i) the timing and the rates of the continental growth (see
Fig. 1 and references therein); and (ii) when plate tectonics became a dominant process on
ACCEPTED MANUSCRIPT
There is increasing evidence that the rate of destruction of the continental crust exceeds the
rate of its formation at present (Clift et al., 2009; Stern and Scholl, 2010; Stern, 2011), and
that the thickness of the new continental crust generated in active margins has decreased over
the last 1 Ga (see Fig. 14A). This suggests that at around 1 Ga the volume of continental crust
may have been greater that it is today (Dhuime et al., 2015). This feature cannot be 'seen' with
continental growth curves based on juvenile addition of new continental crust (e.g., Model 2
curves in Fig. 11), nor on the age distribution of rocks of different ages in the crust (e.g.,
Model 1 curves in Fig. 11), because such cumulative curves do not allow crustal volumes to
decrease over time. This highlights the need in developing continental growth models in
which the volume of continental crust may have exceeded its present value in the past (e.g.,
Fyfe, 1978; Stern and Scholl, 2010; Hawkesworth et al., 2016). Such models have to take into
account the timing and rates at which continental crust is destroyed and recycled back into the
mantle, as well as the effects of recycling process, to account for variations in the mantle
chemistry both at present and back in time (e.g., Allègre, 1982; McCulloch and Bennett,
1994; Nägler and Kramers, 1998; Kramers, 2002; Xie and Tackley, 2004; Delavault et al.,
2016a; Kumari et al., 2016).
'Traditional' radiogenic isotope systems (i.e., Sm-Nd, Lu-Hf, U-Th-Pb, Rb-Sr) have proven
very useful in crust–mantle interaction studies (e.g., Allègre, 2008). However, uncertainty
over the isotope composition of the ambient mantle in the Hadean/Archaean remains
problematic for precise mass balance calculations and the determination of model ages of
juvenile crust formation with these systems. This highlights the need in exploring the
information provided by 'alternate' radiogenic isotope systems. The K-Ca system, with a
ACCEPTED MANUSCRIPT
little variation in its 40Ca/44Ca ratio through time, whereas the (high K/Ca) continental crust
has developed highly radiogenic 40Ca/44Ca ratios in the early stages of Earth’s evolution
(Kreissig and Elliott, 2005). Finally the impact of the 4.1–3.8 Ga late heavy bombardment
(LHB) on the destruction and the recycling of the Hadean crust (Marchi et al., 2014; Shibaike
et al., 2016), and on the composition of the mantle, needs to be carefully considered when
developing more realistic models for the continental growth.
Although there is a consensus that subduction operated in the Archaean, but possibly only
locally and in a fashion very different as today, the timing for the transition between initial
'stagnant lid' tectonic regime, during which the Earth was dominated by vertical tectonics, to a
'modern plate tectonics' regime with widespread seafloor spreading centres and deep
subduction zones, remains poorly constrained (see Fig. 12). Also importantly, whether this
transition was sharp (10’s Ma) or progressive (100’s to 1000’s Ma), and whether it was
synchronous on a global scale yet has to be determined (see Fig. 15). The trace element
contents of bulk rocks have been used for decades as a proxy for the geodynamical context of
magmas generation (e.g., Pearce and Cann, 1973). However, their use in ancient (e.g.,
Achaean) mafic or felsic rocks as plate tectonics indicators has remained inconclusive (e.g.,
van Hunen and Moyen, 2012; Condie, 2015). New perspectives in bulk-rock analysis arise
from the recent development of so-called 'non traditional' isotopes such as Ti (Millet et al.,
2016) and Mo (Freymuth et al., 2015, 2016), which fractionate differently in magmas
generated in subduction or intraplate setting. The analysis of Ti and Mo isotopes in Archaean
samples can be seen as an interesting perspective, although the behaviour of these isotopes in
ACCEPTED MANUSCRIPT
The in situ measurement of trace elements in zircon by ion probe or laser ablation techniques
has a high potential for unravelling the nature and the geodynamical context of formation of
the granitic magmas from which zircons crystallise (Belousova et al., 2002; Wang et al.,
2012; Yang et al., 2014; Grimes et al., 2015; Trail et al., 2015; Gao et al., 2016; Smythe and
Brenan, 2016; Burnham and Berry, 2017). Since the large majority of zircons (80–90%, see
Section 1) crystallise from non-juvenile sources, the trace element contents in zircon may not
indicate the geodynamical context of the formation of the new continental crust. However,
there is potential in developing studies in which trace elements in well-dated zircons are used
as a proxy for the timing, rates and the geodynamical conditions of crustal reworking through
time.
Within the last few years, there has been a growing interest in developing studies based on the
mineral inclusion record in zircon. Initial studies established a link between the mineralogy of
the inclusions and the composition of the parent magma of the host zircon (Maas et al., 1992;
Cavosie et al., 2004; Hopkins et al., 2008, 2010; Bell et al., 2011), and between the type and
the chemistry of the inclusions and the presence of event(s) subsequent to the crystallisation
of the host zircon (Bell et al., 2015b; Bell, 2016). More recently Jennings et al. (2011) and
Bruand et al. (2016, 2017) established a strong correlation between the trace element content
of apatite, both within the rock matrix and in inclusion within zircon, and the composition of
the bulk rock. In parallel, Dhuime et al. (2014) and Delavault et al. (2016b) explored the
potential of combining in situ isotopic analyses of zircons and their mineral inclusions to
calculate the time-integrated Rb/Sr and U/Pb ratios of the juvenile continental crust at the
time of its Hf model age. The time-integrated Rb/Sr ratio can be used as a proxy for the
composition and the thickness of the juvenile continental crust (Dhuime et al., 2015, and see
ACCEPTED MANUSCRIPT
ages and the Hf isotope ratios of the host zircon (Dhuime et al., 2014). The time-integrated
U/Pb ratio can be used to unravel the tectonic setting of formation of the juvenile continental
crust (Delavault et al., 2016b). It is calculated from the Pb isotope composition of feldspar
inclusions and the U-Pb ages and the Hf isotope ratios of the host zircon (Delavault et al.,
2016b). Studies based on the analysis of inclusions in large collections of zircons of both
magmatic and detrital origin therefore have significant potential for unravelling the
composition and the tectonic setting(s) of formation of the new continental crust though time,
in ways that have never been explored before.
Finally, the recent development of increasingly more sophisticated numerical codes has
allowed models for the dynamics of crust–mantle interaction to be developed in ways that
were difficult to achieve until now (van Hunen and Moyen, 2012; Korenaga, 2013; Johnson et
al., 2014, 2017; Gerya et al., 2015; Fischer and Gerya, 2016; Honing and Spohn, 2016; Rozel
et al., 2017; Walzer and Hendel, 2017). The integration in such models of the expanding large
geochemical databases, including those available through online platforms (e.g., GEOROC:
http://georoc.mpch-mainz.gwdg.de/georoc/; EarthChem: http://www.earthchem.org/portal),
should give the opportunity to initiate more accurate global models that take account of the
inter-relationship and the linked variations between plate tectonics, magmatic activity,
continental growth, the oxygenation of the atmosphere, and the development and the
evolution of life on Earth (e.g., Arndt and Nisbet, 2012; Philippot et al., 2012; Cawood and
ACCEPTED MANUSCRIPT
Acknowledgments
This work was supported by the Natural Environment Research Council [NERC grant
NE/K008862/1], the Leverhulme Trust [grant RPG-2015–422], and the Australian Research
Council [grant FL160100168]. We thank Nick Arndt, Bob Stern and Jasper Knight for their
thorough and constructive comments, which have greatly helped in the final preparation of this
paper.
References
Ahnert, F., 1970. Functional relationships between denudation, relief, and uplift in large
mid-latitude drainage basins. American Journal of Science 268, 243-263.
Alibert, C., McCulloch, M.T., 1993. Rare earth element and neodymium isotopic
compositions of the banded iron-formations and associated shales from Hamersley,
Western Australia. Geochimica et Cosmochimica Acta 57, 187-204.
Allègre, C.J., 1982. Chemical geodynamics. Tectonophysics 81, 109-132.
Allègre, C.J., 2008. Isotope Geology. Cambridge University Press, 512 pp.
Allègre, C.J., Dupré, B., Négrel, P., Gaillardet, J., 1996. Sr-Nd-Pb isotope systematics in
Amazon and Congo River systems: Constraints about erosion processes. Chemical
Geology 131, 93-112.
Allègre, C.J., Hart, S.R., Minster, J.-F., 1983. Chemical structure and evolution of the mantle
and continents determined by inversion of Nd and Sr isotopic data, I. Theoretical
methods. Earth and Planetary Science Letters 66, 177-190.
Allègre, C.J., Rousseau, D., 1984. The growth of the continent through geological time
studied by Nd isotope analysis of shales. Earth and Planetary Science Letters 67,