1
On the micro mechanics of one-dimensional normal compression
G . R . M c D OW E L La n d J. P. D E B O N O
Discrete-element modelling has been used to investigate the micro mechanics of one-dimensional compression. One-dimensional compression is modelled in three dimensions using an oedometer and a large number of particles, and without the use of agglomerates. The fracture of a particle is governed by the octahedral shear stress within the particle due to the multiple contacts and a Weibull distribution of strengths. Different fracture mechanisms are considered, and the influence of the distribution of fragments produced for each fracture on the global particle size distribution and the slope of the normal compression line is investigated. Using the discrete-element method, compression is related to the evolution of a fractal distribution of particles. The compression index is found to be solely a function of the strengths of the particles as a function of size.
KEYWORDS: compressibility; discrete-element modelling; fractals; particle crushing/crushability; particle-scale behaviour
INTRODUCTION
McDowell & Bolton (1998) related the normal compression of granular materials to the evolution of a fractal distribution of particle sizes using a work equation and the assumption of a Weibull distribution of particle strengths giving a particle size effect on strength. They did not consider the stresses induced within a particle by multiple contacts, and simply considered the strength of a particle as measured by crushing between flat platens. Their work proposed that normal com-pression lines should be linear on a plot of voids ratio e against the logarithm of applied stress ó. There has been much theoretical work since: for example, Russell et al. (2009), who did consider the internal stress field within particles with regard to crushing; and Russell (2011), who also linked the compression line to the evolving fractal particle size distribution.
Crushing has generally been modelled using the discrete-element method (DEM) via two alternative methods: replac-ing ‘breakreplac-ing’ grains with new, smaller fragments; or by using agglomerates – groups of bonded particles with finite bond strengths. A˚ stro¨m & Herrmann (1998) showed that it was possible to model the fragmentation of grains in two dimensions using DEM. This work was supplemented by Tsoungui et al. (1999). Lobo-Guerrero & Vallejo (2005) developed a similar two-dimensional model of granular crushing, but in that model mass was not conserved. Ben-Nun & Einav (2010) and Ben-Ben-Nun et al. (2010) used their own two-dimensional model of grain fracture to explore the particle and force-chain topology, and the evolution of fractal distributions, and also used a distribution of particle strengths.
Using agglomerates, McDowell & Harireche (2002) used DEM to show that, for normal compression, yielding was the onset of bond breakage for an aggregate of agglomer-ates, and that normal compression lines resulted from the one-dimensional compression of an aggregate of agglomer-ates. However, their aggregates contained only a small num-ber of agglomerates. The bonds within the agglomerates were such as to give a Weibull distribution of particle
strengths when crushed between flat platens. They did not consider the evolution of a particle size distribution during normal compression, owing to the insufficient number of agglomerates in the model. Similar work was achieved by Cheng et al. (2003) and Bolton et al. (2008), who investi-gated various stress paths in addition to isotropic compres-sion, although again a limited number of agglomerates were used.
McDowell (2005) showed analytically that, based on the kinematics of particle fracture and the void collapse caused by the fracture of a particle, normal compression lines according to this argument should be linear in loge–logó space. No consideration was given to the complex distribu-tion of loads on each particle at its multiple contacts.
This paper aims to take the next step in understanding the mechanics of normal compression, by allowing particles to fracture without the use of agglomerates, and by considering the stresses induced in a particle due to the multiple contacts. Using DEM, the normal compression is linked to the evolu-tion of a fractal distribuevolu-tion of particles, and the influence of the mechanics of fracture on the slope of the normal com-pression line is properly investigated. This paper is essentially the sequel to the McDowell & Bolton (1998) paper, and the micro mechanics of normal compression are revealed.
PARTICLE STRENGTHS
McDowell & Bolton (1998) assumed that for a particle of diameterdcompressed diametrically between flat platens by a forceF, the characteristic stress induced within the particle was
ó F
d2 (1)
after Jaeger (1967), and that the values of this stress at failure followed a Weibull distribution (Weibull, 1951). The two-dimensional models mentioned earlier (e.g. Tsoungui et al., 1999; Ben-Nun & Einav, 2010) generally used fracture criteria based on shear stress derived from the principal stresses, which took into account the various possible combi-nations of loads on a particle. In the work on particle strength using agglomerates by McDowell (e.g. Lim et al., 2004), although agglomerates could break under complex distributions of loads, no consideration was given to the stress induced by multiple contacts, other than for simple diametral loading.
Manuscript received 22 March 2012; revised manuscript accepted 22 January 2013.
Discussion on this paper is welcomed by the editor.
The discrete element method (Cundall & Strack, 1979) uses two entities – a ball and a wall – to model interactions, and Newton’s second law together with a contact law to establish the accelerations, velocities and displacements of particles via a time-stepping scheme. The most commonly used DEM software is PFC3D (Itasca, 2005), which is the one used by the authors. In deciding whether a particle in an aggregate under multiple contacts should fracture or not, it is possible to make use of the stress tensor function within PFC3D, which will return the stress tensor for a sphere (similar to methods employed by Tsoungui et al., 1999, and Ben-Nun & Einav, 2010, using discs). For a particle under multiple contacts, it would not be feasible to use the mean stress to establish whether a particle should break or not, because the particle, if under a high hydrostatic stress but low deviatoric stress, would be unlikely to break, as it is loaded uniformly over its surface.
A decision was therefore taken to use the octahedral shear stress induced within each sphere to determine whether fracture should occur or not. The octahedral stress in a particle is derived from the principal stresses, and is given by
q¼1
3[(ó1ó2)2þ(ó2ó3)2þ(ó1ó3)2]
1=2
(2) Although the use of this equation to determine whether fracture should occur or not is a simplification, it provides a simple criterion to facilitate breakage, taking into account multiple contacts on a particle surface while avoiding the use of agglomerates. The decision was taken that if a particle is, for example, under diametral point loads, equal in three mutually orthogonal directions, then it would not break under this hydrostatic stress (q¼0).
For PFC3D, given a sphere compressed diametrically be-tween two walls, the value of q generated using the above equation is equivalent to
q¼0:9F
d2 (3)
and so is proportional to the characteristic stress ó. There-fore the assumption was made that, for particles loaded under multiple contacts, the particle would break if the octahedral shear stress was greater than or equal to its ‘strength’, where the strengths of the particles satisfy a Weibull distribution ofq-values.
The Weibull distribution is one of the most commonly used tools for analysing the fracture of disordered material, and has a wide range of applications. As well as ceramics (e.g. Ashby & Jones, 1986), Weibull statistics have been applied to the behaviour of ice (Jellinek, 1958) and incorpo-rated into Daniels’ fibre bundle model (Daniels, 1945). The Weibull distribution of strengths used here was taken from McDowell (2002) for silica sand, and is described in this work by the Weibull modulus, m, and the 37% strength, q0:
The quantity q0 is the value of octahedral stress for a
particular particle size such that 37% of particles are stronger, and is related to the characteristic induced tensile stress. Size effects on the tensile strength of materials are usually described in the form ó/db, whereóis strength, d
is the size, and b is a material constant. From Weibull’s survival probability for a block of material, it is possible to derive the relation
q0/d3=m (4)
assuming bulk fracture dominates and Weibull gives a volume ‘effect’ on particle strength (McDowell & Bolton, 1998). If surface flaws dominate, a different relation (equa-tion (5)) is appropriate, which will be discussed later (Lim et al., 2004).
ONE-DIMENSIONAL NORMAL COMPRESSION
A dense, random sample of 620 spheres of diameter 2mm was created in a scaled-down oedometer with diameter 30 mm and height 7.0 mm, and the sample was loaded one-dimensionally. These dimensions mean that, initially, only relatively short particle force chains can form between the top and bottom platens; however, it was decided to have such a geometry as is used in real one-dimensional oed-ometer experiments (in this case the aspect ratio is chosen to reduce wall friction). Using a larger oedometer would not allow simulations to reach such high pressures, owing to a large number of particles covering a very wide range of scales. In addition, it is important to have a diameter large enough to permit a sufficient number of force chains to develop. Different strength characteristics, hardening laws and mechanisms of fracture were examined to investigate the influence on the resulting particle size distribution and the slope of the normal compression line for the simulations.
The initial monodisperse sample was created using the radii expansion technique (Itasca, 2005), resulting in a random packing as dense as possible without any locked-in forces or overlap. The voids ratio calculated for the com-pression plots was calculated using the total solid volume for convenience while the simulation was running. Retro-spective calculations accounting for overlaps between parti-cles demonstrated no significant difference (less than 0.5% difference in volume of solids).
Simple diametral splitting
In a similar approach to the previous work with discs (e.g. A˚ stro¨m & Herrmann, 1998; Tsoungui et al., 1999; Lobo-Guerrero & Vallejo, 2005; Ben-Nun & Einav, 2010), although broken spheres are not spheres, in the interest of computational efficiency, allowing a large number of parti-cles to be generated and fragments to be self-similar in shape, each sphere was allowed to split into two equal spheres, without loss of mass, when the value of q was greater than or equal to its Weibull strength. Values of q0
derived from McDowell (2002) are plotted in Fig. 1 along with the values ofq0 used in the simulation according to the
above law in equation (4). McDowell’s compression plots and evolving particle distributions are reproduced in Figs 2 and 3 respectively.
It has long been acknowledged that it is impossible to simulate a perfectly realistic fracture mechanism using discs, as typified by the various solutions adopted by others when model-ling two-dimensional problems (e.g. A˚ stro¨m & Herrmann,
10 000
1000
100
10
1
Strength,
: MP
a
q0
0·1 1
Particle size, : mmd Experimental data (McDowell, 2002)
[image:2.595.322.546.573.759.2]Strength according to equation (4)
Fig. 1. Strength as a function of particle size for silica sand
1998; Lobo-Guerrero & Vallejo, 2005; Ben-Nun & Einav, 2010). The same applies to three dimensions, where a solution needs to be as physically realistic as possible, while using only spheres and allowing a large number of breakages.
In two dimensions, A˚ stro¨m & Herrmann (1998) experi-mented with two alternative mechanisms, the first of which replaced a broken disc with two equally sized fragments. The second mechanism used a much larger number of fragments, some of which were placed outside the perimeter of the original particle. They noted that although their second mechanism usually resulted in reduced local pressure being induced during breakage, the two mechanisms resulted in essentially the same final particle size distributions. Lobo-Guerrero & Vallejo (2005) replaced broken discs with smaller discs with no overlap, avoiding artificial pressures but not obeying conservation of mass. Ben-Nun & Einav (2010) proposed an alternative technique that involved re-placing broken discs with fragments small enough to avoid overlap, then rapidly expanding them to retain the original mass, avoiding a sudden increase in potential energy.
In the current paper, new sphere fragments overlap enough to be contained within the bounding parent sphere, with the axis joining their centres aligned along the direction of the minor principal stress, as shown in Fig. 4. This produces undesirable local pressure spikes during a breakage; how-ever, this overlap causes the particle fragments to move along the direction of the minor principal stress for the original parent particle, just as might occur for a single particle crushed between flat platens. To ensure sample stability, and to accommodate the artificial pressure increase due to the imposed elastic energy before particle release,
particle breakages are updated at once (for the whole sample) after a number of computational cycles equivalent to 0.003 s (the actual number of cycles during this time interval is inversely proportional to the ‘time step’). This period was deemed sufficient to allow the artificially induced energy to dissipate; increasing it has no effect on overall breakage. For each stress increment (1 MPa), the platen is gradually accelerated when increasing the vertical stress, with the maximum velocity capped at 0.1 m/s to eliminate any loading-rate effects. The platen is decelerated as the target stress is approached, and once it is reached the sample is cycled continuously until no further breakage occurs.
The particle input parameters are shown in Table 1. The Hertzian contact model was used, and the input value of shear modulus was arrived at assuming sand grains have an elastic modulus of 70 GPa, a typical value for quartz. It was found that the particle stiffness affected only the elastic component of the compression line. That is to say, before yield, the stiffness would affect the slope of the compression line. The value chosen was deemed to be realistic, and as a result the slope was shown to be small on unloading. In reality, the elastic modulus is related to the critical fracture stress according to Griffith (1920), and would influence the opening of cracks. More recently, Einav (2007) applied and extended this theory to granular material. Particle friction has also been investigated, and has no effect on the plastic compressibility; it affects only the lateral earth pressure coefficient.
0·7
0·6
0·5
0·4
0·3
0·2
0·1
0
V
oids r
a
tio
,
e
0·1 1 10 100
Stress, : MPaσ
0·3 mm⬍ ⬍d 0·6 mm
0·6 mm⬍ ⬍d 1·18 mm
[image:3.595.48.279.50.204.2]1·18 mm⬍ ⬍d 2 mm
Fig. 2. Normal compression lines for silica sand (McDowell, 2002)
0 10 20 30 40 50 60 70 80 90 100
0·01 0·1 1 10
Mass finer than: %
Particle size, : mmd Initial
10 MPa
20 MPa
50 MPa
[image:3.595.304.534.57.279.2]75 MPa 100 MPa
Fig. 3. Evolving particle size distributions for silica sand (McDowell, 2002)
1
1
3 3
Fig. 4. Equal diametral splitting mechanism
Table 1. Discrete-element method parameters for simulation of silica sand
Input parameter Value
Particle diameter,d0: mm 2
Density: kg/m3 2650
Initial number of particles 620
Voids ratio 0.82
Shear modulus,G: GPa 28
Poisson’s ratio 0.25
Particle friction coefficient 0.5
Wall friction coefficient 0.0
Weibull modulus 3.3
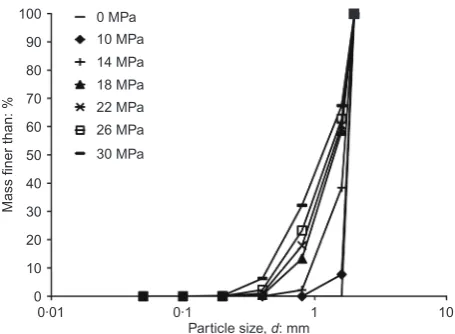
[image:3.595.50.273.240.406.2] [image:3.595.300.539.652.777.2]The resulting normal compression line and particle size distributions as a function of applied stress level are shown in Figs 5 and 6 respectively. Fig. 5 also shows the unloading curve, from which it is evident that the elastic component of deformation during normal compression is negligible. Images of the numerical sample before and after compres-sion are presented in Fig. 7.
Following yield, a linear normal compression line emerges in e–logó space (using common logarithms), with a plastic compressibility index of approximately 0.5. Data points are plotted at frequent intervals (1 MPa) to show that the com-pression line has a consistent slope. Minor fluctuations are visible, owing to the relatively small number of particles in the simulation, especially at lower pressures, similar to observations made by McDowell & Humphreys (2002) when subjecting pasta shells to normal compression. When the sample reaches a voids ratio much less than 0.5, the time step becomes unsustainable, owing to the very wide range of particle sizes (dmax/dmin.1000), and the simulation is
halted. Significant crushing is still occurring at high stresses, but it is the smaller particles with low mass that are
[image:4.595.320.548.50.217.2]break-ing, which is why the rate of change of the mass-grading curve reduces at high pressures. The general trend in Fig. 6 is the same as that in Fig. 3, although the numerical sample is initially monodisperse, whereas the silica sand sample is reasonably uniformly graded. As stress increases, the overall number of contacts increases, particularly for the larger particles, which become protected by the smaller fragments; the smaller particles continue to break, becoming statistically stronger.
Figure 8 shows the effects of increasing the initial strength q0: The normal compression lines for all values of q0 all appear to have the same gradients, with the yield
point for q0¼80 MPa occurring at the highest stress. It is
clear that the yield stress in one-dimensional compression, for a given initial voids ratio and grading, is proportional to the strength of individual grains, which agrees with the proposition first made by McDowell & Bolton (1998). Just how influential the individual grain strengths are is further demonstrated in the graph showing the normalised stress values (ó/q0), in which the compression lines coincide (Fig.
8(b)). As one would expect, the weaker assemblies exhibit 0·2
0·3 0·4 0·5 0·6 0·7 0·8 0·9
0·1 1 10 100
V
oids r
a
tio
,
e
[image:4.595.64.291.295.448.2]Stress, : MPaσ
Fig. 5. One-dimensional compression plot for simulation of silica sand
0 10 20 30 40 50 60 70 80 90 100
0·01 0·1 1 10
Mass finer than: %
Particle size, : mmd 0 MPa
10 MPa 14 MPa 18 MPa 22 MPa 26 MPa 30 MPa
Fig. 6. Evolving particle distribution for simulation of silica sand
1 mm 1 mm 1 mm
(c)
(a) (b)
Fig. 7. Numerical sample: (a) before compression; (b) after 100 MPa; (c) view of virtual cutting plane through sample, across several scales
[image:4.595.73.540.500.745.2]more breakage for the same magnitude of stress (30 MPa); a more well-graded aggregate has evolved in Fig. 9.
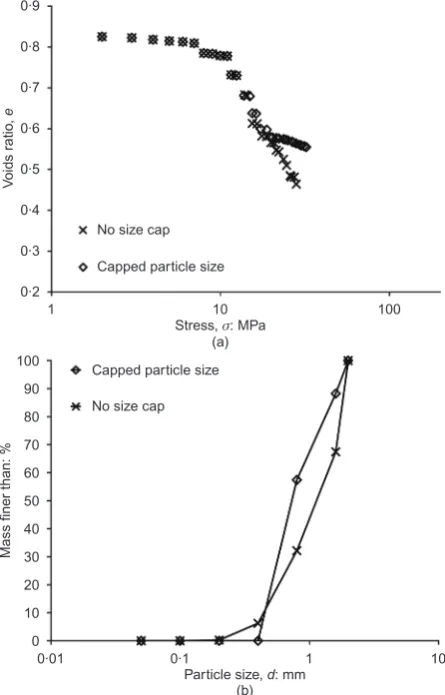
For real soils subjected to one-dimensional clastic com-pression, the compression line is commonly observed to experience a change in curvature at very high stresses (e.g. McDowell, 2002). This is usually attributed to the largest particles being well protected by many neighbours, which means that low tensile stresses are induced, and to the smallest particles reaching the comminution limit, which means that fracture is no longer possible. Repeating the initial simulation (using parameters for the silica sand) but
limiting the smallest permitted particle size reveals similar results. Capping the smallest particle size ds at 0.5 mm
(25% of d0) (i.e. particles of size ds have infinite strength)
[image:5.595.47.272.55.397.2]results in the compression line and grading curve shown in Fig. 10 alongside those from the initial simulation. The comminution limit clearly causes a change in curvature of the compression line at high stresses. The grading curve reveals the slightly different nature of the evolving material. As one would expect, the grading curve for the material with a finite minimum size curtails to 0% passing at a larger diameter than the uncapped material. The increasing quantity of unbreakable small particles necessitates the larger parti-cles breaking, which is also evident in the grading curve. For a vertical applied stress of 30 MPa, the uncapped material has a greater percentage of particles larger than 0.8 mm and 1.6 mm than the material with a comminution limit.
As mentioned, the primary simulation became unsupporta-ble when low voids ratios were reached, which was the case for the following simulations, where it was not possible to achieve macroscopic stresses as high as in the experimental work (e.g. 100 MPa).
Owing to the monodispersity and lack of particle shape, it is difficult to conduct oedometer tests at different voids ratios. However, Fig. 11 compares the initially monodisperse simulation with another featuring a particle size distribution. Both simulations have the same strength parameters (q0¼37.5 MPa, m¼3.3), assumed hardening law (equation
(4)) and median grain size (d50¼2 mm); however, the
graded sample has a coefficient of uniformity cu of 1.5,
giving minimum and maximum initial grain sizes of 1.3 mm 0·2
0·3 0·4 0·5 0·6 0·7 0·8 0·9
1 10 100
V
oids r
a
tio
,
e
Stress, : MPa (a)
σ
37·5 MPa
60·0 MPa
80·0 MPa
0·2 0·3 0·4 0·5 0·6 0·7 0·8 0·9
0·001 0·01 0·1 1 10
V
oids r
a
tio
,
e
Normalised stress, / (b)
σq0 37·5 MPa
60·0 MPa
[image:5.595.307.530.401.749.2]80·0 MPa
Fig. 8. One-dimensional compression plots for: (a) various
particle strengthsq0; (b) vertical stressónormalised by particle
strengthq0
0 10 20 30 40 50 60 70 80 90 100
0·01 0·1 1 10
Mass finer than: %
Particle size, : mmd 37·5 MPa
60·0 MPa
80·0 MPa
Fig. 9. Particle distributions at vertical stress of 30 MPa for various initial particle strengths
0·2 0·3 0·4 0·5 0·6 0·7 0·8 0·9
1 10 100
V
oids r
a
tio
,
e
Stress, : MPa (a)
σ
No size cap
Capped particle size
0 10 20 30 40 50 60 70 80 90 100
0·01 0·1 1 10
Mass finer than: %
Particle size, : mm (b)
d No size cap
[image:5.595.47.276.586.750.2]Capped particle size
and 3.0 mm respectively, starting with 820 initial particles. The sample is again generated in a random dense state, resulting in an initial voids ratio lower than the monodis-perse sample. The compression lines have similar yield points, but more significantly they appear to have the same slope, which agrees with experimental observations (e.g. Nakata et al., 2001a; McDowell, 2002) where, for a given sand, the plastic compressibility index is a constant indepen-dent of initial grading.
Simulations have been performed on monodisperse assem-blies with the same initial size d0 and strength q0, but with
various Weibull moduli. Decreasing the modulus increases the variability in strength, and also governs the assumed size-hardening law according to equation (4). With d0¼2 mm andq0¼37.5 MPa, q0 is plotted as a function of
particle size for various values of Weibull modulus that are related to the slope of the lines in Fig. 12, according to equation (4). The resulting normal compression lines and the ensuing particle size distributions as a function of applied stress for assemblies with varying Weibull moduli are shown in Fig. 13.
It is apparent from the normal compression curves that, for a given initial value of q0, the Weibull modulus dictates
the rate of onset of yielding (the maximum curvature of the plot). Furthermore, because it has been assumed to control the hardening law (equation (4)), it also affects the gradient of the normal compression line following yield. As the
modulus decreases, there is more variation in particle strengths for any given particle size. This means a portion of weaker particles, and hence the earlier onset of yielding and a less well-defined yield point.
The modulus of 4.0 means a fairly narrow distribution of strengths, which explains why this simulation demonstrated the latest and most sudden yielding. It also reduces the hardening effect (i.e. d reduces more rapidly with increasing stress), and so has the steepest normal compression line and most overall breakage. The final number of particles is greater than for all lower values of m. The lowest modulus, m¼1.0, shows some very early breakage, but a more gradual, early yield point followed by a shallower normal compression line. The grading curves reveal that the lowest modulus exhibits fewest breakages and the least developed grading; the highest modulus displays the most breakage and an evolved grading curve. Because the hardening law in equation (4) has been assumed, m governs both the rate of onset of yield and the plastic compressibility index, which will be separated later in the paper.
A lower modulus implies material ‘disorder’. Considering critical flaw size, with regards to Griffith’s law (Griffith, 1920), high Weibull moduli would imply that, as grain size decreases, the size of the critical flaw becomes a higher proportion of the particle, meaning a narrower overall dis-tribution of critical flaws (and critical stress) and less variability, regardless of particle size. A low modulus im-plies, however, that as particle size increases, the critical flaw size increases at a greater rate (suggesting an upper limit of particle size), and resulting in much more variation in critical flaw size and fracture stress.
0·2 0·3 0·4 0·5 0·6 0·7 0·8 0·9
1 10 100
V
oids r
a
tio
,
e
Stress, : MPaσ
Monodisperse
[image:6.595.61.289.42.219.2]Graded
Fig. 11. Effects of different gradings on compression plot
10 100 1000 10000
0·01 0·1 1
Strength,
: MP
a
q0
Particle size, : mmd q
d 0
0
37·5 MPa 2 mm
⫽ ⫽
m⫽1·0
m⫽2·0
m⫽3·3
[image:6.595.321.546.52.400.2]m⫽4·0
Fig. 12. Strength as a function of size for various Weibull moduli with initial strength 37.5 MPa, using the hardening law in equation (4)
0·2 0·3 0·4 0·5 0·6 0·7 0·8 0·9
1 10 100
V
oids r
a
tio
,
e
Stress, : MPa (a)
σ
m⫽4·0
m⫽3·3
m⫽2·0
m⫽1·0
m⫽4·0
m⫽3·3
m⫽2·0
m⫽1·0
0 10 20 30 40 50 60 70 80 90 100
0·01 0·1 1 10
Mass finer than: %
Particle size, : mm (b)
d
Fig. 13. (a) One-dimensional compression plots and (b) particle size distributions at 25 MPa for various Weibull moduli
[image:6.595.63.291.578.741.2]Alternative breakage mechanisms
Two alternative breakage mechanisms have been explored: splitting into three and four equal fragments. For these mechanisms the new particles created overlap, and are completely within the boundary of the original particle. This is similar to some of the investigative work performed by Ben-Nun & Einav (2010), except in three dimensions and with different breakage criteria and mechanisms. Ben-Nun & Einav explored three breakage configurations: splitting into three, five and six particles, in each case randomly oriented. However, the kinematic constraints of this process are very different in three dimensions.
When splitting into three fragments (trilateral breakage), the emergent particles are placed at equal distance from one another and from the centre of mass of the original particle (Fig. 14(a)). One emergent particle is placed in the direction
of the major principal stress, while the axis connecting the centres of the two other emergent particles lies in the direction of the minor principal stress. The three fragments move outwards, along the lines connecting their centres of mass to that of the original parent particle.
For the case of splitting into four equal fragments (quad-rilateral breakage), the emergent particles are placed in an equal quadrilateral arrangement, aligned with the major and minor principal stress axes. The overlap causes the particles to move outwards radially from the central point, in equal directions in the minor–major stress plane (Fig. 14(b)). The same initial sample was used, with d0¼2 mm and m¼3.3,
and an initial strength ofq0¼37.5 MPa.
As can be seen in Fig. 15, there is not much difference in the normal compression lines; which appear to have very similar yield points and the same gradient. This suggests that the manner of breakage does not alter the normal compression line, which depends only on the particle strength as a function of size, which is a material constant. This seems logical, when it is well known that various densities of the same material converge upon the same normal compression line (e.g. McDowell, 2002). The fact that the breakage mechanisms have little or no effect on the compression lines would imply that they also have little effect on the grading curves at a given stress. As can be seen in Fig. 15(b), this seems consistent; there is not much effect on the particle size distributions, but they are not fully evolved, so it is difficult to confirm categorically that this is the case. Ben-Nun & Einav (2010) reported that changing the breakage configuration did change the final grain size 1
1
3 3
(a)
1
1
3 3
[image:7.595.47.275.254.736.2](b)
Fig. 14. Various splitting mechanisms: (a) ‘trilateral’ (splitting into three equal particles); (b) ‘quadrilateral’ (splitting into four particles)
0·2 0·3 0·4 0·5 0·6 0·7 0·8 0·9
1 10 100
V
oids r
a
tio
,
e
Stress, : MPa (a)
σ
Bilateral
Trilateral
Quadrilateral
Bilateral
Trilateral
Quadrilateral
0 10 20 30 40 50 60 70 80 90 100
0·01 0·1 1 10
Mass finer than: %
Particle size, : mm (b)
d
Fig. 15. (a) One-dimensional compression plots for various
[image:7.595.311.531.393.740.2]distributions with regards to the fractal dimension, although this was in two dimensions, where the kinematic constraints are very different.
Alternative hardening laws
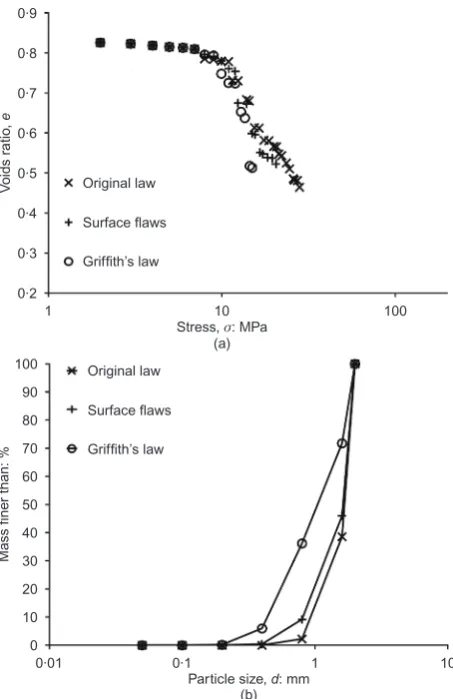
It seems rational to investigate size-hardening laws that are independent of the Weibull modulus, isolating the size effect from the distribution of strengths. Two additional alternatives have been employed. Each hardening law has its own degree of justification; however, the purpose here is to determine the sole effects that the size-hardening law has on normal compression, rather than which provides the most realistic results.
The first alternative assumes that surface-initiated flaws dominate fracture. This would mean that the surface area of a particle is the influential factor instead of volume. Using Weibull statistics, as before, leads to the relationship
q0/d2=m (5)
The second alternative is based on Griffith’s law of fracture mechanics (Griffith, 1920). Assuming that the size of the critical flaw, a, in a particle is proportional to its size (i.e. a/d), Griffith states that the fracture stress is proportional to the square root of the flaw size, so we can say
q0/d1=2 (6)
Using strength and size parameters as before (q0¼37.5 MPa, d0¼2 mm, and m¼3.3), it is possible to
compare the various size-hardening laws for a given initial distribution of strengths. Fig. 16 shows the corresponding normal compression lines and final grading curves for the three laws described above. For the alternative hardening rules (i.e. equations (5) and (6)), plastic compressibility changes for a given Weibull modulus. This resulted in so much particle breakage and reduction in voids ratio that it was not always possible to reach high stresses. This is evident in the normal compression graph: if the compression lines remained linear they would approach very low voids ratios before reaching 100 MPa. In reality, the compression line would undergo a change in curvature due to the comminution limit, as discussed earlier. All three compres-sion lines have the same yield point and rate of onset of yield, because the Weibull modulus is the same. This confirms that the initial distribution of strengths determines the nature of yielding. It is evident that Griffith’s hardening law, which gives the smallest size effect on particle strength, gives the steepest compression line. When a particle breaks in the simulation with the original hardening law (equation (4)), the new fragments have higher strengths than in the other two simulations, giving the compression line a shal-lower gradient, as larger stresses are required to break particles and reduce the voids ratio. This shows that it is the hardening law exclusively that determines the slope of the compression line. This is consistent with what was observed in Fig. 13 when changing the modulus, but this time without altering the strength distribution. If one considers the ex-treme case where particle sizes of all sizes have equal strengths, this would lead to a catastrophic collapse in void volume after yield.
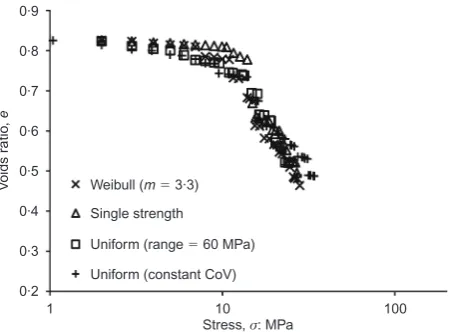
Alternative strength distributions
Continuing to separate the dual effects of the hardening law and strength distribution, it is possible to vary the distribution of strengths for a given size of particle while keeping the size effect on strength constant. Using the
assumed law from equation (4), with a modulus of 3.3, simulations were conducted using alternative distributions of particle strengths, so that Weibull cannot be deemed to be essential for normal compression. The variance of the dis-tribution of initial strengths determines the rate of onset of yield, and to establish whether non-Weibullian distributions have the same effect, different distributions have been employed. Two dissimilar uniform distributions of strengths were used, as well as a simulation using a single particle strength. All distributions (including single strength) had the same initial mean strength and size-hardening law. The mean value of strength,qm, for a Weibull distribution is given by
qm¼q0ˆ
1 mþ1
(7)
where ˆ is the gamma function. Values of m¼3.3 and q0¼37.5 MPa give a mean strength of 33.6 MPa, so the
non-Weibullian distributions are given this average initial strength to enable comparison. Because qm/q0, average strength has
the same hardening law. That is to say, for each strength distribution, including a single strength as a function of size, it was assumed that
qm/d3=3
:3
(8) For the first alternative, the particle strengths for a single particle size satisfy a uniform distribution with a fixed range of 60 MPa: that is, for particles of size d, crushing strengths lie within the range qm,d30 MPa. The second alternative
simulation also makes use of uniform distributions, but with 0·2
0·3 0·4 0·5 0·6 0·7 0·8 0·9
1 10 100
V
oids r
a
tio
,
e
Stress, : MPa (a)
σ
Original law
Surface flaws
Griffith’s law
0 10 20 30 40 50 60 70 80 90 100
0·01 0·1 1 10
Mass finer than: %
Particle size, : mm (b)
d Original law
Surface flaws
[image:8.595.320.547.50.400.2]Griffith’s law
Fig. 16. Effects of alternative hardening rules on (a) compression line and (b) particle size distributions for a given stress
a constant coefficient of variation, so that the standard deviation in particle strength for a given size is proportional to its mean, with a minimum strength of 0 MPa.
The normal compression lines for these three simulations, along with the simulation using a Weibull distribution of strengths, are given in Fig. 17. As expected, all simulations display the same slope at high stresses (about 0.5). The lines appear to converge, although there is a slight deviation exhibited by the simulation with varying range (constant coefficient of variation). Clearly, the distribution of strengths governs the rate of onset of yield, but it is the average strength as a function of particle size that governs the slope of the normal compression line. All plots have approxi-mately equal slopes at 30 MPa. The simulation with single particle strengths for a given size shows the latest, most sudden onset of yield before a sharp reduction in voids ratio. This is consistent with experiments on glass beads, which tend to have a low variability in strength (m6) and uniform grading (Nakata et al., 2001b). The two simulations with uniformly distributed strengths undergo a more gradual onset of yielding, as does the simulation with strengths satisfying a Weibull distribution.
Fractal distributions
Inspecting the respective particle size distribution suggests that fractal distributions have emerged. A fractal distribution is one such that
N Lð .dÞ /dD (9)
where N is the number of particles of size L greater than size d, and D is the fractal dimension (Turcotte, 1986). The nature of this equation means that a fractal distribution would appear linear on a distribution plot with two logarith-mic axes, with the fractal dimension emerging as the slope. Most granular materials (not only soils but also materials such as fault gouge and ice) under pure crushing evolve towards a distribution with a fractal dimension between 2.0 and 3.0, remarkably usually about 2.5 (Turcotte, 1986; Sammis et al., 1987; Palmer & Sanderson, 1991; Steacy & Sammis, 1991; McDowell & Daniell, 2001), with two-dimensional materials developing a dimension between 1.0 and 2.0. The simulations of Ben-Nun & Einav (2010) resulted in fractal dimensions of around 1.2–1.4 for discs.
Considering only the initial sample with silica sand para-meters (d0¼2 mm, q0¼37.5 MPa,m¼3.3), as this
simula-tion has the most fully evolved grading, it certainly appears that a fractal distribution has emerged. The number of
particles by percentage with a larger diameter is plotted against diameter on a logarithmic scale in Fig. 18. The curves appear exponential. These data are plotted again with the percentage by number of particles also on a logarithmic axis in Fig. 19, and the linearity implies fractal geometry. The slope becomes steeper (i.e. the fractal dimension in-creases) with increasing stress, with the slope appearing to become constant, indicating that a steady value has been reached. As the stress increases, the linear portion of the curve from which the fractal dimension can be obtained increases in length, suggesting a more reliable value. The final slope (30 MPa) gives a value of D¼2.5, which is encouraging, considering what is observed for natural gran-ular materials. Plotting the absolute number of particles (also on a logarithmic axis) against diameter, in Fig. 20, shows that it is almost solely the smallest particles that are fractur-ing as the stress is increased. Despite encompassfractur-ing approxi-mately 20 000 particles, the final distribution covers only approximately one log cycle of sizes, which should be considered a narrow range. In Ben-Nun & Einav’s two-dimensional analysis (Ben-Nun & Einav, 2010), their final distributions spanned almost two log cycles.
McDowell & Daniell (2001) investigated why a value of about 2.5 consistently emerges for soils and other granular materials. They analysed simulations from Steacy & Sammis (1991), which featured arrays of uniform blocks with various fragmentation mechanisms. Using a deterministic mechanism such that no neighbouring blocks could exist at the same size as each other resulted in a fractal dimension of 2.6. The
0·2 0·3 0·4 0·5 0·6 0·7 0·8 0·9
1 10 100
V
oids r
a
tio
,
e
Stress, : MPaσ
Weibull (m⫽3·3)
Single strength
Uniform (range⫽60 MPa)
[image:9.595.303.535.376.540.2]Uniform (constant CoV)
Fig. 17. Plastic compression response for simulations with same mean particle strength (33.6 MPa) and various strength distribu-tions
0 10 20 30 40 50 60 70 80 90 100
0·01 0·1 1 10
Number of
par
tic
les larg
er
: %
Particle size, : mmd 10 MPa
[image:9.595.49.275.575.741.2]12 MPa 14 MPa 16 MPa 18 MPa 20 MPa 22 MPa 24 MPa 26 MPa 28 MPa 30 MPa
Fig. 18. Evolving particle size distribution from simulation of silica sand
0 50 100
0·01 0·1 1 10
Number of
par
tic
les larg
er
: %
Particle size, : mmd 10 MPa
12 MPa 14 MPa 16 MPa 18 MPa 20 MPa 22 MPa 24 MPa 26 MPa 28 MPa 30 MPa
[image:9.595.303.535.585.751.2]criteria for what defined two blocks to be considered ‘neigh-bouring’ were investigated by Steacy & Sammis (1991), as well as giving blocks a probability of failure dependent on the number of same-sized neighbours. Also investigated was the effect of a ‘stress bias’, which rendered particles more vulnerable to breakage if near a previous breakage. These different permutations resulted in fractal dimensions between 2.0 and 2.9. McDowell & Daniell (2001) drew attention to the fact that a value of 2.5 emerged when neighbouring blocks were defined as blocks having finite contact area, and a ‘stress bias’ influenced the probability of fracture, although it should be recognised that this was using cubes.
Hence it would seem worthwhile to examine neighbouring particles after undergoing one-dimensional compression. De-fining neighbouring particles simply as two particles that are in direct contact (i.e. there exists an overlap and force acting between them), it is possible to observe how many same-sized particles are neighbours. The number of neighbouring particles of equal size, in terms of percentage of total particles in contact, is plotted against macroscopic vertical stress in Fig. 21 for the original simulation based on data for silica sand. For the initially uniform sample, all contacts are between equal-sized particles; after loading to 30 MPa, approximately 15% of all contacts are between particles of the same size. This value appears to exhibit little change after about 15 MPa, suggesting a steady condition. This is not quite the 0% speculated by Steacy & Sammis (1991), but it seems very reasonable when recognising that particles are considered most vulnerable when loaded by neighbouring particles of the same size, as this allows the particle to be loaded at opposite poles, inducing the maximum tensile stress. If this graph is compared with Fig. 22, which shows the fractal dimensions derived from the progressive grading curves for the same simulation, it shows a similar develop-ment under increasing stress: the fractal dimension reaches 2.5 when the number of same-sized neighbours reaches a minimum.
However, more is revealed by examining the contacts within the final crushed sample with regard to individual particle sizes. The particles can be described in terms of their hierarchical ‘rank’, or size, with the largest (initial) particle size d0, and fragmentation producing subsequent
particle sizes d1,d2, . . ., ds, where ds is the smallest. After
compression, there are approximately 202 largest particles, size d0, which have an average of 22.2 contacts each. For
these 202 particles, the number of particles having one or more same-sized neighbours is 163, giving an average num-ber of contacts with same-sized neighbours of 1.4. The
remaining contacts are with smaller grains, as no larger particles exist. Considering the next sizes of particles (d1, d2, . . ., d8), each rank increases in quantity as the
particle size decreases, with approximately 3000 particles of size d8 (0.32 mm). As one would expect, the average total
number of contacts per ball reduces with decreasing particle size. However, interestingly, what remains constant is the number of contacts with particles of equal or larger size. Particles of all these sizes have an average of approximately two contacts with particles of equal or larger diameter. This number remains constant across the range of sizes, while the average number of contacts with smaller particles, and hence the average total number of contacts per ball, decreases steadily with reducing particle size. This apparent self-similarity is also visible in Fig. 7(c), where similar random packing is visible across the scales. These observations imply that the particle size distribution is indeed fractal in character, at least across the intermediate range of the discrete distribution. The subsequent ranks of particles (i.e. d9,d10,. . ., up tod32) decrease in number and have not fully
evolved, with just four particles of size d32¼0.0012 mm.
It appears that it is breakage of particles that are primarily loaded by same-sized or larger particles that leads to a stable, fractally distributed material. In this model, almost all particles – regardless of rank – have an average of two contacts with equally sized or larger particles; however, the smallest particles have far fewer total contacts, and are therefore much more likely to have a high induced octahe-dral shear stress and continue to fracture as stress increases, leading to a fractal distribution of particle sizes, apparently tending towards an ultimate fractal dimension of 2.5.
With regard to the effect of a ‘stress bias’, there is almost certainly an influence when a single particle breakage is 1
10 100 1000 10 000 100 000
0·01 0·1 1 10
Number of
par
tic
les larg
er
: %
Particle size, : mmd
[image:10.595.59.290.44.215.2]10 MPa 12 MPa 14 MPa 16 MPa 18 MPa 20 MPa 22 MPa 24 MPa 26 MPa 28 MPa 30 MPa
Fig. 20. Evolving particle size distribution from simulation of silica sand plotted using absolute number of particles on double logarithmic axes
0 0·5 1·0 1·5 2·0 2·5 3·0
0 5 10 15 20 25 30 35
F
ractal dimension,
D
Stress, : MPaσ
Fig. 22. Fractal dimension as a function of stress
0 10 20 30 40 50 60 70 80 90 100
0 5 10 15 20 25 30 35
Same-siz
ed neighbour
s: %
[image:10.595.318.548.45.201.2]Stress, : MPaσ
Fig. 21. Percentage of equally sized neighbouring particles as a function of stress
[image:10.595.317.548.246.394.2]considered. The vertical load that was carried through the original particle will be apportioned to the surrounding particles, causing an increased stress concentration in the surrounding area. The simulations performed by Steacy & Sammis (1991) did not involve loading the array of blocks, which is why they deemed it necessary to implement an artificial influence. It seems sensible to assume there is such an influence in a loaded, stress-controlled simulation. For a single incidence of breakage, scanning the new fragments reveals that usually between 20% and 30% of them are within two radii distance of a particle that broke on the previous occasion, which supports this idea.
Loge–logóplot
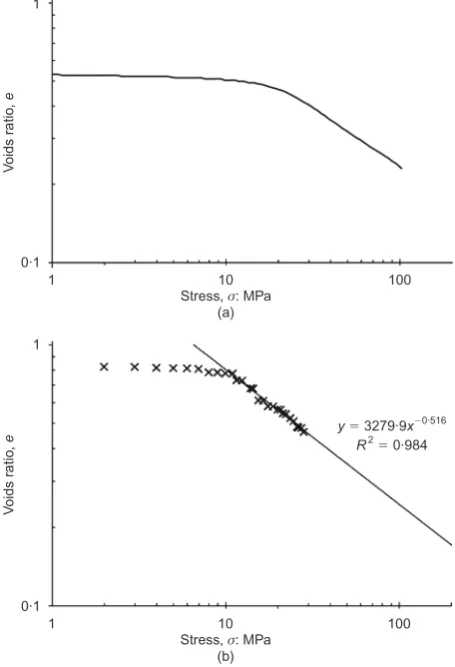
A double logarithmic plot was suggested by Pestana & Whittle (1995), who described typical values for the compres-sion slope for sand lying between 0.30 and 0.50, usually towards the upper limit of 0.5. The compression line for silica sand from McDowell (2002) has a slope of 0.46 (0.5) when plotted on double logarithmic axes. The simulation in this paper using the data of McDowell’s silica sand has a corre-sponding slope of 0.5, which shows significant agreement, and both are within the correct range (see Fig. 23).
McDowell (2005) justified the use of a double logarithmic plot, and went on to validate the slope of the compression line physically using fractal crushing theory. McDowell used an assumed fractal dimension of 2.5, which is what many granular materials evolve to under pure crushing (McDowell & Daniell, 2001). The plots show fractal dimensions in good agreement with this, and from Fig. 22 one might assume that the value of 2.5 remains consistent at higher stress levels with further crushing. Assuming a value of 2.5,
McDowell (2005) showed that, for a granular material with strengths forming a Weibull distribution with a modulus of about 3, the slope of the normal compression line should be about 0.5 on a loge–logóplot.
Following McDowell, assuming a fractal dimension of 2.5, from equation (9) we can say that the number of particles N greater than or equal to a sizedi is given by
N Lð >diÞ /d2
:5
i (10)
Considering again a hierarchical splitting model, with largest (initial) particle size d0, and subsequent broken particle sizes d1, d2, . . ., ds, the distribution of discrete sizes can be
approximated to be fractal if it covers a wide range of scales (Turcotte, 1986; Palmer & Sanderson, 1991). Using equation (10) and considering the next smaller size of particle diþ1,
we can write
N Lð >diþ1Þ /d2
:5
iþ1 (11)
Subtracting gives the number of particles with size equal to diþ1
N Lð ¼diþ1Þ ¼N Lð >diþ1Þ N Lð >diÞ (12)
This can be written
N Lð ¼diþ1Þ ¼N Lð >diþ1Þ 1 di diþ1
/d2iþ1:5(1n1=3) (13) where n is the number of fragments produced by each fracture, and is constant. Equation (13) implies a constant probability of fracture between each size (Turcotte, 1986; Palmer & Sanderson, 1991). This is sensible, because the normal compression lines have been shown to be indepen-dent of the distribution of strengths for a given particle size, and therefore the probability of fracture must be dominated by the loading geometry, as discussed earlier. It can be inferred that for the smallest size (i.e. particles of size ds),
some of which will break when stress is increased (a proportion of each particle size in the hierarchical splitting model remains as stress increases; this is what gives the fractal distribution)
N Lð ¼dsÞ /d2
:5
s (14)
which, considering volume, leads to V Lð ¼dsÞ ¼N Lð ¼dsÞd3s/d
0:5
s (15)
The size of the smallest particle is a function of stress level according to the assumed hardening law for the soil. Recal-ling the original hardening law in equation (4), rewritten for the smallest particles as
qm/d3s =m (16)
and given that the current macroscopic stress ó is propor-tional to the average strength of the smallest grains, rearran-ging and substituting equation (16) into equation (15) gives
V Lð ¼dsÞ /óm=6 (17)
McDowell (2005) proposed that the void space is dominated by the smallest particles (it is well known, for example, that soil permeability is governed by the smallest particle sizes; Hazen, 1911). McDowell proposed, and justified in terms of the implied particle kinematics, that the void space is proportional to the total volume of the smallest particles 0·1
1
1 10 100
V
oids r
a
tio
,
e
Stress, : MPa (a)
σ
0·1 1
1 10 100
V
oids r
a
tio
,
e
Stress, : MPa (b)
σ
y x
R 3279·9
0·984
⫽ ⫽
[image:11.595.47.275.418.752.2]⫺0·516 2
Fig. 23. Compression plots for silica sand plotted on loge–logó
once a fractal distribution has emerged. In this case, equa-tion (17) implies
e/óm=6 (18)
A power law in this form makes sense when one considers that the void space is dependent on the smallest particle size. The smallest particle must in turn be related to the stress level according to the size effect on strength – which is a power law, and is assumed in this case to be governed by the Weibull modulus. The void space should therefore be a power function of stress, giving a linear normal compres-sion line on double logarithmic axes.
The value of 3.3 used in the simulations can, for all intents and purposes, be considered equivalent to the value of 3 for which McDowell (2005) attained a slope of 0.5. Using the same approach for the assumed hardening law in equation (4), materials with Weibull moduli of about 4, 3, 2 and 1 should have slopes equal to approximately 0.7, 0.5, 0.3 and 0.2 respectively, according to equation (18). The normal compression lines are plotted in Fig. 24 for the range of m values used in the above simulations. For moduli of approximately 4, 3, 2 and 1, the slopes are 0.7, 0.5, 0.3 and 0.2 respectively. These values agree with the values pre-dicted using McDowell’s physical justification. All the lines appear linear, confirming a power law.
Pestana & Whittle (1995) supposed that sands should have a slope in the region of 0.3–0.5, which, assuming the original hardening law is applicable (equation (4)), would correspond to a material with crushing strengths obeying Weibull statistics with a modulus in the range 1.8–3.0. This fits data from the literature: typical values of m for various sands are in the region 1.5 to 3.3 (e.g. Nakata et al., 2001b; McDowell, 2001).
Considering the alternative hardening laws, if surface flaws are alleged to dominate fracture and equation (5) is assumed, then the following relationship can be arrived at in a similar fashion to above
e/óm=4 (19)
Conversely, if the other alternative hardening relationship is used, assuming Griffith’s law, we obtain the relationship
e/ó1 (20)
These would predict slopes of about 0.8 and 1.0 for the former and latter hardening laws respectively, and Fig. 25 appears encouraging, indicating similar values for the slopes,
although the compression lines cannot be considered long enough to confirm this is the case.
It has therefore been shown that the plastic compressibil-ity of granular materials is solely a function of the size effect on particle strength. This has implications for the prediction for compressibility of aggregates comprising very large particles. For example, if one is interested in the compressibility of a rockfill dam, then by crushing individual rocks and obtaining the size effect on strength, one would be able to predict the compressibility.
If particle strengths are related to size by a law in the form
q0/db (21)
and one-dimensional compression can be described by the following equation
loge¼loge0Clogó (22)
we have shown that the compressibility indexCis a function of the parameter b: C¼f(b). Specifically, the following relationship can be inferred from the physical justification by McDowell (2005) and results of simulations with various assumed hardening laws.
C¼ 1
2b (23)
Hence the end result is that, for the first time, we have the following equation for the normal compression line
loge¼loge0
1
2blogó (24)
where b controls the particle size effect on strength. Strictly speaking, to be dimensionally consistent, we should write
loge¼logey
1 2blog
ó óy
(25)
where ey is the value on the linear log-log plot at a stress
corresponding to the yield stress óy, and óy is proportional
to the average particle strength.
In addition, for the first time, simulations in three dimen-sions have used a reasonable number of particles, which holds much promise for use in boundary value problems.
CONCLUSIONS
The discrete element method has been used to simulate one-dimensional compression and investigate particle crush-0·1
1
1 10 100
V
oids r
a
tio
,
e
Stress, : MPaσ
m⫽1·0
m⫽2·0
m⫽3·3
m⫽4·0
y
x
10·145
⫽ ⫺0·158
y x 62·307 ⫽
⫺0·271
y
x 3279·9
⫽
⫺0·516 y
x 39·379
⫽
[image:12.595.323.548.57.213.2]⫺0·688
Fig. 24. Compression lines on double logarithmic plot for
q0 37.5 MPa and various Weibull moduli, assuming hardening
law in equation (4)
0·1 1
1 10 100
V
oids r
a
tio
,
e
Stress, : MPaσ
Original law
Surface flaws
[image:12.595.60.291.580.741.2]Griffith’s law
Fig. 25. Compression plots for various hardening laws using double logarithmic axes
ing and the evolution of fractal particle size distributions. Particle fracture has been simulated using a range of very simple mechanisms, replacing the breaking particle with new smaller particles while maintaining constant mass. Pre-viously, only agglomerates have been used to simulate particle crushing in three dimensions during compression; these demand a very large number of initial particles and bonds. Particle fracture was governed by the octahedral stress within a particle, which takes into account multiple contacts, and has been related to data measured from single particle crushing tests.
Normal compression lines are clearly observed, and the observed slope is consistent with the theoretical prediction. For an initially uniform particle size, the rate of onset of yield is a function of the distribution of particle strengths. For an initial voids ratio and given Weibull modulus (coeffi-cient of variation), the yield stress is proportional to the average particle octahedral shear strength. The slope of the normal compression line and the particle size distribution appear to be independent of the breakage mechanism or the distribution of strengths, and dependent solely on the size effect on average particle strength. It is now clear, for the first time, that the plastic compressibility index is simply the hardening law due to the smallest particles breaking and becoming statistically stronger. This has implications for the prediction of the compressibility of aggregates comprising large particles.
The evolution of a fractal particle size distribution appears to be triggered by the tendency of similar-sized neighbouring particles to fracture. The results show clearly that a fractal distribution of particle sizes emerges, with a fractal number of 2.5. The simulations also show the correct behaviour if a comminution limit is included, such that the compressibility index reduces at high stresses.
The compression lines have also been plotted in log e– logó space; the prediction for silica sand shows agreeable similarity to the experimental results, and the slope is in agreement with both the experiment and McDowell’s (2005) theoretical prediction.
The overall results show encouraging similarity with widely reported physical behaviour. Given that the simplest assumptions have been made (particles split according to octahedral shear stress, and the fragments move in the direction of the minor principal stress), the resulting simula-tions have shown an insight into one-dimensional compres-sion and replicated this process correctly in three dimensions for the first time. It would appear that the micro mechanics of normal compression have finally been ex-posed.
The model holds much promise in the application to solving boundary value problems, now that agglomerates are not required to simulate the crushing process.
NOTATION
a critical flaw size
b size effect on strength for a material
C slope of normal compression line in loge:logóspace
cu coefficient of uniformity D fractal dimension
d particle size (diameter)
d0 initial particle size ds smallest particle size
e voids ratio
ey voids ratio corresponding to yield stress on linear loge–logó
plot
F force
G shear modulus
L particle size
m Weibull modulus
N number of particles
q octahedral shear stress in a particle
qm mean octahedral shear stress
q0 value of octahedral shear stress such that 37% of particles are
stronger for a given particle size
V volume of particles ˆ gamma function ó stress
ó1 major principal stress in particle
ó2 intermediate principal stress in particle
ó3 minor principal stress in particle
óy yield stress on loge–logó plot
REFERENCES
Ashby, M. F. & Jones, D. R. (1986). Engineering materials 2: An introduction to microstructures, processing and design. New York, NY, USA: Pergamon Press.
A˚ stro¨m, J. A. & Herrmann, H. J. (1998). Fragmentation of grains in a two-dimensional packing.Eur. Phys. J. B5, No. 3, 551–554. Ben-Nun, O. & Einav, I. (2010). The role of self-organization
during confined comminution of granular materials. Phil. Trans. R. Soc. A368, No. 1910, 231–247.
Ben-Nun, O., Einav, I. & Tordesillas, A. (2010). Force attractor in confined comminution of granular materials. Phys. Rev. Lett.
104, No. 10, 108001, http://dx.doi.org/10.1103/PhysRevLett.104. 108001.
Bolton, M. D., Nakata, Y. & Cheng, Y. P. (2008). Micro- and macro-mechanical behaviour of DEM crushable materials. Ge´o-technique 58, No. 6, 471–480, http://dx.doi.org/10.1680/geot. 2008.58.6.471.
Cheng, Y. P., Nakata, Y. & Bolton, M. D. (2003). Discrete element simulation of crushable soil. Ge´otechnique53, No. 7, 633–641, http://dx.doi.org/10.1680/geot.2003.53.7.633.
Cundall, P. & Strack, O. (1979). A discrete numerical model for granular assemblies. Ge´otechnique 29, No. 1, 47–65, http:// dx.doi.org/10.1680/geot.1979.29.1.47.
Daniels, H. E. (1945). The statistical theory of the strength of bundles of threads. I.Proc. R. Soc. London Ser. A183, No. 995, 405–435.
Einav, I. (2007). Fracture propagation in brittle granular matter.
Proc. R. Soc. London Ser. A.463, No. 2087, 3021–3035. Griffith, A. A. (1920). The phenomena of rupture and flow in
solids. Phil. Trans. R. Soc. London A221, No. 582–593, 163– 198.
Hazen, A. (1911). Discussion of ‘Dams on sand foundations’ by A. C. Koenig.Trans. Am. Soc. Civ. Engrs73, 199–203.
Itasca (2005). Particle flow code in three dimensions: Software manual. Minnesota, MN, USA: Itasca Consulting Group Inc. Jaeger, J. C. (1967). Failure of rocks under tensile conditions.Int. J.
Rock. Mech. Min. Sci. Geomech. Abstr.4, No. 2, 219–227. Jellinek, H. H. (1958). The influence of imperfections on the
strength of ice.Proc. Phys. Soc.71, No. 5, 797–814.
Lim, W. L., McDowell, G. R. & Collop, A. C. (2004). The application of Weibull statistics to the strength of railway ballast.Gran. Matter6, No. 4, 229–237.
Lobo-Guerrero, S. & Vallejo, L. E. (2005). Crushing a weak granular material: experimental numerical analyses. Ge´otech-nique 55, No. 3, 245–249, http://dx.doi.org/10.1680/geot.2005. 55.3.245.
McDowell, G. (2001). Statistics of soil particle strength. Ge´otech-nique 51, No. 10, 897–900, http://dx.doi.org/10.1680/geot.2001. 51.10.897.
McDowell, G. R. (2002). On the yielding and plastic compression of sand.Soils Found.42, No. 1, 139–145.
McDowell, G. R. (2005). A physical justification for loge–logó based on fractal crushing and particle kinematics.Ge´otechnique 55, No. 9, 697–698, http://dx.doi.org/10.1680/geot.2005.55.9. 697.
McDowell, G. & Bolton, M. D. (1998). On the micro mechanics of crushable aggregates. Ge´otechnique48, No. 5, 667–679, http:// dx.doi.org/10.1680/geot.1998.48.5.667.
McDowell, G. & Harireche, O. (2002). Discrete element modelling of soil particle fracture. Ge´otechnique 52, No. 2, 131–135, http://dx.doi.org/10.1680/geot.2002.52.2.131.
McDowell, G. R. & Humphreys, A. (2002). Yielding of granular materials.Gran. Matter4, No. 1, 1–8.
Nakata, Y., Hyodo, M., Hyde, A. F., Kato, Y. & Murata, H. (2001a). Microscopic particle crushing of sand subjected to high pressure one-dimensional compression.Soils Found.41, No. 1, 69–82. Nakata, Y., Kato, Y., Hyodo, M., Hyde, A. F. & Murata, H.
(2001b). One-dimensional compression behaviour of uniformly graded sand related to single particle crushing strength. Soils Found.41, No. 2, 39–51.
Palmer, A. C. & Sanderson, T. J. (1991). Fractal crushing of ice and brittle solids.Proc. R. Soc. London Ser. A433, No. 1889, 469–477. Pestana, J. M. & Whittle, A. J. (1995). Compression model for
cohesionless soils. Ge´otechnique 45, No. 4, 611–631, http:// dx.doi.org/10.1680/geot.1995.45.4.611.
Russell, A. R. (2011). A compression line for soils with evolving particle and pore size distributions due to particle crushing.
Ge´otechnique Lett.1, Jan.–Mar., 5–9.
Russell, A. R., Muir Wood, D. & Kikumoto, M. (2009). Crushing of particles in idealised granular assemblies. J. Mech. Phys. Solids57, No. 8, 1293–1313.
Sammis, C., King, G. & Biegel, R. (1987). The kinematics of gouge deformation.Pure Appl. Geophys.125, No. 5, 777–812. Steacy, S. J. & Sammis, C. G. (1991). An automation for fractal
patterns of fragmentation.Nature353, No. 6341, 250–252. Tsoungui, O., Vallet, D. & Charmet, J.-C. (1999). Numerical model
of crushing of grains inside two-dimensional granular materials.
Powder Technol.105, No. 1–3, 190–198.
Turcotte, D. L. (1986). Fractals and fragmentation.J. Geophys. Res.
91, No. B2, 1921–1926.
Weibull, W. (1951). A statistical distribution function of wide applicability.J. Appl. Mech.18, 293–297.