THE NEURAL CODING OF AUDITORY SPACE
BY TERRY T. TAKAHASHI
Institute of Neuroscience, University of Oregon, Eugene, OR 97403, USA
Summary
The barn owl's auditory system computes interaural differences in time and amplitude and derives from them the horizontal and vertical coordinates of the sound source, respectively. Within the external nucleus of its inferior colliculus are auditory neurones, called 'space-specific neurones', that have spatial receptive fields. To activate a space-specific neurone, a sound must originate from a circumscribed region of space, or, if the sounds are delivered to each ear separately, using earphones, the stimuli must have the combination of interaural time and amplitude difference that simulates a sound broadcast from their receptive field. The sound-localization cues are processed in parallel, non-overlapping pathways extending from the cochlear nuclei to the subdivision of the inferior colliculus that innervates the space-specific neurones. Processing in the time pathway involves the coding of monaural phase angle, the derivation of sensitivity for interaural phase difference, and the calculation of interaural time difference (ITD) from interaural phase difference. The last process involves groups of neurones in the inferior colliculus whose collective firing signals a unique ITD, even though the activity of each constituent neurone signals multiple ITDs. The projections of these ensembles to the space-specific neurone endow the latter with a selectivity for ITD. Processing in the amplitude channel, about which less is known, initially involves an inhibitory process that sharpens the directional sensitivity of neurones in a lateral lemniscal nucleus. The inhibition is mediated by a commissural projection from the same lemniscal nucleus of the opposite side. At higher levels of the auditory system, neurones that are tuned to a limited range of interaural amplitude differences are found. It is proposed that at these higher stages, interaural amplitude difference, like ITD, is coded amidst an ensemble of neurones.
Introduction
When a barn owl (Tyto alba) hears a sound of interest, it responds with a rapid, ballistic head-turn that aligns its head with the source. The alignment of the head is precise even when sounds are so brief as to have ceased before the owl began its response (Knudsen & Konishi, 1979). Consistent with the 'open-looped' nature of the behaviour is a coding scheme for space in which each sound-source location is represented by an auditory neurone that has a spatial receptive field. Such space-specific neurones have been discovered in the external nucleus of the barn owl's
inferior colliculus (ICx) where they are arrayed according to the position of their receptive fields so that the neighbour relationships of points in space are conserved (Knudsen & Konishi, 1978). Because auditory space is not explicitly mapped at the receptor epithelium, but is instead computed, the space-specific neurone provides an opportunity to explore neuronal calculations. I will describe how an auditory neurone gains selectivity for stimulus location and conclude with some specu-lations on neural architecture that emerge from the work on the owl's auditory system.
Two axes, two cues and two pathways
Bioacoustical and behavioural analyses have shown that interaural differences in time and amplitude (or, more precisely, sound-level) signify the horizontal and vertical coordinates of the sound source, respectively (Knudsen & Konishi, 1979; Moiseff, 1989a,b). Interaural time difference (1'1'D) and the horizontal axis, or azimuth, are correlated because the barn owl's ears are separated along the horizontal axis, and sound waves require a finite time - maximally 180^s in the barn owl - to reach the farther ear. Interaural sound-level difference (ILD) and the vertical axis, or elevation, are correlated because the barn owl's ears have differences in directional sensitivity for frequencies between 4 and 9 kHz that extend in the vertical dimension: the right ear is more sensitive to sounds coming from above and the left ear is more sensitive to those coming from below. This asymmetry in directional sensitivity is, in turn, the result of a morphological asymmetry: the ear opening and the stiff piece of skin covering the opening are located higher on the left side than on the right side.
In the barn owl, as in other birds, fibres of the eighth nerve bifurcate and terminate on cells of the cochlear nuclei: nucleus magnocellularis and nucleus angularis (Fig. 1). Electrophysiological surveys by Sullivan & Konishi (1984) revealed that cells of nucleus magnocellularis 'phase lock', i.e. their action potentials have the highest probability of occurrence when the frequency to which the neurones are responding reaches a certain phase angle. As a result, the intervals between spikes from a cell in nucleus magnocellularis will approximate integer multiples of the stimulus period. The firing rate of cells in the nucleus magnocellularis is relatively insensitive to sound-level, and importantly, the phase angle to which the cell's response is locked does not shift with changes in sound-level. By contrast, cells of nucleus angularis do not phase lock, but are highly sensitive to the level of the sound in the ipsilateral ear. Thus, from the most peripheral levels in the brain, sensitivity to time (more precisely, phase) and amplitude are segregated.
ICx: space-specific neurones
ICx: space-specific neurones
L, shell ^M, shell Central nucleus of
inferior colliculus
M, s h e l l » C o r e | L, shell Central nucleus of
inferior colliculus
Z//
1
S§NA$$Cochlea
I
Key [Slntensi i T i m e i Both
Fig. 1. Pathway for the computation of binaural cues. Nuclei involved in processing interaural phase and time differences are enclosed in shaded boxes, whereas those involved in processing interaural sound-level difference are enclosed in striped boxes. Nuclei, the neurones of which are sensitive to both binaural cues, are enclosed in open boxes. NM, nucleus magnoceUularis; NL, nucleus laminaris; VLVa, nucleus ventralis lemnisci lateralis pars anterior; VLVp, nucleus ventralis lemnisci lateralis pars posterior; core, core of the central nucleus of the inferior colliculus; 1 shell, lateral shell of the central nucleus of the inferior colliculus; m shell, medial shell of the central nucleus of the inferior colliculus; ICx, external nucleus of the inferior colliculus. To avoid clutter, some projections (e.g. from the right NA and NL to the left ICc, VLVa and VLVp) have been omitted.
originating from nucleus magnocellularis. Their cells are sensitive to ITD but not t o I L D .
Sensitivity to ITD and ILD are found combined in the lateral portion of the ICc shell (T. T. Takahashi, unpublished observations) and in the ICx (Moiseff & Konishi, 1981). The latter contains the space-specific neurone, which can be driven only when stimuli presented to each ear separately (i.e. dichotically) have the combination of ITD and ELD that would simulate a sound source in their receptive field.
The selectivity of space-specific neurones for both cues was exploited to demonstrate directly that ITD and ILD were processed in independent neural channels. While recording from a space-specific neurone, small portions of nucleus magnocellularis or nucleus angularis were anaesthetized by microinjections of lidocaine hydrochloride, a local anaesthetic (Takahashi etal. 1984). Anaesthetiza-tion of nucleus magnocellularis, the cells of which are specialized for encoding the temporal aspects of the stimulus, altered the selectivity of space-specific neurones for ITD, but left intact their selectivity for ILD. Anaesthetization of nucleus angularis, the cells of which are specialized for encoding stimulus amplitude, had the converse effects.
Computation of interaural time difference Coding stimulus phase angles
The initial step in the processing of interaural time difference (ITD) is the coding of stimulus phase angles by the phase-locked discharge of eighth nerve fibres. The intervals between eighth nerve action potentials, and therefore the phase locking, are preserved as the synapse between an eighth nerve afferent and the postsynaptic neurone of nucleus magnocellularis is crossed (Sullivan & Konishi, 1984). Neither cells of nucleus magnocellularis nor their afferents can fire at rates that would allow a spike-for-cycle following of frequencies higher than about 1000 Hz. It has been proposed, however, that a population of cells, one cell firing when its neighbour was unable, could allow for such a cycle-by-cycle representation (Wever, 1949). Indeed, where axons of nucleus magnocellularis are in close proximity to one another, as they are in nucleus laminaris, the next synaptic station, it is possible to record a quasi-sinusoidal evoked potential, termed the 'neurophonic'. The neurophonic has maximal energy at the frequency of the stimulus (Sullivan & Konishi, 1986).
Computation of interaural phase difference
Left NM
( a
<•>
<•>
<•>
\4*¥
49>
<•>
<•>
<•>
<•>
<•>
<•>
NL
[image:5.451.105.346.78.225.2]Right NM
Fig. 2. Schematic diagram of nucleus laminaris (NL) of one side. Axon collaterals from nucleus magnocellularis (NM) of the left and right sides enter NL at opposite surfaces and interdigitate. Because of this cytoarchitecture, the time required for impulses to reach a given cell in NL (shaded circles) from the cochlea (not shown) is slightly different from that required to reach the cell from the other ear. Cells in NL are thought to discharge maximally when inputs from the two sides arrive simultaneously. Therefore, a cell in NL can only be maximally excited if the difference in transmission times is compensated for by broadcasting a sound first to the ear having the longer transmission time.
cytoarchitecture, there is a difference in transmission times from the left and right ears, the magnitude of which varies with the location in the nucleus (Carr & Konishi, 1988). Owing to the difference in transmission times, the phase angle of the neurophonic elicited by stimulation of one ear is shifted relative to that of the neurophonic evoked via the opposite ear. Electrophysiological evidence suggests that cells in nucleus laminaris discharge maximally only when the neurophonics from the two sides are in phase locally (Sullivan & Konishi, 1986), as can be accomplished by introducing a phase lead in the ear with the longer transmission time. Therefore, the maximal firing of a cell in nucleus laminaris would signify that a particular frequency component had a certain interaural phase difference (AO). This coding scheme for A<J> was first suggested by Jeffress (1948) and independently by H. Wallach (cited in Licklider, 1959). It has since been adapted for a variety of systems and supported by physiological and anatomical data (Rose et al. 1966; Goldberg & Brown, 1969; Yin & Kuwada, 1984; Sullivan & Konishi, 1986; Yin et al. 1987; Carr & Konishi, 1988).
Phase ambiguity and its resolution
interaural delay equal to the stimulus period T, such a cell is just as likely to fire for that ITD plus or minus integer multiples of T. When the response of a phase-selective neurone is plotted as a function of ITD, multiple local maxima are observed that are separated by one period of the frequency component to which that neurone was responding. Therefore, the firing of neurones in nucleus laminaris or ICc core specifies A<I> but is ambiguous with respect to ITD.
The ambiguity posed by the usage of phase differences can be solved by accessing phase information across multiple frequency channels. Consider a source broadcasting a broad-band sound from, say, 7-5° of azimuth to the right of the midline. At roughly 2 /xs per degree of azimuth (Moiseff & Konishi, 1981), the ITD would be roughly 15 /xs. (By convention, positive ITDs indicate that the sound in the right ear leads.) The stimulus would activate all cells in nucleus laminaris and ICc core that are tuned to the frequencies contained in the sound and to the A3> values that result from the ITD. Thus it would activate, for example, a 6 kHz cell tuned to a AO of 15 /zs/167 /is cycles, or about 32° of A * . Similarly, a 7kHz cell tuned to a phase difference of 38° of AO would also respond. (The periods of 6 kHz and 7 kHz are 167/is and 143 je, respectively.) In more general terms:
A * = ITD x F , (1)
where F is the frequency (or 1/T) to which a neurone is most sensitive. Equation 1 shows that the A<I> of each frequency in a complex signal is shifted by an amount directly proportional to the frequency when the signal is subjected to a constant interaural delay.
Of course, as described above, the firing of the 6 kHz cell could signify a locus corresponding to 15/is, 182/is or -152 /zs, and the firing of the 7 kHz cell could signify 15/is, 157 /zs or —121 pis. However, all cells, regardless of their preferred frequencies, would signal the correct ITD, 15 /zs. The correct ITD, also called the 'characteristic delay' (Rose et al. 1966), may therefore be calculated by determin-ing the ITD that is consistent with all frequency channels. As a corollary, when a signal contains but a single spectral component, the characteristic delay cannot be computed. Indeed, when an owl attempts to localize a high-frequency tone burst, it behaves as though it perceives more than one source. If broad-band stimuli are presented, the owl's localization is precise.
Neuronal derivation of time from phase
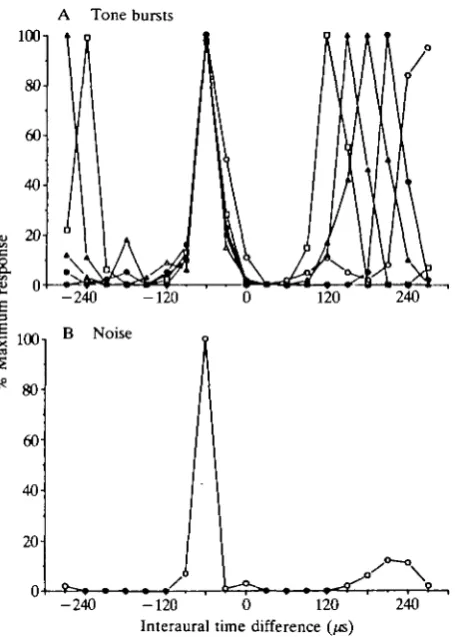
character-A Tone bursts 1001
[image:7.451.115.343.73.392.2]
80-- 2 4 0 -120 0 120 Interaural time difference (^s
Fig. 3. Response of a space-specific neurone plotted as a function of interaural time difference (ITD). Negative LTDs mean that the sound in the left ear led. When stimulated with tones, the space-specific neurone signals multiple ITDs that differ by one period of the stimulus frequency (A). However, all frequencies elicit a maximal response at - 6 0 / c , the characteristic delay of this neurone. When stimulated with noise, the space-specific neurone signals the characteristic delay (B). The tones used to obtain the ITD functions shown in A are as follows: 3333Hz (open circles), 3703Hz (filled circles), 4176Hz (open triangles), 4762Hz (filled triangles) and 5555Hz (open squares).
istic delay (Fig. 3B) (Takahashi & Konishi, 1986). Recent studies have shown that the preferential response to the characteristic delay involves an inhibition mediated by gamma-aminobutyric acid (GABA) (Fujita & Konishi, 1988).
Fig. 4. (Ai-v) Tonotopic ensembles in the central nucleus of the inferior colliculus (ICc). The response vs ITD curves of neurones encountered in a vertical electrode pass are shown. The locations of the neurones from which the recordings were made are shown on the tracings of coronal sections to the right (B), marked with triangles and corresponding numbers. Each curve was obtained using broad-band noise. The cyclic responses, which have periods equal to the preferred frequencies, indicate that the neurones signal A<J> but not ITD. The tonotopic organization of the central nucleus can be inferred from the decrease in the period of the ITD curves. Importantly, however, an ITD of roughly — 60/e is effective for all cells encountered in this electrode pass, regardless of their preferred frequencies. Thus, this ensemble of neurones, like a space-specific neurone, can signal a unique ITD. The preferred frequencies of the neurones shown are: 2772 Hz (i), 3704 Hz (ii), 4760Hz (iii), 5550Hz (iv) and 7150 Hz (v). (B) Innervation of space-specific neurones by tonotopic ensembles. The electrode pass containing the ensemble depicted in A was marked with small, electrolytic lesions (crosses in centre tracing of a transverse section through the inferior colliculus). A region of ICx containing space-specific neurones that were selective for the same ITD, —60/e, was characterized (ITD-response function) and injected with horseradish peroxidase (HRP). HRP histochemistry revealed a focus of retrogradely labelled cells (dots) on and near the transverse section containing the marked ensemble (centre tracing). Section numbers, enumerated from the posterior pole of the central nucleus, are shown adjacent to the tracings of the transverse sections through the inferior colliculus. Labelled cells from several sections were orthogonally projected onto single, representative sections to obtain the top and bottom tracings. The centre tracing, in contrast, is of a single section.
Ensemble representation of interaural time difference
100, 13470um Ai , 100, 13595um
50
i
E
E
- 2 4 0 - 1 2 0 0 120 240
100
50
13705um Aiii 100 13 975 urn
50
Aii
- 2 4 0 - 1 2 0 0 120 240
Aiv
- 2 4 0 - 1 2 0 0 120 240 - 2 4 0 - 1 2 0 0 120 240
100 14250um
I 80
•- 6 0
1 40
20 a?
- 2 4 0 - 1 2 0 0 120 240 Interaural time difference (us)
Lateral | 100
1 80
| 60.1 40
s
2 20
5 5 0
ICx injection site
- 2 4 0 - 1 2 0 0 120 240 Interaural time difference (us)
61-69 HRP
Lesions
4000 Hz, 22°
o
5000 Hz, 27°
-•;$) — \ \ . 4000-7000 Hz
ICx space-specific
6000 Hz, 32° y IT neurone
7000 Hz, 38°
[image:10.451.136.317.47.219.2]ICc ensemble
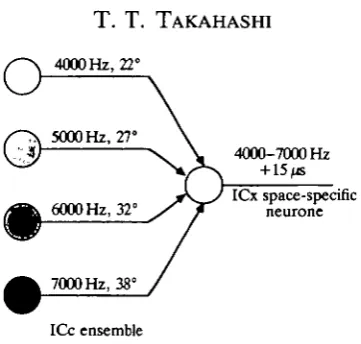
Fig. 5. Extraction of interaural time difference from interaural phase difference. Space-specific neurones are broadly tuned for frequency but are selective for a single ITD; 15 fjs for the one depicted. It is innervated by a tonotopic ensemble of neurones in ICc, each constituent of which is selective for the A * that corresponds to 15 /«, given the preferred frequency of that cell (see equation 1 in text). Thus a 4000 Hz cell tuned to 22°, a 5000 Hz cell tuned to 27°, a 6000Hz cell tuned to 32° and a 7000Hz cell tuned to 38° all signify 15 fjs and innervate the space-specific neurone selective for 15/«.
form a map of stimulus azimuth (Wagner et al. 1987). Small 1'1'Ds, which correspond to loci near the midline, are found rostrally at the lateral-shell/core border. Large ITDs corresponding to eccentric loci in the contralateral and ipsilateral hemifields are found caudally in the lateral shell and core, respectively.
The functional relevance of the ensembles cannot be established by physiologi-cal measurements alone. Studies of connectivity using horseradish peroxidase (HRP) retrograde transport, however, confirm that the ensembles are functional units: they innervate space-specific neurones that are selective for the same ITD. Thus, for instance, the ensemble depicted in Fig. 4A, which conserves an ITD of —60 /is, can be shown to innervate a space-specific neurone that is also selective for —60 [is. An injection of HRP in the vicinity of the space-specific neurone reveals a focus of retrogradely labelled neurones near electrolytic lesions marking the electrode track in which the ensemble of Fig. 4A was found (Fig. 4B). Thus, the neurones of ensembles project convergently onto space-specific neurones, endow-ing them with a broad tunendow-ing for frequency and the ability to specify a unique ITD (Fig. 5).
A map of contralateral space
Injections of HRP into areas of ICx that represent various I'll) values revealed that the ICc/lCx projection conserves spatiotopy or, more precisely, 'ITDotopy' (Wagner et al. 1987). Space-specific neurones that represent central loci are innervated by ensembles in the rostral part of the lateral shell, whereas those that represent eccentric contralateral loci are innervated by ensembles in the caudal part of the lateral shell.
target, ICx, can be traced back to nucleus laminaris, via a doubly crossed pathway (Takahashi etal. 1989). For instance, the left nucleus laminaris, which is known to contain a representation of predominantly the right, or contralateral, hemifield (Sullivan & Konishi, 1986), projects to the right ICc core, endowing ensembles in the core with a representation of the right, or ipsilateral, space. The right core, in turn, projects across the midline to innervate the left lateral shell, contributing a representation of the right, or contralateral, space. The lateral shell, finally, conveys its representation of contralateral space to the ipsilateral ICx.
Computation of interaural sound-level difference
Our knowledge of the derivation of selectivity for interaural sound-level difference (ILD) is sketchier than our knowledge of the computation of ITD. In the barn owl, the most peripheral site that contains neurones whose response is a function of ILD is the nucleus ventralis lemnisci lateralis pars posterior (VLVp), one of the lateral lemniscal nuclei. VLVp is tonotopically organized and consists primarily of 'El' neurones which are excited (E) by stimulation of the contralateral ear and inhibited (I) by stimulation of the ipsilateral ear (Moiseff & Konishi, 1983; Manley et al. 1988). The strength of the inhibitory input is graded, so that dorsally neurones are strongly inhibited, and ventrally neurones are driven by the contralateral input alone (Manley et al. 1988). The latter response-type is termed EO: excited by the contralateral ear and not influenced (0) by the ipsilateral ear. Workers studying the mammalian auditory system were the first to demonstrate that El cells can be sensitive indicators of ILD (Boudreau & Tsuchitani, 1968; Goldberg & Brown, 1969; Brugge et al. 1970). This is demonstrated for the barn owl in Fig. 6A, which shows the response of a neurone from the right VLVp to binaural stimuli (solid curve) and to the stimulation of the excitatory (i.e. left, contralateral) ear alone (dashed curve). ILDs were created by adjusting the level of the sound in the two ears together so that a constant, total binaural level was maintained. The upper row of numbers along the abscissa is the difference between right and left sound levels (ILD equals right sound level minus left sound level), and it pertains to the binaural curve. (Hereafter, negative ILDs mean that the sound in the left ear was louder.) The bQttom row is the sound level presented to the excitatory ear in order to achieve the ILD shown immediately above it, and it pertains to the monaural curve. The monaural curve reveals that the neurone's response was a monotonic function of the sound level presented to the excitatory ear. Thus, the directional sensitivity of this neurone, were it strictly a monaural cell, would reflect the directionality of the contralateral ear. When sound was presented simultaneously to the inhibitory (ipsilateral, right) ear, the curve was still essentially monotonic, but steeper. The ipsilateral inhibition is, therefore, the means by which the sound levels in the ears are contrasted and neuronal directionality augmented.
8.
U
E
x
0-4-
0-2-o—oBinaural » — * Left ear
0-6-
0-4-
0-2-°—oBinaural t = 5min *—» Left ear t = 7 min
0-01 T 0-0 I I . i
ILD-50-40 -30-20-10 0 10 20 30 40 50 -50-40-30-20-10 0 10 20 30 40 50 SPL 55 45 35 25 15 5 55 45 35 25 15 5
LeftSPL 55
10
IT 0-8
I
|
06
5 0-4
£
°"
20-0
B
~ \ °—oBinaural t = 0min
X
N»—*Left ear t = 2-5 min
\
•o-q \ \ \
\ X \ \
\ ^o-A
V
V.V / \S
I L D - 5 0 - 4 0 - 3 0 - 2 0 - 1 0 0 10 20 30 40 50 Left SPL 55 45 35 25 15 5
o — o Binaural t = 23-75 min *— -» Left ear t = 28-5 min
- 5 0 - 4 0 - 3 0 - 2 0 - 1 0 0 10 20 30 40 50 55 45 35 25 15 5
Fig. 6. Sensitivity for interaural sound-level difference (ILD) in VLVp (A). The response of a neurone in the right VLVp is plotted as a function of ILD (upper row of numbers on the abscissa) and the sound-level presented to the contralateral (left) ear (lower row of numbers along the abscissa). Negative ILDs mean that the sound in the left ear was louder. The difference between the monoaural curve (dashed) and the binaural curve (solid) is due to an inhibition evoked by stimulation of the ipsilateral ear. The inhibition can be removed by the injection of local anaesthetic into the contralateral VLVp (B-D). Upon injection of 0-2 fA of the anaesthetic (B), the binaural curve shifts and assumes the shape of the monaural curve (C). Recovery takes about 30 min (D).
instance, the cell shown in Fig. 6A, which is inhibited by stimulation of the right ear, would have a sharp upper boundary because the right ear is more sensitive to sounds coming from above.
What is the source of the inhibitory input? Pathway tracing studies (Takahashi & Konishi, 19886) have shown that VLVp is innervated by the contralateral nucleus angularis (Fig. 1), but this projection only accounts for the observation that VLVp neurones are excited by stimulation of the contralateral ear. More recent pathway-tracing studies have shown that VLVp of one side projects tonotopically to VLVp of the other side. This commissural connection is a possible substrate for the ipsilaterally evoked inhibition (Takahashi & Konishi, 1988c) (Fig. 1). For example, the left nucleus angularis, stimulated by the left ear, may activate cells in the contralateral, or right, VLVp. Some cells in the right VLVp may project commissurally to inhibit neurones in the left, or ipsilateral, VLVp.
To test whether VLVp of one side can inhibit VLVp of the other side, single-cell recordings were made in one VLVp while a local anaesthetic was injected into the opposite VLVp (Takahashi & Konishi, 1988c). Fig. 6B-D shows typical results. Prior to the injection of the local anaesthetic (Fig. 6A), the binaural curve (solid line, open circles) was steeper than the monaural curve (dashed line, filled triangles), as described above. Upon injection of 0-2 [A of local anaesthetic (3 % lidocaine HC1) into the opposite VLVp, the binaural curve shifted, became less steep, and essentially assumed the shape of the monaural curve (Fig. 6B,C). Recovery took about 30min (Fig. 6D).
In the case depicted, there was a good match in the best frequencies of neurones in the vicinity of the injection and that of the neurone from which the recording was made (both 4-5kHz). Later in the experiment, the micropipette containing the local anaesthetic was left in place, and a recording was made from a neurone with a higher best frequency (7-8 kHz). Injection of the local anaesthetic produced results similar to that shown in Fig. 6, but the effect lasted only about 8-10 min. This suggests the existence of a tonotopy in the commissural projection and is consistent with the results of pathway-tracing studies (Takahashi & Konishi, 1988c).
In theory, the inhibition may be accomplished directly by the commissurally projecting neurones themselves. Such long-distance inhibitory neurones have been reported in the dorsal nucleus of the lateral lemniscus of the cat (Adams & Mugnaini, 1984; Schneiderman & Oliver, 1987). Alternatively, the commissural axons may act indirectly by exciting local inhibitory neurones. The local neurones would be of the 0E type, i.e. driven only by the ipsilateral ear. Surveys by Moiseff & Konishi (1983) and by Manley et al. (1988), however, found no 0E cells, thus favouring direct inhibition.
play a role (Moore & Caspary, 1983). Immunohistochemical studies by Carr et al. (1986), have demonstrated an abundance of cells in VLVp that contain GAB A and its synthetic enzyme, glutamic acid decarboxylase (GAD), but the effectiveness of GABA has not been confirmed by pharmacological and physiological tests. The involvement of glycine has yet to be tested, immunohistochemically or physiologi-cally.
At the level of VLVp, cells are sensitive to ILD, and their receptive fields are sharply delimited on the top or bottom only. At higher levels, the auditory system must generate neurones that will only fire for a limited range of ILDs and, therefore, have receptive fields that are sharply delimited on both the top and the bottom. Such cells have been observed (T. T. Takahashi, unpublished obser-vations) in the lateral shell of ICc, an area that innervates the ICx directly, as well as in the ICx itself. Recent preliminary evidence (Takahashi & Konishi, 1988c) suggests that VLVp projects to the ICc shell, but the field of termination has yet to be delineated completely, and the interactions between the input from VLVp and the postsynaptic neurones have not been characterized.
Speculations on neural architecture Tonotopic ensembles and two-dimensional space
The lateral shell of ICc is the penultimate station in the circuitry that computes sound source locations. Many of its neurones, as mentioned above, are selective for frequency and for interaural differences in both phase and sound level (T. T. Takahashi, unpublished observations). It is possible to propose a hypotheti-cal scheme for the functional organization of the lateral shell that incorporates these parameters.
A stationary source of broad-band sound will generate a family of AO values that differ with frequency, and it was demonstrated above that a tonotopic ensemble encodes an ITD based on these A3> values. The stationary sound source can also generate a constellation of ILDs, for the directionalities of the ears are frequency-dependent (Moiseff, 1989a, b). To represent a particular elevation using ILD as the cue, a neurone selective for, say, 5 kHz may have to be selective for an ILD of 12 dB whereas a 6 kHz neurone coding the same elevation would have to be selective for 15 dB (see also Esterly & Knudsen, 1987) and so on. Perhaps, within an ensemble of the lateral shell, neurones with different preferred frequencies are selective not only for the A $ values that specify a single ITD (and therefore azimuth) but also for the different ILDs that specify a single elevation. The elevation specified by the ensembles, furthermore, would vary systematically along an axis that is orthogonal to that along which azimuth is represented. A two-dimensional map of space based on multicellular, tonotopic arrays would result.
Other modules
ovoidalis) and forebrain (field L). Multiplexed within it must be information not just about stimulus location but also that needed by higher stations for the construction of other perceptions. What other organizational schemes define the inferior colliculus? The ITD ensembles described above were defined operation-ally; i.e. by virtue of their projections to a high-order cell, the space-specific neurone, that manifests the collective activity of the ensemble. Were we to study cells in the medial geniculate that, for instance, are selective for the direction and speed of a moving acoustic target, we might find that they are innervated by the same ICc cells that participate in the space-coding ensembles, but that the ICc cells are part of an altogether different architectonic plan. Another set of functional units or modules may be defined that reflects the informational and data-processing needs of the motion-detection circuitry. Such an observation would lead to the conclusion that there need not be a single, correct organizational scheme for any part of the brain. Different schemes may be revealed, depending on how the circuitry is assessed. If this is the case, a general understanding of functional brain architecture is not likely to be achieved by subdividing brain regions based on physiological or anatomical criteria in isolation. It will be necessary to interpret connectional patterns in the context of the underlying physiology and the behavioural requirements of the animal. To this end, cells such as the space-specific neurone, that respond selectively to complex, behaviourally relevant stimuli, should prove to be highly useful.
References
ADAMS, J. C. & MUGNAJNI, E. (1984). Dorsal nucleus of the lateral lemniscus: A nucleus of GABAergic projection neurones. Brain Res. Bull. 13, 585-590.
BOUDREAU, J. C. & TSUCHITANI, C. (1968). Binaural interaction in the cat superior olivary S segment. J. Neurophysiol. 31, 442-454.
BRUGGE, J. F., ANDERSON, D. J. & AITKIN, L. M. (1970). Responses of neurons in the dorsal nucleus of the lateral lemnisucs of cat to binaural tonal stimulation. J. Neurophysiol. 32, 441-458.
CARR, C. E., BRFXHA, N. & KONISHI, M. (1986). GAD immunoreactivity is correlated with functional inhibition in the auditory system of the owl. Soc. Neurosci. Abstr. 12, 1276.
CARR, C. E. & KONISHI, M. (1988). Axonal delay lines for time measurement in the owl's brainstem. Proc. natn. Acad. Sci. U.S.A. 85, 8311-8315.
ESTERLY, S. D. & KNUDSEN, E. I. (1987). Tuning for interaural difference cues varies with frequency for space-specific neurones in the owl's optic tectum. Soc. Neurosci. Abstr. 13, 1468.
FUJITA, I. & KONISHI, M. (1988). GABA-mediated inhibition contributes to neuronal selectivity for interaural time difference in the owl's inferior colliculus. Soc. Neurosci. Abstr. 14, 1096.
GOLDBERG, J. M. & BROWN, P. B. (1969). Response of binaural neurones of dog superior olivary complex to dichotic stimuli: Some physiological mechanisms of sound localization.
J. Neurophysiol. 32, 613-636.
JEFFRESS, L. A. (1948). A place theory of sound localization. J. comp. Physiol. 41, 35-39.
KNUDSEN, E. I. & KONISHI, M. (1978). Space and frequency are represented separately in auditory midbrain of the owl. J. Neurophysiol. 41, 870-884.
KNUDSEN, E. I. & KONISHI, M. (1979). Mechanisms of sound localization in the barn owl (Tyto
alba). J. comp. Physiol. 133, 13-21.
MANLEY, G. A., KOPPL, C. & KONISHI, M. (1988). A neural map of interaural intensity difference in the brain stem of the barn owl. J. Neurosci. 8, 2665-2676.
MOISEFF, A. (1989a). Binaural disparity cues available to the barn owl for sound localization. J. comp. Physiol. (in press).
MOISEFF, A. (1989£>). Bi-coordinate sound localization by the barn owl. /. comp. Physiol. (in press).
MOISEFF, A. & KONISHI, M. (1981). Neuronal and behavioural sensitivity to binaural time differences in the owl. J. Neurosci. 1, 40-48.
MOISEFF, A. & KONISHI, M. (1983). Binaural characteristics of units in the owl's brainstem auditory pathway: precursors of restricted spatial receptive fields. J. Neurosci. 3, 2553-2562.
MOORE, M. J. & CASPARY, D. M. (1983). Strychnine blocks binaural inhibition in lateral superior olivary neurones. J. Neurosci. 3, 237-242.
ROSE, J. E., GROSS, N. B., GEISLER, C. D.& HIND, J. E. (1966). Some neural mechanisms in the inferior colliculus of the cat which may be relevant to localization of a sound source. 7. Neurophysiol. 29, 288-314.
SCHNEIDERMAN, A. & OLIVER, D. (1987). Morphological evidence for inhibitory inputs to the inferior colliculus from the dorsal nucleus of the lateral lemniscus. Soc. Neurosci. Abstr. 13, 1467.
SULLIVAN, W. E. & KONISHI, M. (1984). Segregation of stimulus phase and intensity coding in the cochlear nucleus of the barn owl. J. Neurosci. 4,1787-1799.
SULLIVAN, W. E. & KONISHI, M. (1986). Neural map of interaural phase difference in the owl's brainstem. Proc. natn. Acad. Sci. U.S.A. 83, 8400-8404.
TAKAHASHI, T. & KONISHI, M. (1983). The functional organization of the barn owl's inferior colliculus. Soc. Neurosci. Abstr. 9, 212.
TAKAHASHI, T. & KONISHI, M. (1986). Selectivity for interaural time difference in the owl's midbrain. /. Neurosci. 6, 3413-3422.
TAKAHASHI, T., MOISEFF, A. & KONISHI, M. (1984). Time and intensity cues are processed independently in the auditory system of the owl. J. Neurosci. 4,1781-1786.
TAKAHASHI, T. T. & KONISHI, M. (1988a). Projections of the cochlear nuclei and nucleus laminaris to the inferior colliculus of the barn owl. /. comp. Neurol. 274,190-211.
TAKAHASHI, T. T. & KONISHI, M. (1988i>). Projections of nucleus angularis and nucleus laminaris to the lateral lemniscal complex of the barn owl. J. comp. Neurol. 274, 212-238.
TAKAHASHI, T. T. & KONISHI, M. (1988C). Commissural projections mediate inhibition in a lateral lemniscal nucleus of the barn owl. Soc. Neurosci. Abstr. 14, 323.
TAKAHASHI, T. T., WAGNER, H. & KONISHI, M. (1989). The role of commissural projections in the representation of bilateral auditory space in the barn owl's inferior colliculus. /. comp. Neurol. (in press).
WAGNER, H., TAKAHASHI, T. T. & KONISHI, M. (1987). Representation of interaural time difference in the central nucleus of the barn owl's inferior colliculus. /. Neurosci. 7, 3105-3116.
WEVER, G. T. (1949). Theory of Hearing. New York: Wiley.
YIN, T. C. T., CHAN, J. C. K. & CARNEY, L. H. (1987). Effects of interaural time delays of noise stimuli on low-frequency cells in the cat's inferior colliculus. HI. Evidence for cross-correlation. /. Neurophysiol. 58, 562-583.