Development of generic methods for
the analysis and purification of polar
compounds by high performance
liquid chromatography
Joseph Jonathan Russell
A thesis submitted in partial fulfilment of the requirements of the University of the West of England, Bristol for the degree of Doctor of Philosophy
This research programme was carried out in collaboration with GlaxoSmithKline, Stevenage, UK
Abstract
Page 3 of 246
Acknowledgements
I thank Professor David McCalley for his support throughout the project. His expertise in HPLC and guidance in preparing papers worthy of high-impact journals has been invaluable. I would also like to thank Dr James Heaton, who has given me reasoned critique with loyal friendship.
I offer thanks to Dr Bob Boughtflower and Tim Underwood at GlaxoSmithKline for preparing the bid for my CASE studentship in collaboration with Professor McCalley. The intense HPLC training they gave me at the start of my project and supervision of my prep work in a second placement set me in good stead, with their balance of sound theory and hard-nosed pragmatism. I thank Simon Readshaw at GlaxoSmithKline for supporting my project from start to finish.
I thank ThermoFisher Scientific for the loan of UHPLC instrumentation and Charged Aerosol Detectors, especially Dr Frank Steiner, Dr Tony Edge and Dr Norman Ramsey.
Thanks also to the Chromatographic Society for providing financial support to attend meetings in the UK and International HPLC conferences in New Orleans, USA and Geneva, Switzerland, in particular Dr John Lough. I hope to continue as a UK researcher who produces chromatography publications and play a future role in this field.
I would like to thank the Royal Society of Chemistry for providing financial support to attend meetings and the opportunity to learn management skills by becoming an Early Career Network Representative in the Bristol & District local section. I thank Colin Chapman for bringing me onto the local committee and Giovanni Depietra and Niamh Brannelly for collaborating in the revival of the Early Career Network in our local area.
Finally, I thank Professor John Hart for being my second supervisor. As part of such a large and eminent supervisory team, John has been a friend throughout the project.
Page 5 of 246
Dedication
Contents
Acknowledgements ... 4
Dedication ... 5
Contents ... 6
Chapter 1 ... 10
1. High-Performance Liquid Chromatography ... 11
2. HPLC separation ... 13
3. Polarity and Hydrophilicity ... 18
4. HPLC of polar pharmaceuticals ... 20
5. Ion pair chromatography ... 22
6. Hydrophilic Interaction Chromatography ... 22
7. HPLC detection ... 27
8. Charged Aerosol Detection ... 28
9. Purification of polar pharmaceuticals ... 30
10. Focused Gradient Liquid Chromatography and At-Column Dilution ... 31
11. Objectives... 33
Chapter 2 ... 36
1. Instrumentation ... 37
a. HILIC buffer experiments ... 37
b. Charged Aerosol Detector experiments ... 37
c. HILIC Generic and focused method development ... 38
d. HILIC prep experiments ... 38
2. Conditions ... 38
a. Injection ... 38
3. Chemicals and reagents ... 39
4. Probe solutes ... 40
Chapter 3 ... 41
Abstract ... 42
1. Introduction ... 43
2. Experimental ... 45
3. Results and discussion ... 49
Page 7 of 246
3.2 Initial studies to establish a generic HILIC mobile phase buffer: performance of four different
phases with three mobile phase buffers ... 51
3.3. Detailed studies to elucidate phenomena responsible for results in 3.2 ... 57
3.3.1 Comparison of performance of four different stationary phases with three different buffers ... 57
3.3.2. Effect of mobile phase water concentration and buffer on retention and peak shape ... 68
3.3.3. Causes of poor peak shape for cationic solutes in formic acid ... 72
3.3.4. Effect of buffer salt concentration and salt cation on retentionof cationic compounds ... 74
Conclusions ... 75
Chapter 4 ... 77
Abstract ... 78
1. Introduction ... 79
2. Experimental ... 82
2.1 Chemicals and reagents ... 82
2.2 Equipment and methodology ... 86
3. Results and discussion ... 88
3.1.1 Detection limits (HPLC) ... 88
3.1.2 Calibration curves (HPLC) ... 90
3.2 Response universality and uniformity. ... 96
3.2.1 Flow injection analysis ... 96
3.2.2 Effect of solute salt composition on response (HPLC; FIA) ... 96
3.2.3 Response Uniformity (FIA)-dependence on solute and mobile phase buffer ... 103
3.2.4 Effect of solute volatility on response ... 108
3.2.5 Effect of organic modifier (FIA) ... 111
3.2.6 Effect of elevated temperature (FIA) ... 116
3.3 Analysis of salts (HPLC) ... 119
4. Conclusions ... 121
Chapter 5 ... 123
Abstract ... 124
1. Introduction ... 125
2. Experimental ... 128
2.1 Chemicals and reagents ... 128
2.2 Equipment and methodology ... 128
3.1 Viability of sugar analysis using an alternative stationary phase (BEH Amide) and CAD Veo
detection ... 130
3.2 Comparison of Ultra and Veo CAD ... 135
3.2.1 Noise in buffered and unbuffered mobile phase ... 136
3.3 Analysis of Simple Sugars in Beer and Cider ... 142
3.4 Analysis of underivitised Amino Acids ... 146
4. Conclusions ... 149
Chapter 6 ... 150
Abstract ... 151
1. Introduction ... 152
2. Theory ... 153
2.1 Loadability ... 153
2.2 Peak shape ... 155
2.3 Solubility ... 155
2.4 Productivity ... 156
3. Experimental ... 158
3.1 Chemicals and reagents ... 158
3.2 Apparatus and methodology ... 160
4. Results and discussion ... 161
4.1 Choosing separation conditions with alternate selectivity ... 161
4.1.1 Changing the selectivity using the organic solvent ... 161
4.1.2 Changing the selectivity by changing the stationary phase in generic HILIC methods ... 165
4.1.3 Focused analytical ‘zone’ methods ... 170
4.1.3 Changing the selectivity using RPLC toolbox methods at low pH and high pH ... 174
4.2 Sample preparation using different injection solvents to improve analyte solubility ... 175
4.3 Purification by HILIC ... 177
4.3.1 Generic vs. focused methods on an Atlantis column... 177
4.3.2 Generic vs. focused methods on a BEH Amide column ... 181
4.3.3 Purification by HILIC using an At-Column Dilution (ACD) system ... 184
4.3.4 Preparative productivity ... 188
4.3.5 Purification of zwitterion(s) ... 193
4.4 Possible explanations for poor ACD performance using DMSO or TFA ... 195
4.4.1 Characterising of the effect of DMSO on peak shape using an analytical system ... 195
Page 9 of 246
5. Conclusion ... 202
Chapter 7 ... 205
1. Overall Conclusion ... 206
2. Further Work ... 211
References ... 215
Appendix I ... 226
Figures, Tables, Equations, Symbols and Abbreviations ... 226
I.1 List of Figures ... 227
I.2 List of Tables ... 231
I.3 List of Equations ... 232
I.4 List of Symbols ... 234
3. I.5 List of abbreviations ... 239
Appendix II ... 242
Presentations and Publications ... 242
1. II.1 Poster Presentations ... 243
2. II.2 Oral Presentations ... 244
3. II.3 Second Author Oral Presentations ... 245
Chapter 1
Page 11 of 246
1.
High-Performance Liquid Chromatography
the pore surface, most commonly as a Reversed Phase Liquid Chromatography (RPLC) stationary phase, or unbonded as a bare silica. In RPLC the stationary phase is a hydrocarbon chain attached to a triethoxysilyl moiety, which bonds to the silica surface via a condensation reaction to give a surface with the ligand bonded to it (Fig. 1.1); the mobile phase is highly aqueous which favours retention of hydrophobic solutes into the stationary phase pores.
Figure 1.1 : Octadecylsilyl ligand with isopropyl protection bonded to silica stationary
phase
Page 13 of 246
process to control, and a study by Kirkland summarises the journey from packing as a ‘dark art’ to a scientific process (Kirkland et al. 2006). Modern HPLC columns are purchased with the stationary phase prepared and pre-packed.
The coupling of ultraviolet absorbance (UV) detectors in the 1960’s (Kirkland 1968) and mass spectrometers (MS) in the 1970’s (Niessen 2003) to HPLC systems made these techniques powerful with scope for automation. HPLC is near-ubiquitously the technique used to measure and attain acceptable purity of non-volatile substances (Espada et al. 2008, Korfmacher 2005). Generic methods allow the application of a relatively small set of analytical methods to a wide variety of compound structures. For example the pharmaceutical company GlaxoSmithKline quality–control tested a library of >700,000 compounds using a single RPLC method (Lane et al. 2006). This is very attractive industrially, as the alternative is method development for each compound of interest which can be time-consuming. The ubiquitous RPLC is used to a high degree of sophistication in generic methods as part of Open access (OA, ‘walk-up’) in drug development (Mallis et al. 2002). The user prepares a sample and follows on-screen instructions, the OA method analyses it and emails them the result. Major pharmaceutical companies have invested in this approach (Mallis et al. 2002, Korfmacher 2005, Espada et al. 2008, Dunn April 2013).
2.
HPLC separation
In a HPLC separation, the sample is injected into the flow of mobile phase. The amount of mobile phase needed to do that depends on retentivity of the solute in the column and how much mobile phase is delivered by the pump during the separation.
𝑉𝑟 = 𝑉𝑚(1 + 𝑘)
(1.2)The volume of mobile phase in one column volume (Vm) is a function of the time taken by an unretained species to pass through the column (t0) and the volumetric flow rate (F)
(Equation 1.1). The volume of mobile phase required to elute a peak is the retention volume (Vr) (Equation 1.2); this is proportional to the flow rate, which can vary between separations. Guiochon commented that absolute retention times are poorly reproducible and retention factors are the favourable measure of solute retentivity (Guiochon et al. 2013).
𝑘 =
𝑡𝑅−𝑡0𝑡0 (1.3)
The retention factor (k) is a dimensionless measure of solute retention, describing the retention of a solute relative to the passage of an unretained volume of mobile phase through the column (Equation 1.3). Samples typically contain greater than one chemical component; therefore retention must be different for each component to achieve separate peaks and allow the detector to interpret a single signal at a time.
α =
k2k1 (1.4)
The relative retention of two peaks is the selectivity factor (α), described by the relative retention of two closely-eluting peaks (Equation 1.4). This must be greater than one to achieve separation, and as an approximate rule of thumb, good separations are obtained for selectivity factors above 1.5.
N
0.5= 5.54 (
tRW0.5
)
2Page 15 of 246
To separate complex mixtures, each peak must be sufficiently narrow. Ideally peak widths would be infinitesimally small, however band broadening occurs both outside the column due to dead volumes in the instrument, e.g. tubing, and inside the column due to mass transfer and diffusion. To understand band broadening, the concept of theoretical plates was derived by Martin and Synge (Martin et al. 1941), where each solute band is analogous to a plate used to capture distillate in fractional distillation of petroleum components. Peak efficiency (N0.5) is the peak width at half-height (W0.5) relative to the retention time
(Equation 1.5), units are number of theoretical plates per column.
N =
HL (1.6)
The height equivalent to one theoretical plate is the efficiency divided by the column length (L) (Equation 1.6). State of the art Ultra High Performance Liquid Chromatography (UHPLC) systems are specially designed to minimise the extra-column band broadening due to e.g. excess tubing length.
𝑢 =
𝐿𝑡0 (1.7)
H = A +
Bu
+ Cu
(1.8)at low flow rates when (B/u) is large and the solute band is allowed excessive time to diffuse along the column bed. The C term is dominant at high flow rates when (B/u) is small. To achieve good efficiency in analysis, plate heights (H) around 2-20 µm are required, which is slightly larger than the diameter of common stationary phase particles in those columns (1-5 µm).
h =
Hdp (1.9)
h = a +
bu
+ cu
(1.10)Particle diameters vary between columns, therefore in kinetic studies reduced plate height (h) is considered (1.9), which corrects for the particle size to give (1.10). An ongoing objective of column manufacturers is to produce reduced plate heights below around 1, corresponding to a solute band equilibrating within the diameter of a single particle (1.9).
∆P =
2500LηF𝑑p2𝑑c2 (1.11)
Smaller H values can be achieved using smaller particles, as the shorter distance into and out of the particles allows for better mass transfer (1.8). However the system backpressure affected by particle size (1.11), column dimensions (length L and diameter dc), mobile phase viscosity (η) and flow rate (F). Modern UHPLC systems are designed to cope with high backpressures (around 1000 bar) when small particles (dp < 2 µm), narrow columns (2.1 mm i.d.) and high flow rates are used for fast analysis on short columns (L ≤5cm).
Page 17 of 246
hasn’t focused on kinetic investigations involving varied flow rate. It is attractive industrially to use an analytical method which scales up to purify compounds without the need for further method development. Therefore this project focuses on HPLC methods that can be scaled up to preparative systems for purification. Preparative separations require the use of much higher flow rates (see 9 below) and therefore to avoid excessive backpressures, very small particles and high analytical flow rates are avoided in this project since these both contribute to high system backpressures (1.11). For a detailed discussion of kinetics in hydrophilic interaction chromatography, studies by Heaton (Heaton et al. 2014a, 2014c), McCalley (McCalley 2007) and Gritti/Guiochon (Gritti et al. 2013c, 2015) give this topic thorough consideration.
Rs = (
14
) [
k1+k
] (α − 1)√N
(1.12)If there is sufficient selectivity (α) between peaks, efficiency has limited effect on separation power. It can be shown using the equation for chromatographic resolution (Rs; Equation
1.12) that Rs is optimal at moderate retention (1≤k≤5), good spacing (α≥1.5) and high efficiency (N≈10,000 or above).
log 𝑘 = log
EB+ 𝜂
′𝐻 − 𝜎𝑆* + 𝛽
′𝐴 + 𝛼
′𝐵 + 𝜅
′𝐶
(1.13)where the effect of each interaction on retention is considered (Carr et al. 2011, 2015, Marchand et al. 2011). Retention (log k) is a function of: partitioning from the mobile to stationary phase (represented by the log of retention of a neutral solute ethylbenzene (EB)), hydrophobic interactions (η’H), steric interactions (σS*), hydrogen bonding of a basic solute to an acidic stationary-phase group (β’A), hydrogen bonding of an acidic solute to a basic stationary-phase group (α’B) and ion-exchange between an ionic solute and a charge-bearing column (κ’C).
However highly polar solutes are either not retained by RPLC or resolved poorly (McCalley 2010a) due to a low affinity for hydrophobic C18 stationary phase relative to a highly aqueous mobile phase. Therefore alternative separation modes have been considered.
3.
Polarity and Hydrophilicity
To establish if a solute is hydrophilic and unlikely to retain by RPLC, it is possible to measure a solutes’ hydrophilicity using two immiscible solvent phases, normally water and an organic solvent such as n-octanol.
𝑋
(aq)↔ 𝑋
(org)(1.14)
A hydrophilic species will partition into the aqueous phase (X(aq)) and a hydrophobic species
will partition into the non-aqueous phase (X(org)) (Equation 1.14).
𝑃 =
𝐶(𝑋aq)Page 19 of 246
The partition coefficient of this process (P) is calculated by measuring the concentration of the solute in the aqueous [C(aq)] and organic phases [C(org)] (Equation 1.15), for a solute in its neutral form which can be achieved by adjusting the pH.
𝑙𝑜𝑔 𝑃 = 𝑙𝑜𝑔 (
CXaq) − log
(
CXorg)
(1.16)
However P can vary over several orders of magnitude depending on the solute. Log P (Equation 1.16) is a simple value that is increasingly positive for hydrophobic solutes that partition into the organic solvent and increasingly negative for hydrophilic solutes that partition into the organic solvent. However for complex mixtures each solute may be neutral or charged and measuring P is difficult.
HA = H
3O
++ A
-(1.17)
𝐾𝑎 =
[𝐻3𝑂+][𝐴-][𝐻𝐴]
(1.18)
𝑝𝐻 = 𝑝𝐾𝑎 + log
[𝐴−][𝐻𝐴]
(1.19)
To calculate the acidity or basicity of a solution and calculate the solute charge state requires pH and pKa calculations. For the dissociation of an acid (HA) to hydroxonium (H3O+)
and its anion (A-) in the presence of water (Equation 1.17), the dissociation constant (Ka) is
described by equation 1.18, the concentration of each species shown in square brackets. The negative of the log hydroxonium concentration is equivalent to the pH, and –logKa is the pKa, which relate as shown in equation 1.19.
log 𝐷 = log 𝑃 + log [
1The distribution coefficient (D) calculates the partitioning of a solute in its native form whether ionised or neutral, and log D this takes into account the solute pKa, solution pH and log P (equation 1.20). The log D value positive for hydrophobic species that partition into the non-aqueous portion or negative for hydrophilic species that partition into the aqueous portion (equation 1.20). Log D correlates well with hydrophobic retention in RPLC, where a more-positive log D value corresponds to stronger retention on those columns (Poole 2009).
4.
HPLC of polar pharmaceuticals
Page 21 of 246
is a serious problem since well-established RPLC requires a solute to be hydrophobic in order to retain on those columns. Polar compounds aren’t retained by RPLC and chromatographic separation can be impossible by this somewhat traditional method. Some alternative variations of RPLC have been developed to manipulate the hydrophobicity of the solute and gain retention on those columns. Low pH mobile phase can be prepared by adding a weak or strong acid such as formic (FA) or trifluoroacetic acid (TFA), respectively. When an acidic solute is deprotonated it is negatively–charged and more hydrophilic. Conversely, adding a strong acid to this will protonate, thus neutralise, the acid, and it is more hydrophobic. Therefore FA and TFA are used to retain some acids by RPLC. A similar strategy is used for basic solutes: the protonated form of a base is positively-charged and more-hydrophilic; the unprotonated form is neutral and more-hydrophobic. Thus adding a strong base to RPLC mobile phase raises the pH, neutralises basic species and enhances hydrophobic retention on those columns (McCalley 2004, Davies et al. 2008). A potential flaw in the high pH technique is the liability of silica to dissolve through hydrolysis by hydroxyl ions (OH-). This can be overcome using hybrid silica, which substitutes ethylene
5.
Ion pair chromatography
Addition of Ion-Pairing (IP) agents such as trifluoroacetic acid (TFA) also facilitate retention of charged polar species. A drawback of IP is a reduction of detector sensitivity, especially in Electrospray Mass Spectrometry (ESI-MS) where IP agents can suppress analyte ionisation (Heaton et al. 2011). Additionally, it is unclear what the precise retention mechanism is in IP, for example Dai et al. reported for basic solutes that approximately 3% of molecules associate with the ‘ion pair’ agent TFA in aqueous solution (Dai et al. 2005).
6.
Hydrophilic Interaction Chromatography
Page 23 of 246
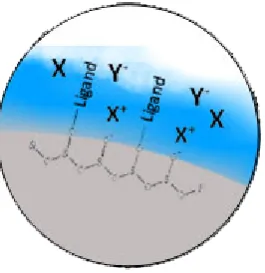
Figure 1.2. Simple scheme of HILIC retention with neutral (X), basic (X+) and acidic (Y-)
solutes
The specific interactions between solute and stationary phase have been debated in the literature (Irgum et al. 2006, 2011, Kawachi et al. 2011, McCalley et al. 2010, 2013, 2014, Gritti 2013c, Guo et al. 2005, Laemmerhofer et al. 2008, Bicker et al. 2008). That discussion primarily discussed whether or not partitioning is the dominant retention mechanism in HILIC, as proposed by Alpert (Alpert 1990). A 2006 review by Irgum of HILIC literature was inconclusive, with some of the authors covered suggesting surface-solute interactions, e.g. on Amino columns (Irgum et al. 2006). It was suggested by LammerHofer Lindner and Bicker that the retention mechanism is complex, with contributions from partitioning, ion-exchange and hydrogen-bonding (Laemmerhofer et al. 2008, Bicker et al. 2008). McCalley demonstrated that ion-exchange can be mediated by the buffer salt concentration, with high buffer concentration shielding the solute from stationary phase charges (McCalley 2010b). In that study it was noted by the author that ion-exchange differs greatly between HILIC columns (McCalley 2010b).
was good agreement that HILIC columns can be described as four broad categories (ligand chemistry described in brackets, approximate structures shown):
1. Cation-exchangers (e.g. Bare Silica)
(e.g. Silica Hydride)
2. Neutral polar bonded ligand (e.g. Amide, BEH Amide)
3. Zwitterionic polar bonded bonded ligand (e.g. ZIC-HILIC)
Page 25 of 246
4. Anion Exchangers (e.g. Amino)
solute can hydrogen-bond with the stationary phase (Kumar et al. 2013). An alternative type of silica was developed around 1991 and has been developed by Pesek as ‘type C’ silica. On these columns, acidic silanols groups are replaced by ‘silica hydride’ groups and there ought to be virtually no exposed silanols (Yang et al. 2013). Applications using type C silica use formic acid as a mobile phase additive, which is reasonable given the manufacturer’s claim of an inert stationary phase. However, a report from Watson concluded that ‘type C’ silica behaves remarkably similar to bare silica (Bawazeer et al. 2012) and this phase has shown poor peak shapes in some literature when using Formic Acid as buffer (Yang et al. 2013). It is unclear if type C silica offers alternate selectivity compared to bare silica and therefore that was considered in this study. Acetone has been used as a mobile phase organic modifier in place of acetonitrile by the Haddad group (Hutchinson et al. 2012) and by Heaton for its use in MS (Heaton et al. 2011), but it is unclear how retention compares in acetone to the more typical acetonitrile.
Page 27 of 246
However when those authors used ‘peak parking’ to monitor solute movement in the stationary phase, where solute band diverted is diverted to a second column with no mobile phase flow and allowed to diffuse along the column bed, they found diffusivity was low, in contrast to high diffusivity in the mobile phase. The authors attributed that to a relatively high microviscosity of the water layer held to the stationary phase (Gritti et al. 2013c). Heaton et al. measured diffusion of hydrophilic species on comparable columns with matched retention factors and observed a similar effect, suggesting that adsorption via possible hydrogen bonding between solute and stationary phase surface can contribute to retention (Heaton et al. 2014a).
HILIC is compatible with polar compounds, although is yet to be incorporated into a generic method scheme for the analysis of polar pharmaceuticals. The retention mechanism in HILIC is complex and poorly understood, therefore research into the HILIC retention mechanism, with a focus on selectivity and peak efficiency, should lead to a polar ‘tool box’ of generic methods. The role of buffers in HILIC is unclear, and requires investigation on a range of modern HILIC columns. Detection by MS is less effective in the buffers typically used for HILIC methods, due to analyte signal suppression (Kostiainen et al. 2009, Mallet et al. 2004, Law et al. 2000). An objective of this project is therefore to investigate if formic acid can be used as a buffer in HILIC generic methods, as opposed to buffers.
7.
HPLC detection
via mass/charge data. Impurity compounds may not contain chromophores thus ultraviolet wavelength (UV) detectors are ‘blind’ to them. Using MS and UV, small peaks are not meaningful in the absence of reference standards and are not necessarily impurities. Therefore universal detectors, such as the charged aerosol detector (CAD) are a desirable component of a polar ‘tool box’. However CAD is a new technology and although operation is very straightforward (Vehovec et al. 2010), it is poorly understood.
8.
Charged Aerosol Detection
Page 29 of 246
aerosol particles. Other detectors which depend on the formation of aerosol particles, such as evaporative light scattering detection (ELSD) as developed by Charlesworth in 1970 (Charlesworth 1978), suffer from complex relationships between solute concentration and detector response (Guiochon et al. 1988). ELSD, which measures the light scattering of a laser when the aerosol particles cross the beam, is thought to change in detection mechanism with increasing size of particle. CAD is somewhat more straightforward but nonetheless also depends on aerosol particle formation. It is possible there is some commonality between the ELSD and CAD theory insofar as particle formation is concerned. Thus an empirical relationship between solute concentration and detector response might be achievable. A combination of universal detection and a universal response to solute concentration suggest CAD has potential as a HPLC detector in generic methods. Therefore an objective of this project was to evaluate the performance of CAD, in particular with the use of HILIC separations.
9.
Purification of polar pharmaceuticals
Purification by preparative HPLC uses wider-bore columns compared to analytical separations (≥10 mm i.d. preparative, ≤4.6 mm i.d. analytical) to hold sufficient stationary phase so that larger samples can loaded onto the column.
Scale up factor =
𝑑𝑐Prep2𝑑𝑐Analytical2 (1.21)
When scaling up a separation, to maintain the same average mobile phase velocity the flow rate is scaled up in proportion to the ratio of the squared column diameter (1.21). The injection volume is scaled up by the same factor (1.21) to maximise the loading of sample. Preparative HPLC commonly employs sample loads far above the column capacity, and separation performance is degraded as a result of shifts in retention and broad peaks with low efficiency.
Purification studies using HILIC are scarce in the scientific literature, although this is a necessary application of the technique. McCalley reported in 2007 that bare silica HILIC column(s) have capacity around ten times higher than RPLC for strong bases (McCalley 2007), which are particularly problematic in RPLC (McCalley 2010a). Gritti and Guiochon studied the overloading of strong bases propranolol and amitriptyline hydrochloride using a bridged ethylene hybrid (BEH) silica in HILIC (Gritti et al. 2015), reporting similar improvements over RPLC. This study used a charged surface hybrid (CSH)-C18 RPLC column, which contained positive charges to control solute repulsion, which is thought to be responsible for the tailing overload of charged bases even at low solute concentration (Gritti et al. 2015). Bonded phase columns are available with diverse chemistries in HILIC, which
Page 31 of 246
et al. 2011). However none of these columns have featured in HILIC purification or
loadability studies.
10.
Focused Gradient Liquid Chromatography and
At-Column Dilution
HILIC. Therefore that strategy was employed in this project to HILIC-prep separations. At-column dilution was described by Neue to aid loading of poorly-soluble compounds (Neue et al. 2003). In this technique, the sample is introduced onto the column slowly via a second
pump, which is diluted at the column head by a second flow of weakly-eluting mobile phase mixed in to the sample flow using a T-piece (Fig. 1.4). This was employed in this project to further enhance preparative performance.
Page 33 of 246
11.
Objectives
The principle interest of this project is the analysis and purification of hydrophilic drug-like solutes and polar “building block” molecules. The present study evaluates HILIC in a generic method setup. Choice of some basic parameters is necessary before HILIC methods can be implemented in a generic setup, namely the following.
1. Suitable mobile phase buffer
A detailed study of mobile phase buffers including salt and simple acid buffers was necessary. Previous studies by Watson et al. have suggested simple acid buffers may not be suitable on type C silica phases (Bawazeer et al. 2012), thought to contain Si-H bonds as ligands (Yang et al. 2013). A study using a bare silica HILIC column suggested formic acid may not be suitable for basic solutes (McCalley 2007), but this has not been evaluated for alternative bonded-phase columns.
2. Suitable stationary phase
3. Universal detection
Charged aerosol detection is supposedly a universal detector, responding to any non-volatile solute, with uniform response, independent of solute chemistry. The calibration curves of solute concentration vs. detector response ought to be simpler than established universal detectors such as ELSD. However these factors have not been evaluated with a sufficiently broad range of solute chemistries. Additionally, the organic-rich solvent used as HILIC mobile phase ought to give excellent detector response due to facile desolvation, as reported for MS elsewhere (Periat et al. 2013b). This has not been evaluated by HPLC for the CAD. It was therefore an objective of this project to elucidate the effect of various parameters and conditions on CAD response with a view to describe optimal use of this relatively novel detector.
4. Viability of HILIC purification.
It is industrially attractive to scale-up analytical methods directly to larger-bore preparative columns for purifications, and although this has been attempted for mixed-mode and aqueous normal phase methods, HILIC can be operated at lower mobile phase salt concentration than these modes (e.g. 5mM cf. 20mM) which simplifies work-up as the salt is removed to produce a pure product (Underwood May 2014). It was therefore an objective of this project to develop some generic HILIC analytical methods suitable for polar pharmaceuticals and apply those to purification in a proof-of-concept study.
5. Suitable sample diluent
Page 35 of 246
Chapter 2
Page 37 of 246
1.
Instrumentation
a.
HILIC buffer experiments
These were performed with a 1290 binary high pressure mixing UHPLC instrument (Agilent, Waldbronn, Germany) with Chemstation, photodiode array UV detector (0.6 µL flow cell) and 5 µL injections.
b.
Charged Aerosol Detector experiments
c.
HILIC Generic and focused method development
These were performed at GlaxoSmithKline laboratories, using an Agilent 1100 system (Agilent, Waldbronn, Germany) with Chemstation, binary pump, UV Diode Array Detector (DAD) and 1 µL injections.
d.
HILIC prep experiments
These were performed at GlaxoSmithKline laboratories, using a Waters prep system with Masslynx, quaternary pump, and automated fraction collection, QDa mass spectrometer with an electrospray interface, UV diode array detector and UV post-fraction detector. Fractionation was directed by the MS, which was set to sufficiently high sensitivity such that fractions were discarded to waste in this proof-of-concept study.
2.
Conditions
a.
Injection
Chromatographic peak shape can be sensitive to the injection volume used to introduce the sample. Dolan advised this be limited to around 15% of the peak volume (Dolan 2014) with a rough ‘rule of thumb’ to keep injection volumes below 16uL for the analytical column and particle dimensions used in these studies (Dolan 2014). Above this, volume overload can occur, which reduces peak efficiency thus reduces resolution (Rs). Injection volumes were
Page 39 of 246
volume (1 µL) was also found suitable for flow injection analysis (Chapter 4, 5). Preparative experiments used custom injection volumes as described in Chapter 6.
3.
Chemicals and reagents
All test solutes, and rubidium nitrate were obtained from Sigma-Aldrich (Poole, U.K.). Acetonitrile (ACN, far UV grade), ammonium formate (AF) and orthophosphoric acid (PA) were obtained from Fisher (Loughborough U.K.). AF buffers were prepared by adjusting aqueous solutions to pH 3.0 with formic acid such that the over-all concentration of AF in the mobile phase after organic solvent addition was 5 mM. The pH values of the mobile phase quoted are those either in the aqueous portion of the buffer (ww pH) or alternatively
as measured in the organic-aqueous combination with the electrode calibrated in aqueous buffers (ws pH).
4.
Probe solutes
Chapter 3
Comparison of peak shape in
hydrophilic interaction
Abstract
Page 43 of 246
1. Introduction
ionisation mass spectrometry. However, use of buffers can cause depression of the electrospray signal that increases with concentration over the typical range (5–50 mM) employed (Kostiainen et al. 2009, Mallet et al. 2004, Law et al. 2000). Even at the 5 mM level, it was shown that AF can cause greater signal suppression for acidic and basic pharmaceuticals compared with the use of simple acidic solutions of 0.1% formic acid (FA), which are commonly used. An added advantage of these acid solutions is that they are easier to prepare than mobile phases containing buffers. Nevertheless, it has been shown that ACN-water mixtures containing formic acid alone can give rise to poor peak shape in HILIC for acidic and basic solutes, whereas good peak shapes were obtained with AF buffers (McCalley 2007). However, these studies were performed solely on a bare silica column. It is possible that the strong ionic interactions with ionised silanols on this type of phase are contributory to this poor peak shape with FA, and that buffers are unnecessary with other types of HILIC columns (Kumar et al. 2013). For example, bonded phase (e.g. with amide ligands) materials prepared on inorganic–organic hybrid silicas show much reduced ionic interactions. Furthermore, silica hydride materials (Type C silica) are available for HILIC-type separations. It is claimed that this new type of stationary phase has significant differences in terms of chemical structure to traditional silicas, which are mainly populated with polar silanol groups. In contrast, Type C silica apparently has surface silicon-hydride groups (Pesek et al. 2008, Boysen et al. 2011). The term “aqueous normal phase” (ANP) has been
Page 45 of 246
ionic inter-actions, so the use of buffers might be unnecessary with such phases, if ionised silanol groups were the cause of peak shape problems. Indeed, separations on these phases are often reported with ACN-water mixtures containing only 0.1% formic or acetic acids (Boysen et al. 2011, Pesek et al. 2008, Bawazeer et al. 2012) although no comment has been made in these reports concerning the lack of use of buffers, or whether their absence gave rise to any detrimental (or even beneficial) effects. The aims of this paper were to compare the use of buffers with acid solutions for acidic, basic and neutral solutes separated on a variety of stationary phases, including bare silica, amide bonded onto hybrid silica, zwitterionic and silica hydride phases. These materials are considerably different in their retention characteristics towards ionised solutes, and therefore might produce different results in the various mobile phases. In this way we hoped to gain information to assist appropriate mobile phase selection for use in HILIC and HILIC with mass spectrometric detection. This study is divided between initial work to establish a pragmatic buffer choice for ongoing work in the project (Chapters 4-6), and detailed studies to further elucidate the phenomena responsible for those results.
2. Experimental
Initial experiments were peformed with an Agilent 1100 binary HPLC instrument (Agilent, Waldbronn, Germany) with Chemstation, UV variable wavelength detector and 5µL injections.
flow cell) and 5 µL injections. The columns used (all 25 × 0.46 cm ID, except where stated) were Cogent Silica C (4 µm particle size, pore size 100˚A, surface area 350 m2/g) from
Microsolv (Eatontown, USA), Atlantis silica (5 µm particle size, pore Size 100 Å, surface area 360 m2/g) from Waters (Milford, USA), ZIC-HILIC (5 µm particle size, pore size 200 Å, surface
area 140 m2/g) from Merck-Sequant (Umeå, Sweden) and XBridge BEH Amide (15 cm ×
0.46 cm, 3.5 µm particle size, pore size 140 Å, surface area 190 m2/g) from Waters. By
replacing the column with a zero dead volume fitting, the extra-column bandspreading of the instrument was estimated to reduce column efficiency by less than 5% even for a non-retained peak on the most efficient column. Temperature was maintained at 30°C using the Agilent column compartment. Acetonitrile (far UV grade), ammonium formate and orthophosphoric acid were obtained from Fisher (Loughborough U.K.). AF buffers were prepared by adjusting aqueous solutions to pH 3.0 with formic acid such that the over-all concentration of AF in the mobile phase after organic solvent addition was 5 mM. Standards were prepared at a concentration of 50 mg/L and made up in the exact mobile phase. The pH values of the mobile phase quoted are those either in the aqueous portion of the buffer (ww pH) or alternatively as measured in the organic-aqueous combination with the electrode
calibrated in aqueous buffers (ws pH). All test solutes, and rubidium nitrate were obtained
Page 47 of 246
Asymmetry factor was measured at 10% of peak height by dividing the width of the trailing edge of the peak by that of the leading edge. The columns were operated in the region of their optimum flow (1.0 mL/min for silica and hydride silica, 0.5 mL/min for zwitterionic and amide).
𝑁 =
𝑀12Page 49 of 246
3. Results and discussion
3.1. Buffer and solute properties.
Table 3.1 indicates the pH, ionic strength and buffer capacity of the three mobile phases used, 5 mM ammonium formate (AF) adjusted to pH 3.0 with formic acid, 0.1% (v/v) formic acid (FA), and 0.1%(v/v) orthophosphoric acid (PA), if prepared in aqueous solution. Ammonium formate and formic acid are soluble in high concentrations of ACN; they are also volatile additives and thus extremely suitable for use in HILIC with mass spectrometry detection (Periat et al. 2013b). PA is an alternative acid additive used by several column manufacturers e.g. (Halo Penta-HILIC brochure 2014). It was used successfully by Mant and Hodges for the HILIC separation of peptides using a 0.2% concentration in 85% ACN, using UV detection (Mant et al. 2008). These authors sought a more hydrophilic acid additive than trifluoroacetic acid (TFA). We showed by experiment in the present study that 0.1% PA was completely soluble even in 100% ACN, with no evidence of precipitation. PA is not volatile and is thus unsuitable for use with mass spectrometry detection. However, PA was studied due to the lower ww pH and ws pH given by this relatively strong acid, and thus its better
A relatively low concentration of AF was employed, as such concentrations are generally preferred when mass spectrometry is used for detection. While the buffer capacity of formic acid in water is the least of the three solutions, it is still appreciable. ws pH values(in the
organic–aqueous mixture) are shown for 85% ACN solutions. The choice of this measurement as opposed to ww pH in the aqueous fraction alone is not straightforward.
Detailed computer modelling by Tallarek and co-workers (Melnikov et al. 2011, 2012), suggests that there is a layer exclusively of water molecules tightly bonded to the surface of bare silica; in this case the use of wwpH may be more appropriate. However, other
experimental work suggests there may be significant numbers of acetonitrile molecules in the interfacial region (Rivera et al. 2013). Fig. 3.1 shows the structure, pKa, charge and log D/log P values at ww pH 3.0 and 5.0 for the 12 probe solutes used, which were a mixture of
Page 51 of 246
Table 3.1 pH, molarity and buffer capacity of aqueous buffer solutions and
dilute acids;
wspH measured in 85% ACN. *This was used as 0.1% of an 85%
solution (14.6 mM/L).
Buffer ww pH ws pH Molarity
(mmol/L)
Buffer capacity
(mmol/L pH)
0.1% Formic Acid 2.7 2.9 2.2 9.7
5mM Ammonium Formate pH 3.0 3.0 5.2 6.1 14.7
0.1% Phosphoric Acid* 2.1 2.0 7.9 26.1
3.2 Initial studies to establish a generic HILIC mobile phase
buffer: performance of four different phases with three
mobile phase buffers
Initially this study was performed on an Agilent 1100 system with a view to establish a generic mobile phase buffer system for the remainder of the project. Eleven solutes were used as probe compounds, shown in Fig. 3.1 with the exception of Uracil, which was added to later parts of this work (3.3) to characterise a somewhat broader selection of hydrophilic neutral solutes. Each solute was injected individually onto the respective column in mobile phase buffered either by ammonium formate (5mM ww pH 3 with formic acid), formic acid
asymmetry was measured at 10% peak height (As0.1). Peak shape in terms of efficiency and
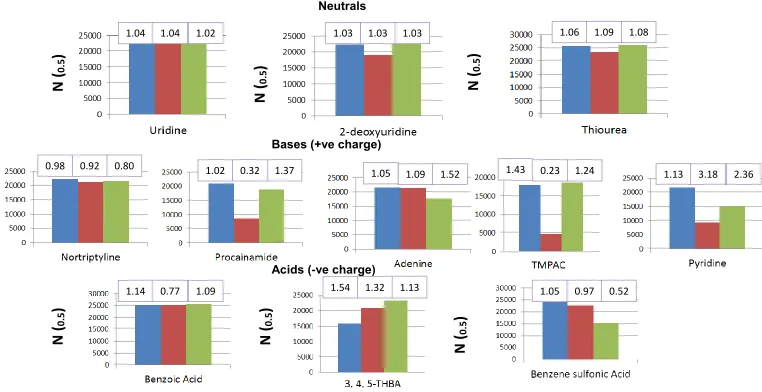
Fig. 3.2a Initial results for eleven probe compounds, Atlantis column. Vertical scale is peak efficiency at half-height in plates per column; peak asymmetry at 10% height shown in purple boxes above efficiency bar plots. Stationary phase Atlantis (4.6 x 250mm, 5µm) mobile phase 89.425% ACN with respective buffer. Blue = Ammonium Formate 5mM; Red = Formic Acid 0.1% v/v; Green = Phosphoric Acid 0.1% v/v
Neutrals
N (
0 .5)
N
(
0.5)
N (
0
.5
)
1.04 1.04 1.02 1.03 1.03 1.03 1.06 1.09 1.08
Bases (+ve charge)
N (
0
.5
)
0.98 0.92 0.80 1.02 0.32 1.37 1.05 1.09 1.52 1.43 0.23 1.24 1.13 3.18 2.361.05 0.97 0.52
Acids (-ve charge)
N
(
0.5)
1.14 0.77 1.09
N (
0
.5
)
1.54 1.32 1.13
N (
0
.5
)
Fig. 3.2b Initial results for eleven probe compounds, BEH Amide column. Vertical scale is peak efficiency at half-height in plates per column; peak asymmetry at 10% height shown in purple boxes above efficiency bar plots. Stationary phase BEH Amide (4.6 x 150mm, 3.5µm) mobile phase 89.425% ACN with respective buffer. Blue = Ammonium Formate 5mM; Red = Formic Acid 0.1% v/v; Green = Phosphoric Acid 0.1% v/v
Neutrals
N (
0 .5)
N (
0 .5)
N (
0 .5)
0.84 0.93 0.85 0.87 0.95 0.88 1.02 1.12 0.97
Bases (+ve charge)
N (
0
.5
)
1.04 0.51 0.44 1.03 0.69 0.731.27 0.58 0.85 1.25 0.41 0.47
1.14 0.54 0.34
Acids (-ve charge)
N (
0
.5
)
1.08 1.36 1.07
N (
0
.5
)
2.75 1.12 0.93
N (
0
.5
)
Page 55 of 246
Fig. 3.2c Initial results for eleven probe compounds, Cogent Type C silica column. Vertical scale is peak efficiency at half-height in plates per
column; peak asymmetry at 10% height shown in purple boxes above efficiency bar plots. Stationary phase BEH Amide (4.6 x 150mm, 3.5µm) mobile phase 89.425% ACN with respective buffer. Blue = Ammonium Formate 5mM; Red = Formic Acid 0.1% v/v; Green = Phosphoric Acid 0.1% v/v Neutrals
N (
0 .5)
N (
0 .5)
N (
0 .5)
1.02 0.89 0.88 0.94 0.90 0.88 0.94 0.92 0.92
Bases (+ve charge)
N (
0
.5
)
0.90 1.87 0.94 0.93 2.15 2.481.11 2.12 1.77 3.54 1.37 1.73 1.42 2.59 2.34
Acids (-ve charge)
N (
0
.5
)
0.97 0.96 0.93
N (
0
.5
)
1.64 0.96 0.98
N (
0
.5
)
Fig. 3.2d Initial results for eleven probe compounds, ZIC-HILIC column. Vertical scale is peak efficiency at half-height in plates per column; peak asymmetry at 10% height shown in purple boxes above efficiency bar plots. Stationary phase BEH Amide (4.6 x 150mm, 3.5µm) mobile phase 89.425% ACN with respective buffer. Blue = Ammonium Formate 5mM; Red = Formic Acid 0.1% v/v.
Neutrals
N
(
0.5)
N (
0 .5)
N (
0 .5)
1.33 1.28 1.37 1.34 1.36 1.38
Bases (+ve charge)
N (
0
.5
)
1.42 0.28
1.54 0.53 1.42 1.86 2.09 0.24 1.51 0.75
Acids (-ve charge)
N (
0
.5
)
1.51 1.50
N (
0
.5
)
1.58 1.30
N (
0
.5
)
3.3. Detailed studies to elucidate phenomena responsible for
results in 3.2
3.3.1 Comparison of performance of four different stationary
phases with three different buffers
the formation of swollen hydrogels on polymerically-functionalised phases like ZIC-HILIC (Dinh et al. 2011, 2013), and seems likely to emphasise the contribution of the partition mechanism to retention. With each mobile phase and each column, the retention of cationic solutes (nortriptyline to pyridine) was considerably higher than for neutrals. Preferential retention of cations compared with neutrals in AF or FA was shown for all columns, but was less pronounced on the amide phase. While the hydrophilicity of cations contributes to this increased retention, ionic interactions are likely to give a strong influence on retention. Thus nortriptyline (log D ww pH 3.0 = 1.1) is only moderately hydrophilic, but its high pKa (10.2)
results in protonation in all mobile phases leading to additional ionic retention. TMPAC (log D ww pH 3.0 = −2.2) is considerably more hydrophilic, which combined with similar ionic
interactions (both nortriptyline and TMPAC are unipositively charged under the analysis conditions) leads to stronger retention than for nortriptyline. The retention of the weak base pyridine (pKa 5.1, log D ww pH 3.0 = −1.0) was much greater in PA compared with AF.
The lower pH of the PA mobile phase could result in greater protonation of this weak base in PA increasing its hydrophilicity and also increasing ionic retention caused by residual silanol ionisation (Fig. 3.3a). The persistence of ionic interactions on all columns at the low pH of PA is indicated by the observation that neutral uridine has a more negative log D
ww pH 3.0 value (−2.1) but considerably smaller retention in the PA mobile phase than
Page 59 of 246
groups in place of silanols. The same observation of high retention of bases on hydride phases, and the possibility of ionic retention of these solutes, has also been noted by other authors (Bawazeer et al. 2012). Similarly, the low retention of the anionic solutes such as 3,4,5-trihydroxybenzoicacid (pKa 4.1, log D ww pH 3.0 = 0.60) and particularly of
benzene-sulfonic acid, BSA (pKa −0.8, log D ww pH 3.0 = −2.0) on the silica and hydride columns (e.g.
Page 61 of 246
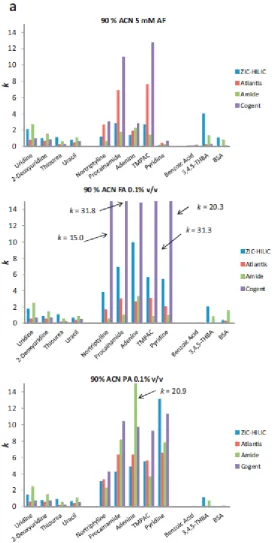
Fig. 3.3a. Retention factor (k), for neutrals (uridine–uracil), cationic(nortriptyline–
pyridine) and anionic solutes (benzoic acid-BSA) on four different columns using
mobile phases with 90% ACN and various buffers. Solutes TMPAC =
trimethylphenylammonium chloride; THBA = trihydroxybenzoic acid; BSA =
benzenesulfonic acid. Column temperature 30°C. Solute concentration 50 mg/L,
Fig. 3.3b. Column efficiency (N, statistical moments method) for neutrals
(uridine–uracil), cationic(nortriptyline–pyridine) and anionic solutes (benzoic
acid-BSA) on four different columns using mobile phases with 90% ACN and
Page 63 of 246
Fig. 3.3casymmetry factor (As0.1) for neutrals (uridine–uracil), cationic(nortriptyline–
pyridine) and anionic solutes (benzoic acid-BSA) on four different columns using
mobile phases with 90% ACN and various buffers. Solutes and conditions as per
Fig. 3.2a.
Fig. 3.3 (a) Retention factor (k), (b) column efficiency (N, statistical moments method) and (c) asymmetry factor (As0.1) for neutrals (uridine–uracil), cationic(nortriptyline–pyridine)
Fig. 3.4. ZIC-HILIC column (a) nortriptyline with mobile phase 90% ACN, 5 mM overall AF
pH 3; (b) nortriptyline with 90% ACN containing 0.1% FA; (c) BSA with AF; (d) BSA with FA;
(e) pyridine with AF; (f) pyridine with FA. Flow rate 0.5 cm3/min.
Page 65 of 246
hydrophilic retention is the critical factor in determining peak shape. This balance may even be more favourable at higher pH (Periat et al. 2013c). While superior performance with AF may in part be related to the deactivating effect of the ammonium ion, it may be that the salt encourages the formation of the water layer on the column surface, giving improved results. The ionic strength of 0.1% FA in water is the least of the three in Table 3.1, but is likely to be considerably reduced in an 85% acetonitrile solution, as indicated by the rise in
ws pH. The true thermodynamic ss pH (which pertains to the pH in the aqueous–organic
phase using calibration buffers prepared in the same solution) is related to the ws pH by the
relationship (3.2):
ss
pH =
swpH – δ
(3.2)
Where δ is a term that incorporates both the Gibbs free energy for transference of 1 mol of protons from the standard state in water to the standard state in the hydroorganic solvent at a given temperature, and the residual liquid junction potential (the difference between the liquid junction potential established during calibration in aqueous solutions, and that in the hydroorganic mixture).The value of δ is about −1.1 in 85% ACN (Gagliardi et al. 2007), implying ss pH = 4.0 and a concentration of formate anions in the mobile phase of only
around 0.1 mM/L. While the ws pH of PA is lower than that of FA, the concentration of
known that have investigated this possibility in the high concentrations of ACN relevant to HILIC studies. It is possible that some ion-pairing in AF moderates ionic interactions with the stationary phase. Ion pairing would also reduce solute hydrophilicity: both effects may contribute to the reduced retention of bases shown in Fig. 3.3a. As mentioned previously however, all these arguments are complicated by the problem of whether physical parameters in water or in the aqueous–organic mixture should be considered. The ionic strength of the mobile phase may well have influence on the thickness of the water layer which may be beneficial for ionic species. The presence of negatively-charged silanol groups on the stationary phase surface attracts cations, such the buffer cation [NH4]+. The cation
Page 67 of 246
Fig. 3.5 Comparison of retention (k vs. k) plot for bare silica (Atlantis) vs. hydride silica
(Cogent) using 90% ACN containing 5 mM ammonium formate ww pH 3.0. Other conditions
as Fig. 3.2.
3.3.2. Effect of mobile phase water concentration and buffer
on retention and peak shape
Page 69 of 246
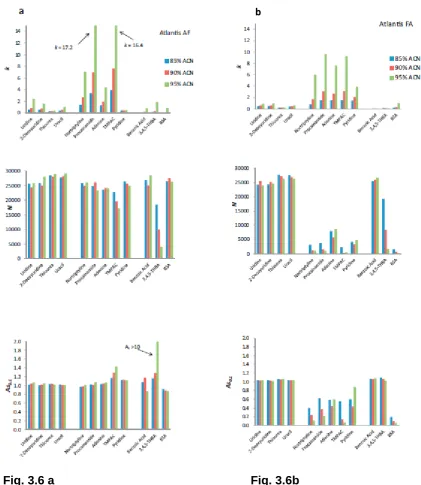
Fig. 3.6 a Fig. 3.6b
Fig. 3.6a,b. Retention factor (k), column efficiency (N) and asymmetry factor (As0.1)
measurements for Atlantis silica column using 85–95% ACN containing (a) 5 mM
ammonium formate ww pH 3.0 (b) 0.1% formic acidasymmetry data in FA not shown
for procainamide as split peaks were obtained. Other conditions see Fig. 3.2.
Fig. 3.6c
Fig. 3.6d
Fig. 3.6c,d. Retention factor (k), column efficiency (N) and asymmetry factor
(As0.1) measurements for BEH amide column using 85–95% ACN containing
(c) 5 mM ammonium formate ww pH 3.0 and (d) 0.1% formic acid; asymmetry
data in FA not shown for procainamide as split peaks were obtained. Other
Page 71 of 246
mobile phase was reduced (McCalley et al. 2008b). Remarkable again is the drastic collapse in efficiency on both columns for the anionic and cationic solutes in FA compared with AF, which occurs over the whole range of water concentrations (Fig. 3.6b and d). Again, this drop in efficiency is caused mostly by serious fronting of the peaks in FA. This result once more indicates the necessity for use of buffers in order to achieve acceptable efficiencies for these solutes, even using a stationary phase like BEH amide that possesses reduced ionic interaction characteristics.
3.3.3. Causes of poor peak shape for cationic solutes in formic
acid
Page 73 of 246
3.3.4. Effect of buffer salt concentration and salt cation on
retentionof cationic compounds
Fig. 3.8. Effect of buffer salt on retention using Atlantis silica column. Mobile
phase90% ACN containing salt adjusted to ww pH 3.0 with FA.
Page 75 of 246
increased polarisability. Thus for the monovalent cations elution strength is generally in the order (Harris 2007):
Cs+ > Rb+ > K+ > NH4+ > Na+ > H+ > Li+
Ions which are smaller in their non-hydrated state such as Li+ have a higher charge density,
attracting a larger number of water molecules, resulting in a larger hydrated radius. It is interesting that the weak base pyridine and also adenine show no evidence of ionic retention in Fig. 3.7, suggesting they are not protonated in the mobile phase. Pyridine has a pKa of 5.1 in water, indicating that if pH values in water were applicable, it should be completely protonated in a mobile phase of ww pH 3.0. The ws pH of a similar mobile phase
containing 85% ACN (Table 3.1) is ∼5.1, and combined with the effect of the depression of pKa of bases in solutions of high organic solvent composition, would indicate that pyridine is not protonated, explaining the apparent lack of ionic retention and hydrophilic retention of this compound. The increased retention of these weak bases in 90% ACN containing 0.1% FA and PA as shown in Fig. 3.2a and discussed in Section 3.2 above, could be due to protonation of the compounds at the lower ws pH of these mobile phases compared with
that of AF. These results indicate that ws pH should be considered in explaining results in
HILIC despite the supposition of a layer of water on the surface of the phase. It is also possible that ionic interactions could occur between solutes situated in the bulk mobile phase and the column, in which case ws pH values would also be appropriate.
Conclusions
and phosphoric acid (PA) on four HILIC columns of substantially different properties. Relatively little difference was found between these three mobile phases in terms of retention or column efficiency for the neutral solutes. While peak shapes of ionogenic solutes, particularly cationic compounds, were in general very good using AF, considerable deterioration in peak shape was observed when FA was used. The same result was obtained both on stationary phases with strong ionic retention characteristics (bare silica and hydride silica, which surprisingly showed very similar retention selectivity)and those exhibiting much lower ionic effects (hybrid silica amide and zwitterionic). Peak shape in FA became still worse as the sample load increased. Peak shape is likely to be related to the different pH and ionic strength of the various buffers, as measured in the aqueous or aqueous–organic portion of the mobile phase. For example, the ionic strength of FA solutions in high concentrations of ACN is very low, and thus may adversely affect the formation of the water layer. In contrast, the presence of a reasonable concentration of ammonium ions is likely to encourage formation of the layer as well as masking some of the effects of ionic interactions. Ionic retention of bases was demonstrated by increasing the salt concentration, and by substitution of some of the ammonium for a rubidium salt, which in both cases reduced retention. (Partial) suppression of cationic retention on ionised silanol groups afforded by the use of low pH PA did not improve column efficiency compared with use of AF. Differences in the pH of the various buffers will affect the relative contribution of hydrophilic and ionic mechanisms to retention, which in turn may have an important influence on peak shape. Despite the supposition of a water layer on the column surface, the consideration of ws pH values seems important in explaining the retention of weak bases
Page 77 of 246
Chapter 4
Performance of charged aerosol
detection with hydrophilic
Abstract
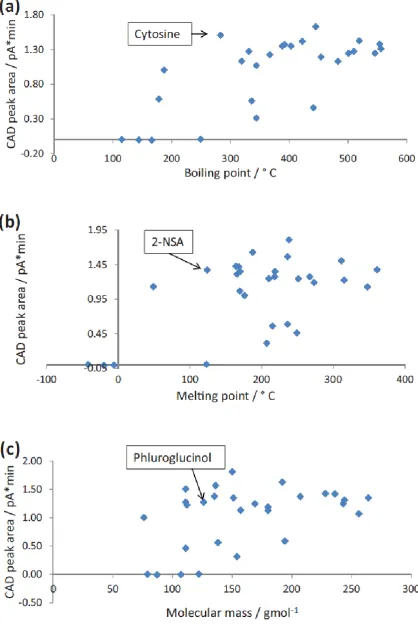
Page 79 of 246
1. Introduction
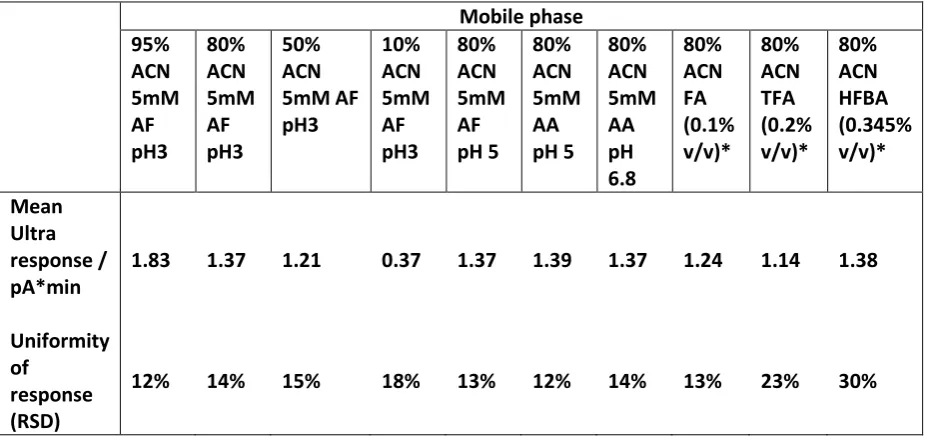
already understood, although commercial instruments have some differences from the prototype described by Dixon and Peterson (Dixon et al. 2002). These differences are sometimes ignored in the literature in discussions of the mechanism of operation of commercial instruments (Almeling et al. 2012, Shaodong et al. 2010). Nevertheless, the process in both may involve transfer of charge from the sheath gas (e.g. nitrogen)to the solute particles (see Fig. 4.1), which is distinct from the more direct exposure of the corona discharge to the eluent as occurs in atmospheric pressure chemical ionisation (APCI) sources used in mass spectrometry. As CAD response (along with that of all aerosol detectors) depends on the formation of solid particles, it is limited to solutes that have low volatility at the operating temperature. However, few studies have investigated in detail any relationship between volatility and detector signal. The ability to differentiate between solute and mobile phase determines the detection limit, which has been quoted as 0.1–1 ng sample on-column (Hutchinson et al. 2012, Cohen et al. 2012). Buffers are often critical additives to HPLC mobile phases in any separation mode, but are potentially detrimental to CAD performance. In HILIC, buffers can lead to better peak shape than simple acid solutions (McCalley 2007, Heaton et al. 2014c, Pesek et al. 2013), thus we wished to investigate their influence on CAD sensitivity. Furthermore, as with other aerosol-based detectors, detector response is dependent on organic solvent content. While changing detector response with organic solvent concentration has been investigated for its detrimental effect on response uniformity in gradient elution (Khandagale et al. 2014, Gorecki et al. 2006, Hutchinson, Li et al. 2010), high organic concentrations as used in HILIC may be advantageous for sensitivity
non-Page 81 of 246
linearity of aerosol formation and a change in detection mechanism with the size of aerosol particles (Stolywho et al. 1983). The mechanism of detection in CAD is more straight-forward than ELSD (Vervoort et al. 2008), and CAD calibration curves can be close to linear over small concentration ranges (Vehovec et al. 2010). The detailed mechanism that causes non-linearity of CAD calibration curves and their profile has not been described to date. Detector response for aerosol-based detectors is believed to be mostly independent of solute chemistry (Vervoort et al. 2008). However this factor has also not been investigated in much detail with respect to CAD for a sufficiently broad selection of solute structures. Approximately 50% of drug active pharmaceutical ingredients (API) are salts (Paulekuhn et al. 2007), and many salt counter ions do not contain chromophores. An important benefit of
Fig. 4.1 Simple Schematic of CAD operation
2. Experimental
2.1 Chemicals and reagents
Page 83 of 246
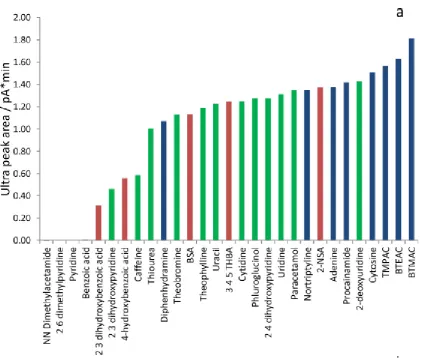
Table 4.1. Identities, structures and physico-chemical characteristics of test compounds.
Solute Structure MW FW Log D
(pH 3)***
BP / °C MP / °C
4-hydroxybenzoic acid 138 138 1.46 336* 213.5
Caffeine 194 194 -0.41 178 238
Diphenhydramine 255 292 -0.013 344* 168#
3,4,5–THBA 170 170 0.6 501* 261.5
BSA 158 180 -2.35 319** 65.5
BTEAC 192 228 -1.67 445 191
Procainamide 235 272 -2.38 422* 167#
Solute Structure MW FW Log D (pH 3)***
BP / °C MP / °C
Cytidine 243 243 -3.51 546* 225
Phluroglucinol 126 126 0.39 331* 204.5
2,4–dihydroxypyridine 111 111 -0.4 510* 274
2-NSA 208 230 -1.09 392** 124.5
Nortriptyline 263 300 1 403* 214$
2’-deoxyuridine 228 228 -1.49 519** 165
Theophylline 180 180 -0.31 454* 272
2,3–dihydroxypyridine 111 111 -0.62 441* 245
Page 85 of 246
Solute Structure MW FW Log D
(pH 3)***
BP / °C MP / °C
Benzoic acid 122 122 1.65 249 122.4
Cytosine 111 111 -2.86 283** 322.5
Paracetamol 151 151 0.58 388* 169.75
Thiourea 76 76 -0.82 187* 177
Uridine 244 244 -2.06 556** 165
2,3–dihydroxybenzoic acid
154 154 0.86 344 205
2,6–dimethylpyridine 107 107 -1.11 144 -5.8
BTMAC 150 186 -2.18 239
N,N–
Dimethylacetamide
87 87 -0.48 166 -20
Solute Structure MW FW Log D (pH 3)***
BP / °C MP / °C
Uracil 112 112 -0.97 367** 335
Theobromine 180 180 -0.65 483** 357
* predicted at 760 mmHg using ACD labs program (see Experimental). ** predicted from (www.chemspider.com)
*** average log D from three packages (see Experimental) # value from (www.sigmaaldrich.com)
$ value from (www.chemicalbook.com)
2.2 Equipment and methodology
Page 87 of 246
absorption spectrometry) was controlled at 22°C with the evaporator tube at ambient temperature, while the Veo (concentric flow design similar to those used in mass spectrometry) nebuliser was at ambient temperature and the evaporator tube set to 30°C. The Veo had a power function (PF) designed to ‘linearise’ data, which was set to either 0.67 (this