Facts4Life Primary School Resource:
Pilot Evaluation Report
Full Technical Report
1
Facts4Life Primary School Resource:
Pilot Evaluation Report
Full Technical Report
Evaluation research team:
Emma Bird, Billie Oliver
University of the West of England, Bristol (UWE)
Acknowledgements:
We are very grateful for the quantitative data entry support provided by Parishma Guttoo and Aye Myint Oo (UWE) and qualitative data transcription completed by Leigh Taylor (UWE). We also thank Wendy Bedford, Kelly Green, Belinda Heaven, Pete Kirby, Manda Reedman and Hayley Young for developing the Facts4Life resource. We would like to thank Hugh van’t Hoff, Ali Coles, John Davis and Sue Burling from Facts4Life, and Kelly Green and Pete Kirby from Gloucestershire Healthy Living and Learning for providing the Facts4Life questionnaire measure used in this evaluation and for their support throughout. We would also like to thank all school staff and children who helped us in this evaluation.
This evaluation was funded by Gloucestershire Clinical Commissioning Group.
Contact for details:
Emma Bird
2
Table of Contents
Page number
Executive Summary 4
List of Tables 8
List of Figures 9
Chapter 1: Introduction 12
1.1 Overview 12
1.2 Structure of this report 12
Chapter 2: Context 13
Chapter 3: The Facts4Life Primary School resource 15
3.1 Introduction 15
3.2 Rationale 15
3.3 Content 16
Chapter 4: Aims, objectives and research questions 17
Chapter 5: Evaluation methodology and methods 18
5.1 Introduction 18
5.2 Research design 18
5.3 Sampling 18
5.4 Measures 19
5.4.1 Facts4Life questionnaire 19 5.4.2 Child Health and Illness Profile (Child Edition) (CHIP-CE)
questionnaire 19
5.4.3 Pre-testing of evaluation measures 20 5.5 Qualitative process evaluation 20
5.6 Procedure 20
5.7 Data analysis 21
5.8 Ethical issues 21
Chapter 6: School characteristics 22
6.1 Introduction 22
6.2 Organisational and demographic characteristics 22 6.3 Comparison of intervention and control groups 24
Chapter 7: Facts4Life questionnaire – Descriptive statistics 25
7.1 Introduction 25
7.2 Methods 25
7.3 Descriptive summary of pupil responses 27
7.4 Chapter summary 33
Chapter 8: Facts4Life questionnaire – Statistical comparisons 34
8.1 Introduction 34
8.2 Methods 34
8.3 Statistical comparisons – Results 34
8.4 Chapter summary 37
Chapter 9: Facts4Life questionnaire – Descriptive statistics by
Year group 38
9.1 Introduction 38
9.2 Methods 38
3
Chapter 10: Facts4Life questionnaire – Statistical comparisons
by Year group 52
10.1 Introduction 52
10.2 Statistical comparisons – Results 52
10.3 Chapter summary 64
Chapter 11: Child Health and Illness Profile (CHIP-CE) questionnaire - Descriptive statistics and statistical comparisons
65
11.1 Introduction 65
11.2 Methods 65
11.2.1 Internal consistency of the CHIP-CE 65 11.3 Descriptive summary of pupil responses 66 11.4 Statistical comparisons – Results 67
11.5 Chapter summary 71
Chapter 12: Child Health and Illness Profile (CHIP-CE) questionnaire - Descriptive statistics and statistical comparisons by Year group
72
12.1 Introduction 72
12.2 Methods 72
12.2.2 Internal consistency of the CHIP-CE by year group 72 12.3 Descriptive summary of pupil responses – Years 3 and 4 72 12.4 Descriptive summary of pupil responses – Years 5 and 6 73 12.5 Statistical comparisons – Results 74
12.6 Chapter summary 84
Chapter 13: Qualitative process evaluation – Results 85
13.1 Introduction 85
13.2 Methods 85
13.3 Data analysis 86
13.4 Results 86
13.4.1 Theme 1: Wider implications of Fact4Life 86 13.4.2 Theme 2: Facts4Life content 90 13.4.3 Theme 3: Fact4Life delivery 95
13.5 Chapter summary 98
Chapter 14: Conclusions and recommendations 99
14.1 Introduction 99
14.2 Pilot evaluation conclusions 99 14.3 Strengths and limitations of the pilot evaluation 101
14.4 Recommendations 101
References 103
4
Executive Summary
Overview
Facts4Life is an initiative which aims to help everyone take ownership of their health by exploring illness and developing strategies to build wellbeing.
Led by the Facts4Life team (http://facts4life.org) together with Gloucestershire Healthy Living and Learning (http://www.ghll.org.uk), initial funding was obtained in 2012 for three years from Gloucestershire Clinical Commissioning Group (CCG) to develop, implement and evaluate a school-based health education resource, Facts4Life, in primary schools across Gloucestershire.
In July 2013 the Facts4Life team commissioned the University of the West of England, Bristol to conduct a pilot evaluation the Facts4Life resource. The pilot evaluation aimed to explore the effects of Facts4Life on school children’s health-related attitudes, knowledge and behaviours. Furthermore, it aimed to provide insight into how the resource was received and the factors that could facilitate the dissemination and implementation of the resource more widely.
The key findings from the pilot evaluation are presented in this summary report. The full technical report provides a detailed account of the evaluation methodology,
methods, findings, interpretation and recommendations for future development of the resource.
Pilot evaluation context
In recent years there has been increasing attention paid to the health and wellbeing of children in the UK, with obesity and overweight, physical inactivity, and mental health three areas of particular concern.
There is evidence to suggest that attitudes, beliefs and behaviour established during childhood can continue on into adulthood and as such, it is important to promote good health and wellbeing at an early age. The school environment provides a unique opportunity to promote health and wellbeing. In recognition of the fact that children spend much of their time at school, schools are now being encouraged to actively promote health.
5
The Facts4Life Primary School resource
The Facts4Life resource was designed for use with primary school children aged 7-11 years. Facts4Life follows a pupil-centred approach to learning, in which children themselves are responsible for researching health and wellbeing-related topics of particular interest and importance to them. Facts4Life teaching materials are designed to be cross-curricular and directly linked to the UK National Curriculum.
To support delivery of the Facts4Life intervention, a resource booklet (and accompanying compact disk) was created based on three themes: ‘Introduction to Homeostasis’; ‘Healthy Me’; and, ‘The Family’. The booklet incorporates learning objectives, lesson outlines and suggested activities.
Pilot evaluation methodology and methods
The pilot evaluation consisted of a controlled before-and-after study and a qualitative process evaluation.
Controlled before-and after study
Pupils (n = 324) from ten schools were asked to complete two questionnaires about their health-related attitudes, knowledge and behaviours before the Facts4Life intervention began (baseline) and again approximately one week after the intervention period had ended (follow-up). Findings from five schools adopting Facts4Life (intervention group) were compared with findings from five schools not adopting Facts4Life (control group) to determine whether Facts4Life was associated with any changes in health-related attitudes, knowledge and behaviour.
Qualitative process evaluation
The qualitative process evaluation involved analysis of programme implementation, delivery, engagement and areas for improvement. Pupils (n = 23) and teachers (n = 6) from schools adopting Facts4Life were asked to provide feedback.
Characteristics of schools participating in the pilot evaluation
This pilot evaluation involved ten primary schools located in the Gloucestershire Local Education Authority (LEA). Four schools were community schools, two were voluntary-aided schools, two were voluntary-controlled schools, one school was a foundation school, and one was an academy.
6
Schools allocated to the intervention and control groups were similar, although schools in the intervention group had a statistically higher Ofsted rating and proportion of children eligible for free school meals compared with the control group.
Pilot evaluation findings and conclusions
Questionnaire data suggest that the intervention may have led to small, yet significant, improvements in certain aspects of pupils’ health-related attitudes, knowledge and behaviour. Areas for improvement relate specifically to questionnaire items on illness management and suggest a reduction in children’s perceived reliance on medical intervention when feeling unwell. This is an interesting finding which supports the overarching aim of the project.
There were positive trends in some of the remaining questionnaire items, although these were not statistically significant. This means that in these cases the differences between intervention and control groups may conceivably be linked to the size of the sample and / or external social trends. It could also mean that a longer time period is needed for observable changes to occur.
Qualitative findings provided anecdotal evidence of perceived changes in personal responsibility for health and behaviour, and some examples of perceived changes in wider family behaviour. At this stage it is important to treat these findings with caution as they are representative of some, but not all pupils taking part in the intervention and are not based on quantifiable evidence.
The finding that there was some variation in quantitative and qualitative findings is interesting when trying to interpret the overall results of this pilot evaluation. The qualitative findings suggest that the resource may be having a larger impact upon pupils than the quantitative findings imply. It is possible that the tools used to measure changes in health-related attitudes, knowledge and behaviour were unable to capture the true experiences of pupils involved in this evaluation.
The qualitative process evaluation revealed that the majority of pupils and teachers were positive about the resource. Pupils referred to its enjoyable and novel content, the opportunity to develop research skills, appreciation of group work activities, and enjoyment of interactive as opposed to didactic approaches to teaching and learning. Pupils expressed preferences within the range of activities undertaken, and alternatives were suggested. The findings support the view that the resource is most successful when adapted to the setting in which the resource is delivered.
7
parents and guardians are ultimately responsible for their child’s health. Facts4Life offered training to all teachers involved in the delivery of the resource and teachers recognised that it is important to maintain best practice.
The limitations of this pilot evaluation need to be considered. Participating schools were self-selecting and teachers expressed enthusiasm about the Facts4Life resource. Intervention delivery may have been enhanced by this enthusiasm and thus may have influenced some of the outcomes reported. The pilot evaluation involved the collection of self-reported questionnaire data and subjective evaluative feedback, opening up the possibility for socially desirable responses among those closely linked with Facts4Life.
Recommendations
Future development of Facts4Life resource
Teaching materials should be reviewed and adapted in response to feedback to aid future delivery.
Training should be developed in response to feedback and provided for all staff involved with the delivery of Facts4Life to ensure that the aims and objectives of the resource are understood and addressed in the classroom environment.
Future development of Facts4Life should consider more holistic strategies for parental support, and increased dialogue between parents, teachers and children in the planning and delivery of health promoting policy and activity.
The resource should continue to encourage group working activities as a strategy for developing pupils’ sense of ownership over their learning.
Further evaluation of the Facts4Life resource
Future evaluation should aim to explore differences in health-related attitudes, knowledge and behaviour among pupils from different Year groups.
Future evaluation should aim to explore differences in health-related attitudes, knowledge and behaviour among pupils from different socio-economic backgrounds.
Future evaluation of Facts4Life should consider the use of adapted or alternative measurement tools.
8
List of Tables
Page number
Table 6.1 School size – comparison of evaluation schools with
England average 23
Table 6.2 Pupils eligible for free school meals (%) – comparison of
evaluation schools with England average 23 Table 6.3 Ofsted Inspection Ratings – comparison of evaluation
schools with England average 24 Table 6.4 Overall absences (%) – comparison of evaluation schools
with England average 24
Table 6.5 Comparison of intervention and control group pupil
characteristics at baseline 24 Table 6.6 Comparison of intervention and control group school
characteristics at baseline 25 Table 7.1 Facts4Life questionnaire descriptive statistics 27 Table 9.1 Facts4Life questionnaire descriptive statistics by Year
group 39
Table 11.1 CHIP-CE descriptive statistics by health domain 66 Table 12.1 CHIP-CE descriptive statistics by health domain and Year
group 73
9
List of Figures
Page number
Figure 6.1 Proportion (%) of pupils in the intervention and control
group by Year group at baseline 25 Figure 7.1 Pupil responses to: “When I feel unwell I need to take
medicine to feel better” 28 Figure 7.2 Pupil responses to: “There is nothing I can do to reduce
the risk of getting ill” 29 Figure 7.3 Pupil responses to: “When I am ill I always need to see a
doctor” 30
Figure 7.4 Pupil responses to: “Some people are never ill” 31
Figure 7.5 Pupil responses to: “I am confident I can do things to
keep myself as healthy and well as possible” 32 Figure 7.6 Pupils responses to: “Most of the time, most of us get
better from most illness without any help” 33 Figure 8.1 Mean responses to: “When I feel unwell I need to take
medicine to feel better” at baseline and follow-up 34 Figure 8.2 Mean responses to: “There is nothing I can do to reduce
the risk of getting ill” at baseline and follow-up 35 Figure 8.3 Mean responses to: “When I am ill, I always need to see a
doctor” at baseline and follow-up 35 Figure 8.4 Mean responses to: “Some people are never ill” at
baseline and follow-up 36
Figure 8.5 Mean responses to: “I am confident I can do things to keep myself as healthy and well as possible” at baseline and follow-up
36
Figure 8.6 Mean responses to: “Most of the time, most of us get better from illness without any help” at baseline and follow-up
37
Figure 9.1 Pupil responses to: “When I feel unwell I need to take
10
Figure 9.2 Pupil responses to: “There is nothing I can do to reduce
the risk of getting ill” by Year group 43 Figure 9.3 Pupil responses to: “When I am ill I always need to see a
doctor” by Year group 45
Figure 9.4 Pupil responses to: “Some people are never ill” by Year
group 47
Figure 9.5 Pupil responses to: “I am confident I can do things to keep myself as healthy and well as possible” by Year group
49
Figure 9.6 Pupils responses to: “Most of the time, most of us get
better from most illness without any help” by Year group 51 Figure 10.1 Mean responses to: “When I feel unwell I need to take
medicine to feel better” at baseline and follow-up by Year group
53
Figure 10.2 Mean responses to: “There is nothing I can do to reduce the risk of getting ill” at baseline and follow-up by Year group
55
Figure 10.3 Mean responses to: “When I am ill I always need to see a
doctor” at baseline and follow-up by Year group 57 Figure 10.4 Mean responses to: “Some people are never ill” at
baseline and follow-up by Year group 59 Figure 10.5 Mean responses to: “I am confident I can do things to
keep myself as healthy and well as possible” at baseline and follow-up by Year group
61
Figure 10.6 Mean responses to: “Most of the time, most of us get better from illness without any help” at baseline and follow-up by Year group
63
Figure 11.1 Mean ‘Achievement’ domain scores 67
Figure 11.2 Mean ‘Risk Avoidance’ domain scores 68
Figure 11.3 Mean ‘Resilience’ domain scores 69
Figure 11.4 Mean ‘Satisfaction’ domain scores 70
11
Figure 12.1 Mean ‘Achievement’ domain scores by Year group 75
Figure 12.2 Mean ‘Risk Avoidance’ domain scores by Year group 77
Figure 12.3 Mean ‘Resilience’ domain scores by Year group 79
Figure 12.4 Mean ‘Satisfaction’ domain scores by Year group 81
12
1.
Introduction
1.1Overview
Facts4Life is an initiative which aims to help everyone take ownership of their health by exploring illness and developing strategies to build wellbeing.
Led by the Facts4Life team (http://facts4life.org) together with Gloucestershire Healthy Living and Learning (http://www.ghll.org.uk), initial funding was obtained in 2012 for three years from Gloucestershire Clinical Commissioning Group (CCG) to develop, implement and evaluate a pilot school-based health education resource, Facts4Life, in primary schools across Gloucestershire.
In July 2013 the Facts4Life team commissioned the University of the West of England, Bristol to complete the evaluation of the pilot Facts4Life resource. The evaluation aims to explore the effects of Facts4Life on school children’s health-related attitudes, knowledge and behaviours. Furthermore, it aims to provide insight into how the pilot resource was received and the factors that could facilitate the dissemination and implementation of the pilot resource more widely.
The key findings from the evaluation are presented in this summary report. The full technical report provides a detailed account of the evaluation methodology, methods, findings, interpretation and recommendations for future development of the pilot resource.
1.2Structure of this report
13
2.
Context
In recent years there has been increasing attention paid to the health and wellbeing of children in the UK, with obesity and overweight, physical inactivity, and mental health three areas of particular concern. The latest figures suggest that approximately one third of children in Year 6 (aged 10-11 years) are overweight or obese 1; less than one
third of children meet the Chief Medical Officer’s guidelines for physical activity 2; and,
10% of 5-16 year olds are estimated to have a diagnosable mental health disorder 3.
Despite important improvements in some areas of public health there is still work to do to promote health, reduce preventable poor health outcomes and develop resilience among children in the UK.
There is evidence to suggest that people’s lay beliefs of health and illness are strongly associated with health and illness behaviours, health awareness and perceptions of risk
4, 5. Research has shown that understanding of health and illness varies according to age 6,with children’s level of understanding often associated with on cognitive ability 7 and
past experience 8. Understanding children’s perceptions of health and illness may be
particularly important as the attitudes, beliefs and behaviours they establish during childhood can continue on into adulthood 9, 10; an important consideration when
seeking to design appropriate health promoting and illness preventing interventions for children.
“What happens during these early years (starting in the womb) has lifelong effects on many aspects of health and well-being – from obesity, heart disease and mental health, to educational achievement and economic status.”
Fair Society, Healthy Lives (The Marmot Review) 11
The school environment provides a unique opportunity to promote health and wellbeing. In recognition of the fact that children spend much of their time at school, schools are now being encouraged to actively promote health 12. Notably, there is
evidence to suggest that good health is strongly associated with academic achievement
13, 14, thus adding to the support for the creation of healthy school environments 15.
Traditional approaches to school-based health promotion have focused on information provision and targeting specific skill development, such as the use of refusal techniques
16 some of which have been shown to have a positive impact on health-related
outcomes. However, the use of traditional approaches has been criticised for following a didactic approach (i.e., through teacher-to-pupil information provision, rather than enabling children to participate and take ownership of their learning) and victim-blaming 17, and for failing to provide consistent or long-term evidence of their
effectiveness 18,19.
14
there has been an emphasis on supporting people to build resilience 3 and manage their
15
3.
The Facts4Life Primary School Resource
3.1Introduction
Facts4Life is an initiative which aims to help everyone take ownership of their health by exploring illness and developing strategies to build wellbeing.
The Facts4Life primary school resource was designed for use with children aged 7-11 years. Facts4Life resource materials are delivered by a classroom teacher and follow a pupil-centred approach to learning, in which pupils themselves are responsible for researching health and wellbeing-related topics of particular interest and/or importance to them. Facts4Life teaching materials are designed to be cross-curricular and directly linked to the National Curriculum.
The resource aims are closely aligned with recent policy drivers 3, 12, 20 in attempting to
address health and wellbeing at an early age before ideas about how health is delivered and who is responsible become fixed in young minds.
3.2Rationale
At the heart of the Facts4Life initiative is the understanding that promoting health and wellbeing is a key challenge for the 21st Century, and that taking more responsibility for our own health could significantly improve the wellbeing of individuals and save money.
“Instead of simply telling people to make healthier choices – eat vegetables, exercise more, smoke less – we need to help people to understand why doing certain things tends to lead to better health.”
Hugh van’t Hoff, Director Facts4Life
Using an innovative approach to school-based health education, the Facts4Life resource introduces primary school children to the principles of health and illness early on in their lives so that they can incorporate them into their view of themselves and the world around them as they develop and grow.
The resource is specifically designed to help children develop a deeper understanding of health and personal responsibility for health. Sessions within the resource are designed to be accessible and engaging, and easy to incorporate into many areas of the primary school curriculum. The Facts4Life resource also aims to provide children with an opportunity to discuss health and illness issues in a way that they may not have been able to in the past.
16
3.3Content
The resource is centred on three messages:
1) Riding the ups and downs – “As we journey through life, our state of health is
constantly changing because of the challenges we meet and how we respond to them. Rather than being either ‘ill’ or ‘well’, we move along an undulating path with high points (when we are well) and low points (when we are less well). Everyone’s journey will be different, but it is in our power to minimise the ‘downs’ and maximise the ‘ups’”.
2) Keeping balanced – “Throughout life, our bodies are constantly meeting
challenges which knock us off-balance. A variety of processes in our bodies respond to these challenges. For example, a pulled muscle leads to inflammation which helps it to heal. A viral infection may lead to fever which helps to kill the virus. In this way, we ‘loop back’ into a balanced state again. By and large we are very successful at responding to challenges – most of the time, most of us get better from most illnesses without help”.
3) Smoothing the path – “How our bodies respond to challenges will depend on
many factors, such as how well our heart functions, our stress levels or how fat or thin we are, as well as our genetic make-up. We can help our bodies to ‘loop back’ by equipping ourselves with certain things – a bit like putting ball bearings in a wheel so it can roll along smoothly. For example, we can exercise so that our heart is strong and keep our stress levels down through getting enough rest and relaxation.”
Facts4Life ‘Key Messages’ (2015) - http://facts4life.org/key-messages/
17
4.
Aims, Objectives and Research Questions
This pilot evaluation aims to explore the effects of the Facts4Life resource on school children’s health-related attitudes, knowledge and behaviour. Furthermore, this pilot evaluation aims to provide insight into how the Facts4Life resource was received and the factors that could facilitate the dissemination and implementation of the resource more widely.
The specific objectives of the pilot evaluation were to:
To assess changes in pupils health-related attitudes, knowledge and behaviour in response to the Facts4Life resource;
To explore pupils’ experiences of the Facts4Life resource; To explore teachers’ experiences of the Facts4Life resource; This pilot evaluation addresses the following research questions:
1) To what extent are schools adopting the Facts4Life resource associated with a change in health-related attitudes, knowledge and behaviour amongst pupils? 2) To what extent are schools adopting the Facts4Life resource associated with a
change in health-related knowledge, understanding and behaviour amongst pupils, compared with schools that have not adopted the Facts4Life resource? 3) What are the experiences of pupils and teachers in schools adopting the
18
5.
Pilot Evaluation Methodology and Methods
5.1Introduction
This pilot evaluation adopted a mixed methods approach to research, involving the collection and analysis of quantitative and qualitative data to provide “a better understanding of research problems than either approach alone” 21.
5.2Research design
The pilot evaluation consisted of:
A controlled before-and-after study. A qualitative process evaluation.
Controlled before-and after study
Pupils (n = 324) from ten schools were assessed before the Facts4Life resource was implemented (baseline) and again approximately one week after the intervention period had ended (follow-up). Findings from five schools adopting the Facts4Life resource (intervention group) were compared with findings from five schools not adopting the Facts4Life resource (control group) to determine whether the resource was associated with any changes in health-related attitudes, knowledge and behaviour.
Qualitative process evaluation
The qualitative process evaluation involved analysis of programme implementation, delivery, engagement and areas for improvement. Pupils (n = 23) and teachers (n = 6) from school adopting the Facts4Life resource were asked to provide feedback via focus group discussions and open-ended questionnaires.
5.3Sampling
Pupils from Years 3 to 6 (7 to 11 years of age) were recruited from primary schools within the Gloucestershire Local Education Authority. Ten schools were invited to participate in the pilot evaluation.
19
team played no role in school recruitment or school allocation to the intervention or control groups.
324 pupils completed baseline questionnaires, with 295 (91%) completing questionnaires again at follow-up. If pupils did not complete all items from each questionnaire, these data were treated as missing during analyses. The mean age of pupils participating in the pilot evaluation was 8.99 (SD = 1.12).
Focus groups were conducted with 23 pupils from the intervention group. All school staff involved with Facts4Life training and/or delivery were invited to complete an online ended questionnaire. Six teachers representing four schools returned open-ended questionnaires (75% response rate).
5.4Measures
The measures listed below were collected at two time points, immediately before the intervention began (January 2015) and again approximately one week after the intervention period had ended (April 2015). Each measure was assessed for internal consistency (i.e., the agreement between individual items that make up a measure) at each time point.
5.4.1 Facts4Life questionnaire
A questionnaire was constructed by the Facts4Life and GHLL teams to measure health and illness-related attitudes addressed explicitly by the intervention. The measure consisted of six questions: “When I feel unwell I need to take medicine to feel better”; “There is nothing I can do to reduce the risk of getting ill”; “When I am ill I always need to see a doctor”; “Some people are never ill”; “I am confident I can do things to keep myself as healthy and well as possible”; and, “Most of the time, most of us get better from illness without any help”. Pupils were asked to respond to each of these items according to a 5-point Likert scale, ranging from 1 = strongly disagree to 5 = strongly agree.
5.4.2 Child Health and Illness Profile (Child Edition) (CHIP-CE) questionnaire
20
with primary school aged children and demonstrates adequate-to-excellent levels of reliability and validity 22, 23.
5.4.3 Pre-testing of pilot evaluation measures
To ensure that proposed assessment measures were appropriate for children 7 to 11 years of age, 92 pupils from two primary schools in the Gloucestershire area (that were not involved with this evaluation) were asked to complete a sample of items taken from the Facts4Life and CHIP-CE questionnaires. Items were read aloud by the class teacher. In addition to completing the sample items, pupils were asked to raise any concerns or to alert the researcher to any difficulties encountered (e.g., confusion over how to complete a questionnaire item). No objections were raised and all pupils completed the task.
5.5Qualitative process evaluation
After the intervention period was over focus groups were conducted with pupils from each intervention school. Qualitative data were collected, in addition to quantitative questionnaire data, to explore health and illness-related attitudes and behaviour. Furthermore, qualitative data were used to provide insight into how the resource was received and factors that could facilitate the dissemination and implementation of the resource more widely. An indicative focus group question guide was developed and included factors relating to participation, experiences of the intervention, lesson style, wider implications of the resource, and areas for improvement.
Teachers from schools that had been involved in intervention training and/or delivery completed open-ended questionnaires. Questionnaires requested feedback on training and resources, intervention delivery, parental/guardian involvement, and areas for development.
5.6Procedure
Approximately one week prior to the implementation of the Facts4Life resource all pupils were asked to complete the Facts4Life and CHIP-CE questionnaires in a classroom setting. Pupils were provided with instructions on how to complete the questionnaire by the research team and each item was read aloud by the class teacher to provide support where necessary. The intervention was implemented during the Spring term (January – April 2015). A detailed Facts4Life resource booklet, containing ‘theme’ lesson plans was provided to all teachers.
21
Pupils in schools allocated to the control group completed questionnaire measures at baseline and follow-up only. They had no other contact with the research team.
Qualitative process evaluation focus groups took place in intervention schools on the same day that follow-up questionnaires were administered. Open-ended questionnaires were administered to teachers at the end of the intervention period and teachers were given one month to respond.
5.7Data analysis
Quantitative and qualitative approaches were combined for this pilot evaluation to provide a broad and in-depth understanding of the Facts4Life resource as a school-based intervention 24.
Quantitative data collected from schools at baseline and at follow-up were entered into IBM SPSS Statistics v 20 – a software programme for statistical analysis. SPSS was used to produce descriptive statistics (including means and standard deviations) to compare intervention and control groups.
Independent-samples t-tests and Chi-squared tests of association were used to compare baseline organisational and demographic characteristics (gender, age, school size, Ofsted rating, Free School Meal status, and overall absence) in intervention and control group schools.
Finally, mixed analysis of variance (MANOVA) models were used to identify any changes in outcome measures in the intervention and control groups from baseline to follow-up. Essentially, this means that changes in intervention group scores from baseline to follow-up were assessed, while controlling for changes in the control group.
Further details of the findings from the statistical analyses employed in this pilot evaluation are presented in Chapters 7-12.
Qualitative focus group data were transcribed verbatim (word-for-word) and analysed using NVivo 10 (QSR International) – a software programme for qualitative data analysis. Teacher responses to the open-ended questionnaire items were also transcribed verbatim and analysed in NVivo. All data were explored using Thematic Analysis (TA); a useful method for “identifying, analysing and reporting patterns within data” 25. Further details of the qualitative analyses employed in this evaluation are
presented in Chapter 13.
5.8Ethical issues
22
Committee in November 2014. The evaluation team also completed a Risk Assessment form before visiting pilot evaluation schools.
Head teachers from each school were asked to provide written permission for their school to participate in the research project. Head teachers and teachers were invited to attend a meeting before the evaluation began and were provided with written and verbal information about the aims of the evaluation and what school participation in the study would involve.
Each school was responsible for providing pupils and their parents or guardians with information about the evaluation. Parents or guardians were asked to provide passive informed consent for their child to participate. Information sheets, containing an explanation of the nature of the research project and a method to retract permission, were sent to parents or guardians. If parents or guardians did not want their child to participate, they were able to ‘opt out’ by contacting the school. If a parent did not respond to the letter it was assumed that they permitted their child to take part.
Pupils were asked to provide active informed consent to participate in the pilot evaluation. Each pupil was provided with an information sheet explaining the purpose of the study and the procedure for withdrawal.
23
6.
School characteristics
6.1Introduction
This section of the report describes the schools that participated in the Facts4Life resource pilot evaluation.
6.2Organisational and demographic characteristics
This pilot evaluation involved ten primary schools located in the Gloucestershire Local Education Authority (LEA). Four schools were community schools, two were voluntary-aided schools, two were voluntary-controlled schools, one school was a foundation school, and one was an academy.
As shown in Table 6.1 the average school size of schools involved with this pilot evaluation was slightly smaller than the England average. There was considerable variation in the number of pupils enrolled at pilot evaluation schools, ranging from 63 to 425. The gender splits were comparable for pilot evaluation schools and England average (47.5% vs 49.0% respectively).
Table 6.1 School size – comparison of evaluation schools with England average (Source: Ofsted School Data Dashboard, 2014)
Evaluation schools England schools Average number of
pupils per school 214 263
‘Free school meals’ eligibility is one measure that is commonly used as a proxy for deprivation. The percentage of pupils eligible for free school meals (FSM) was almost 10% lower in evaluation schools compared with the England average (Table 6.2).
Table 6.2 Pupils eligible for free school meals (%) – comparison of evaluation schools with England average (Source: Ofsted School Data Dashboard, 2014)
24
As shown in Table 6.3, according to Ofsted the overall effectiveness of pilot evaluation schools was broadly similar to the England average.
Table 6.3 Ofsted Inspection Ratings – comparison of evaluation schools with England average (Source: Ofsted School Data Dashboard, 2014)
Evaluation schools England schools % Rated Good or Outstanding 70 71
% Rated Requires Improvement or
Inadequate 30 29
Overall absence was slightly lower in pilot evaluation schools compared with the England average (Table 6.4).
Table 6.4 Overall absences (%) – comparison of evaluation schools with England average (Source: Ofsted School Data Dashboard, 2014)
Evaluation schools England schools
% Overall absence 3.5% 3.8%
6.3Comparison of intervention and control groups
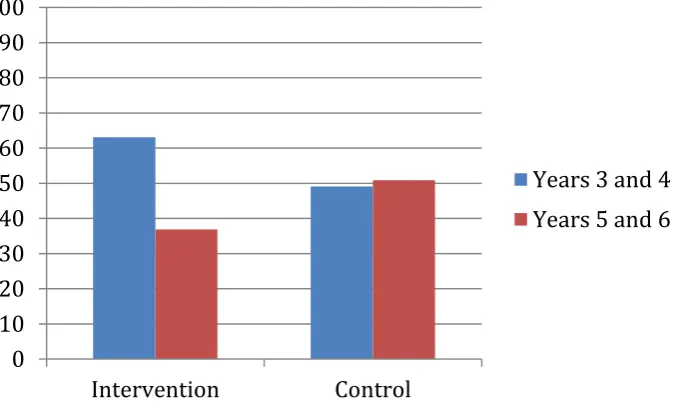
As shown in Table 6.5 the proportion of boys and girls recruited to the intervention and control group was similar. However, when exploring pupil characteristics by year group, there were significantly more children recruited from Years 3 and 4 compared with Years 5 and 6. 187 pupils participated from Years 3 and 4, with 108 pupils from Years 5 and 6.
Table 6.5 Comparison of intervention and control group pupil characteristics at
baseline (n=295)
Intervention Control
n (%) n (%) p
Gender
Boy 101 (54.0) 61 (56.5)
Girl 86 (46.0) 47 (43.5) 0.68† Year group
Years 3 and 4 118 (63.1) 53 (49.1)
Years 5 and 6 69 (36.9) 55 (50.9) 0.02†*
Note. †Chi-squared test of association. *Difference between groups is statistically
25
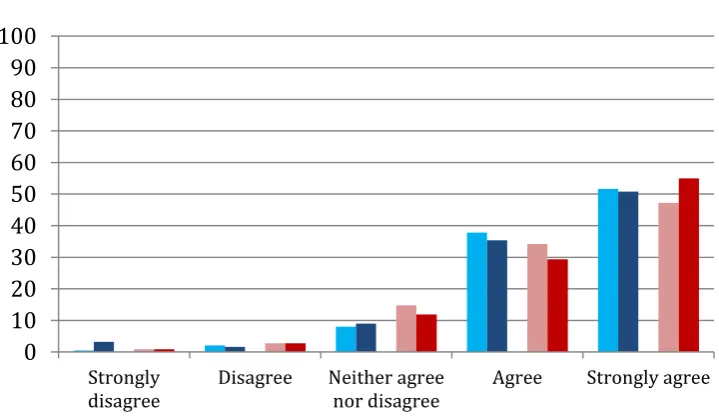
[image:26.595.86.426.165.368.2]Figure 6.1 presents a visual representation of the proportion of participations in Years 3 and 4 and Years 5 and 6, and according to intervention and control group.
Figure 6.1 Proportion (%) of pupils in the intervention and control group by Year
group at baseline (n=295)
A comparison of intervention and control group school characteristics revealed that there were no statistically significant differences in school size, or overall absence (%). However, the Ofsted rating was significantly higher among intervention schools when compared with control group schools. Furthermore, the percentage of children eligible for free schools meals in the intervention group was significantly higher than in the control group (Table 6.6).
Table 6.6Comparison of intervention and control group school characteristics at
baseline
Intervention Control
Mean (SD) Mean(SD) P
School size 213.51 (134.68) 204.48 (123.46) 0.55†† Ofsted ratinga 2.00 (0.00) 2.40 (0.82) 0.01†*
Free school meal eligibility (%) 11.71% (5.84) 7.87% (3.80) 0.01††* Overall absence 3.49 (0.26) 2.49 (0.22) 0.95††
Note. aOfsted ratings range from 1 = Outstanding to 4 = Inadequate. †Chi-squared test of
association. †† Independent-samples t-test. *Difference between groups is statistically significant (p=<0.05).
0 10 20 30 40 50 60 70 80 90 100
Intervention Control
26
7.
Facts4Life questionnaire – Descriptive statistics
7.1 Introduction
This section of the report presents a descriptive summary (means and standard deviations) of pupil responses (n = 295) to the Facts4Life questionnaire at baseline and again at follow-up.
7.2Methods
Facts4Life questionnaires were administered to pupils in the intervention and control groups approximately one week before the intervention period began (baseline) and again approximately one week after the intervention period had ended (follow-up). Questionnaires were completed in each school during January and April 2015.
The Facts4Life questionnaire contained six items designed to assess health-related attitudes, beliefs and behaviour addressed explicitly by the intervention. Each item was measured according to a 5-point Likert scale, ranging from 1 = strongly disagree to 5 = strongly agree.
The questionnaire was assessed for internal consistency (i.e., the agreement between individual items that make up a questionnaire) at each time point. An acceptable level of internal consistency is α=0.70 or above 27. Internal consistency of the Facts4Life
27
7.3 Descriptive summary of pupil responses
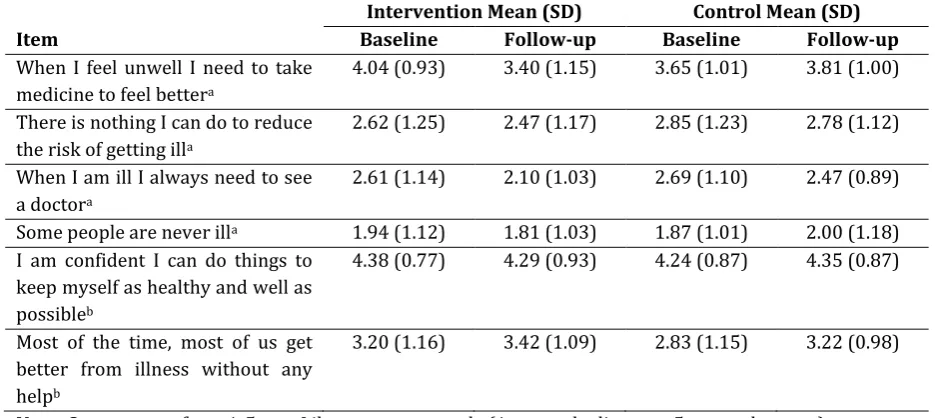
As shown in Table 7.1 there was a positive change in mean intervention group scores for five of the six items included in the questionnaire from baseline to follow-up. Item 5, “I am confident I can do things to keep myself as healthy and well as possible”, was the only item to experience a negative change among intervention group pupils.
[image:28.595.64.532.291.500.2]Mean scores for pupils in the control group were broadly similar at baseline and follow-up; however in contrast to the intervention group, control group pupils reported a positive change in response to Item 5. Pupils in the control group reported a negative change in responses to Item 1, “When I feel unwell I need to take medicine to feel better”, and Item 4, “Some people are never ill”.
Table 7.1 Facts4Life questionnaire descriptive statistics (n=295)
Intervention Mean (SD) Control Mean (SD)
Item Baseline Follow-up Baseline Follow-up
When I feel unwell I need to take medicine to feel bettera
4.04 (0.93) 3.40 (1.15) 3.65 (1.01) 3.81 (1.00)
There is nothing I can do to reduce the risk of getting illa
2.62 (1.25) 2.47 (1.17) 2.85 (1.23) 2.78 (1.12)
When I am ill I always need to see a doctora
2.61 (1.14) 2.10 (1.03) 2.69 (1.10) 2.47 (0.89)
Some people are never illa 1.94 (1.12) 1.81 (1.03) 1.87 (1.01) 2.00 (1.18)
I am confident I can do things to keep myself as healthy and well as possibleb
4.38 (0.77) 4.29 (0.93) 4.24 (0.87) 4.35 (0.87)
Most of the time, most of us get better from illness without any helpb
3.20 (1.16) 3.42 (1.09) 2.83 (1.15) 3.22 (0.98)
Note. Scores range from 1-5 on a Likert-response scale (1=strongly disagree, 5=strongly agree).
aLower scores are more desirable.
28
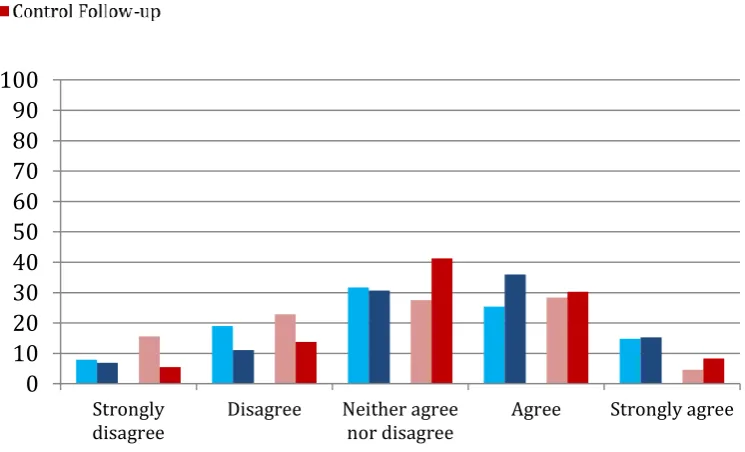
When I feel unwell I need to take medicine to feel better
[image:29.595.78.437.348.569.2]Findings presented in Figure 7.1 demonstrate a positive increase in the percentage of intervention group pupils reporting that they ‘strongly disagree’ or ‘disagree’ with the statement“When I feel unwell I need to take medicine to feel better”. At baseline, only 9 pupils in the intervention group (4.9%) reported ‘strongly disagree’ or ‘disagree’, while at follow-up this number increased to 42 (22.3%). Comparatively, at follow-up, only 11 pupils in the control group (10.1%) selected ‘strongly disagree’ or ‘disagree’ when responding to this item.
Figure 7.1 Pupil responses to: “When I feel unwell I need to take medicine to feel better” (%)
Note. Responses of ‘strongly disagree’ and ‘disagree’ are more desirable. 0
10 20 30 40 50 60 70 80 90 100
Strongly
29
There is nothing I can do to reduce the risk of getting ill
Figure 7.2 shows a small positive increase in the percentage of intervention group pupils reporting strong disagreement with the statement “There is nothing I can do to reduce the risk of getting ill”. 40 pupils (21.3%) reported ‘strongly disagree’ at baseline and 45 pupils (23.8) at follow-up. In contrast, only 14 pupils in the control group (13.0%) reported ‘strongly disagree’ at follow-up.
Figure 7.2 Pupil responses to: “There is nothing I can do to reduce the risk of getting ill” (%)
Note. Responses of ‘strongly disagree’ and ‘disagree’ are more desirable. 0
10 20 30 40 50 60 70 80 90 100
Strongly
[image:30.595.79.440.302.554.2]30
When I am ill I always need to see a doctor
There was a marked positive increase in the percentage of pupils in the intervention group that reported strong disagreement with the statement “When I am ill I always need to see a doctor”, with 25 pupils (13.4%) reporting ‘strongly disagree’ at baseline and 62 pupils (32.8%) at follow-up. In stark contrast, only 11 pupils (10.1%) in the control group reported strong disagreement with the statement (Figure 7.3).
Figure 7.3Pupil responses to: “When I am ill I always need to see a doctor” (%)
Note. Responses of ‘strongly disagree’ and ‘disagree’ are more desirable. 0
10 20 30 40 50 60 70 80 90 100
Strongly
31
Some people are never ill
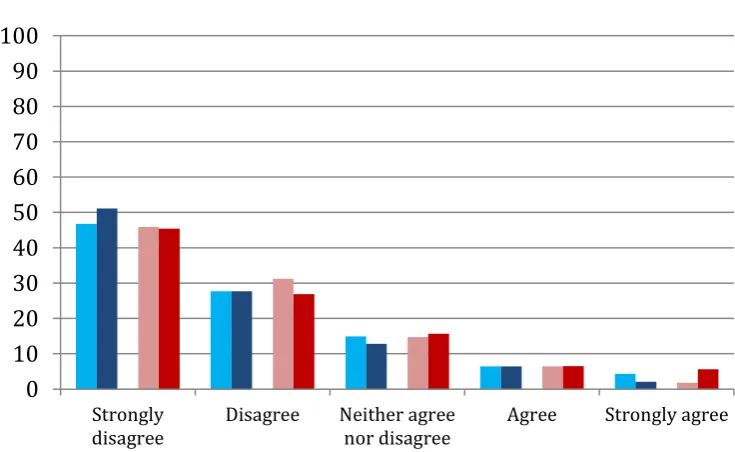
[image:32.595.79.447.292.518.2]As shown in Figure 7.4 there were minimal changes in intervention and control group responses to the item “Some people are never ill”. Roughly 45% of pupils in the intervention and control groups reported strong disagreement with the statement at baseline, a percentage that rose to more than 50% among intervention pupils (50.8%) and fell slightly among control group pupils (45.0%) at follow-up.
Figure 7.4 Pupil responses to: “Some people are never ill” (%)
Note. Responses of ‘strongly disagree’ and ‘disagree’ are more desirable. 0
10 20 30 40 50 60 70 80 90 100
Strongly
32
I am confident I can do things to keep myself as healthy and well as possible
Figure 7.5 demonstrates that there was a small reduction in health-related confidence levels among intervention group pupils over time. 168 pupils (88.9%) in the intervention group reported ‘strongly agree’ or ‘agree’ at baseline compared with 163 (86.2%) at follow-up. In contrast, confidence levels in control group pupils were seen to increase over time (from 80.7% at baseline to 94.4% at follow-up).
Figure 7.5 Pupil responses to: “I am confident I can do things to keep myself as healthy and well as possible” (%)
Note. Responses of ‘strongly agree’ and ‘agree’ are more desirable. 0
10 20 30 40 50 60 70 80 90 100
Strongly
[image:33.595.80.440.302.512.2]33
Most of the time, most of us get better from most illnesses without any help
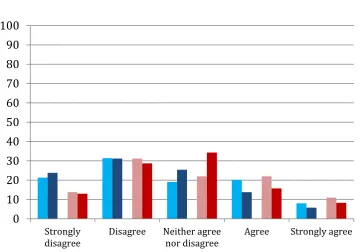
[image:34.595.79.452.301.527.2]Figure 7.6 demonstrates a positive shift in intervention and control group responses to the item “Most of the time, most of us get better from most illness without any help”. For the intervention group, 76 pupils (60.2%) reportedly ‘agreed’ or ‘strongly agreed’ with the statement at baseline, a number which increased to 87 (51.3%) at follow-up. Control group responses of ‘strongly agree’ and ‘agree’ were also seen to improve from baseline to follow-up (36 (33%) to 42 (38.6%) respectively.
Figure 7.6 Pupils responses to: “Most of the time, most of us get better from most illness without any help” (%)
Note. Responses of ‘strongly agree’ and ‘agree’ are more desirable.
7.4 Chapter summary
The descriptive findings presented in this chapter suggest that, in general, pupils’ health-related attitudes, beliefs and behaviour addressed explicitly by the intervention were improved after taking part in the intervention.
However, it is important to note that the findings presented in this chapter are purely descriptive and do not statistically control for responses from the control group. An assessment of statistical changes in health-related attitudes, beliefs and behaviour addressed explicitly by the intervention, controlling for control group responses, can be found in the next chapter.
0 10 20 30 40 50 60 70 80 90 100
Strongly
34
8.
Facts4Life questionnaire – Statistical comparisons
8.1Introduction
This section of the report presents the findings from a statistical comparison of intervention and control group responses to the Facts4Life questionnaire.
8.2 Methods
Mixed analysis of variance (MANOVA) models were used to identify any changes in outcome measures among intervention and control groups from baseline to follow-up. Essentially, this means that any changes in the intervention group from baseline to follow-up were assessed, while controlling for changes in control group responses.
8.3 Statistical Comparisons - Results
As shown in Figure 8.1, there was a statistically significant improvement in intervention group responses to the item “When I feel unwell I need to take medicine to feel better”, when controlling for control group responses, F (1, 292) = 31.59, p = 0.01.
Figure 8.1 Mean responses to: “When I feel unwell I need to take medicine to feel better” at baseline and follow-up*
Note. Scores range from 1 = strongly disagree – 5 = strongly agree. A decrease in mean
score is desirable. * Mean score based on estimated marginal mean derived from MANOVA test.
1 2 3 4 5
Baseline Follow-up
35
Figure 8.2 shows no statistically significant improvement in intervention group responses to the item “There is nothing I can do to reduce the risk of getting ill”, when controlling for control group responses, F (1, 293) = 0.16, p = 0.69.
Figure 8.2 Mean responses to: “There is nothing I can do to reduce the risk of getting ill” at baseline and follow-up*
Note. Scores range from 1 = strongly disagree – 5 = strongly agree. A decrease in mean
score is desirable. * Mean score based on estimated marginal mean derived from MANOVA test.
Figure 8.3 shows that there was a positive reduction in mean intervention group scores over time relating to the item “When I am ill, I always need to see a doctor”, and this was statistically significant when controlling for control group responses, F (1, 292) = 3.77, p = 0.05.
Figure 8.3 Mean responses to: “When I am ill, I always need to see a doctor” at baseline and follow-up*
Note. Scores range from 1 = strongly disagree – 5 = strongly agree. A decrease in mean
score is desirable. * Mean score based on estimated marginal mean derived from MANOVA test.
1 2 3 4 5
Baseline Follow-up
Intervention Control
1 2 3 4 5
Baseline Follow-up
36
Figure 8.4 shows that there was no statistically significant improvement in intervention group responses to the item “Some people are never ill”, when controlling for control group responses, F (1, 292) = 2.61, p = 0.11.
Figure 8.4 Mean responses to: “Some people are never ill” at baseline and follow-up*
Note. Scores range from 1 = strongly disagree – 5 = strongly agree. A decrease in mean
score is desirable. * Mean score based on estimated marginal mean derived from MANOVA test.
As shown in Figure 8.5 there was a small negative reduction in mean intervention group scores over time relating to the item “I am confident I can do things to keep myself as healthy and well as possible”. However, when controlling for control group responses, this reduction was not statistically significant, F (1, 293) = 3.25, p = 0.07.
Figure 8.5 Mean responses to: “I am confident I can do things to keep myself as healthy and well as possible” at baseline and follow-up*
Note. Scores range from 1 = strongly disagree – 5 = strongly agree. An increase in mean
score is desirable. * Mean score based on estimated marginal mean derived from MANOVA test.
1 2 3 4 5
Baseline Follow-up
Intervention Control
1 2 3 4 5
Baseline Follow-up
37
Figure 8.6 shows a positive increase in intervention group mean scores relating to the item “Most of the time, most of us get better from illness without any help”. However, this increase was not found to be statistically significant when controlling for control group scores, F (1, 292) = 1.48, p = 0.23.
Figure 8.6 Mean responses to: “Most of the time, most of us get better from illness without any help” at baseline and follow-up*
Note. Scores range from 1 = strongly disagree – 5 = strongly agree. An increase in mean
score is desirable. * Mean score based on estimated marginal mean derived from MANOVA test.
8.4 Chapter summary
The statistical results presented in this chapter demonstrate statistically significant improvements in intervention group health-related attitudes, knowledge and behaviour in relation to items:
When I feel unwell I need to take medicine to feel better When I am ill, I always need to see a doctor
Notably, changes in intervention group mean responses from baseline to follow-up were positive for all items, except “I am confident I can do things to keep myself as healthy and well as possible”.
1 2 3 4 5
Baseline Follow-up
38
9.
Facts4Life questionnaire – Descriptive statistics
by Year group
9.1 Introduction
This section presents average (mean and standard deviation) Facts4Life questionnaire scores at baseline and follow-up, according to Year group.
9.2 Methods
As shown in section 6.3, there was a statistical difference in the number of pupils in Years 3 and 4 and Years 5 and 6 allocated to the intervention or control group. To explore these differences in more detail, statistical analysis was conducted to identify any changes in outcome measures in the intervention and control groups from baseline to follow-up, by separating the sample into two: Years 3 and 4; and, Years 5 and 6.
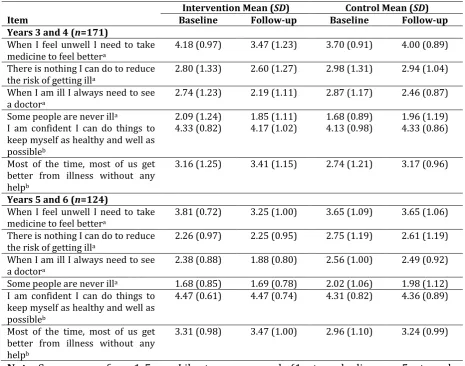
9.3 Descriptive summary of pupil responses by Year group
As shown in Table 9.1 there was a positive change in mean intervention group scores for five of the six items included in the questionnaire among pupils in Years 3 and 4. Item 5, “I am confident I can do things to keep myself as healthy and well as possible”, was the only item to experience a negative reduction in mean score among pupils in the intervention group.
Mean scores for Year 3 and 4 pupils in the control group were broadly similar; however in contrast to the intervention group, control group pupils reported a positive mean change in response to Item 5. Pupils in the control group reported a negative reduction in mean change scores in response to Item 1, “When I feel unwell I need to take medicine to feel better”, and Item 4, “Some people are never ill”.
As shown in Table 9.1 there was a positive change in mean intervention group scores for four of the six items included in the questionnaire from baseline to follow-up among pupils in Years 5 and 6. There was a negative change in intervention group responses to Item 4, “Some people are never ill”. Mean responses to Item 5, “I am confident I can do things to keep myself as healthy and well as possible”, did not change over time.
39
Table 9.1 Facts4Life questionnaire descriptive statistics by Year group (n=295)
Intervention Mean (SD) Control Mean (SD)
Item Baseline Follow-up Baseline Follow-up
Years 3 and 4 (n=171)
When I feel unwell I need to take medicine to feel bettera
4.18 (0.97) 3.47 (1.23) 3.70 (0.91) 4.00 (0.89)
There is nothing I can do to reduce the risk of getting illa
2.80 (1.33) 2.60 (1.27) 2.98 (1.31) 2.94 (1.04)
When I am ill I always need to see a doctora
2.74 (1.23) 2.19 (1.11) 2.87 (1.17) 2.46 (0.87)
Some people are never illa 2.09 (1.24) 1.85 (1.11) 1.68 (0.89) 1.96 (1.19)
I am confident I can do things to keep myself as healthy and well as possibleb
4.33 (0.82) 4.17 (1.02) 4.13 (0.98) 4.33 (0.86)
Most of the time, most of us get better from illness without any helpb
3.16 (1.25) 3.41 (1.15) 2.74 (1.21) 3.17 (0.96)
Years 5 and 6 (n=124)
When I feel unwell I need to take medicine to feel bettera
3.81 (0.72) 3.25 (1.00) 3.65 (1.09) 3.65 (1.06)
There is nothing I can do to reduce the risk of getting illa
2.26 (0.97) 2.25 (0.95) 2.75 (1.19) 2.61 (1.19)
When I am ill I always need to see
a doctora 2.38 (0.88) 1.88 (0.80) 2.56 (1.00) 2.49 (0.92)
Some people are never illa 1.68 (0.85) 1.69 (0.78) 2.02 (1.06) 1.98 (1.12)
I am confident I can do things to keep myself as healthy and well as possibleb
4.47 (0.61) 4.47 (0.74) 4.31 (0.82) 4.36 (0.89)
Most of the time, most of us get better from illness without any helpb
3.31 (0.98) 3.47 (1.00) 2.96 (1.10) 3.24 (0.99)
Note. Scores range from 1-5 on a Likert-response scale (1=strongly disagree, 5=strongly
agree).
40
When I feel unwell I need to take medicine to feel better Years 3 and 4
Figure 9.1 shows an increase in the proportion of intervention group pupils responding desirably to item 1 of the Facts4Life questionnaire. At baseline, 6 (5%) intervention group pupils ‘strongly disagreed’ or ‘disagreed’ with the statement “When I feel unwell I need to take medicine to feel better”. At follow-up this number increased to 25 (21.4%). In stark contrast only 3 (5.7%) control group pupils responded in this way at follow-up.
Years 5 and 6
41
Figure 9.1 Pupil responses to: “When I feel unwell I need to take medicine to feel better” by Year group (%)
Years 3 and 4 (n=171) Years 5 and 6 (n=124)
Note. Responses of ‘strongly disagree’ and ‘disagree’ are more desirable.
0 10 20 30 40 50 60 70 80 90 100
Strongly
disagree Disagree Neither agreenor disagree Agree Strongly agree
0 10 20 30 40 50 60 70 80 90 100
Strongly
42
There is nothing I can do to reduce the risk of getting ill Years 3 and 4
Figure 9.2 suggests that there was minimal change in Year 3 and 4 intervention group responses to item 2 at baseline and follow-up. Among control group pupils, there was a strong increase in the number of pupils selecting ‘neither agree nor disagree’ in response to the statement “There is nothing I can do to reduce the risk of getting ill” (baseline n = 12 (22.6%); follow-up n = 24 (45.3%).
Years 5 and 6
43
Figure 9.2 Pupil responses to: “There is nothing I can do to reduce the risk of getting ill” by Year group (%)
Years 3 and 4 (n=171) Years 5 and 6 (n=124)
Note. Responses of ‘strongly disagree’ and ‘disagree’ are more desirable.
0 10 20 30 40 50 60 70 80 90 100
Strongly
disagree Disagree Neither agreenor disagree Agree Stronglyagree
0 10 20 30 40 50 60 70 80 90 100
Strongly
44
When I am ill I always need to see a doctor Years 3 and 4
Figure 9.3 demonstrates that a higher proportion of Year 3 and 4 pupils in the intervention group reported strong disagreement or disagreement with item 3 at follow-up (n = 70; 59.3%) compared with baseline (n = 56; 47.5%). However, it should be noted that the proportion of desirable responses also increased among the control group from baseline to follow-up (n = 21 (39.6%) to 28 (52.8%) respectively).
Years 5 and 6
45
Figure 9.3Pupil responses to: “When I am ill I always need to see a doctor” by Year group (%)
Years 3 and 4 (n=171) Years 5 and 6 (n=124)
Note. Responses of ‘strongly disagree’ and ‘disagree’ are more desirable.
0 10 20 30 40 50 60 70 80 90 100
Strongly
disagree Disagree Neither agreenor disagree Agree Stronglyagree
0 10 20 30 40 50 60 70 80 90 100
Strongly
46
Some people are never ill Years 3 and 4
Figure 9.4 reveals that at baseline almost half of the pupils in Years 3 and 4 were aware that almost everyone will be unwell at some point in their lives. Responses of ‘strongly disagree’ with the statement “Some people are never ill” were selected by 43.2% intervention group pupils and 54.7% control group pupils at baseline. At follow-up responses were broadly similar (52.5% vs 49.1% respectively).
Years 5 and 6
47
Figure 9.4 Pupil responses to: “Some people are never ill” by Year group (%)
Years 3 and 4 (n=171) Years 5 and 6 (n=124)
Note. Responses of ‘strongly disagree’ and ‘disagree’ are more desirable.
0 10 20 30 40 50 60 70 80 90 100
Strongly
disagree Disagree Neither agreenor disagree Agree Strongly agree
0 10 20 30 40 50 60 70 80 90 100
Strongly
48
I am confident I can do things to keep myself as healthy and well as possible Years 3 and 4
As shown in Figure 9.5 perceived confidence levels among Year 3 and 4 pupils were high at baseline (proportion responding ‘strongly agree’ and ‘agree’ = 86.4%) and remained high at follow-up (proportion responding ‘strongly agree’ and ‘agree’ = 81.3%). This was equally true for control group pupils at baseline (proportion responding ‘strongly agree’ and ‘agree’ = 75.5%) and follow-up (proportion responding ‘strongly agree’ and ‘agree’ = 77.3%).
Years 5 and 6
49
Figure 9.5 Pupil responses to: “I am confident I can do things to keep myself as healthy and well as possible” by Year group (%)
Years 3 and 4 (n=171) Years 5 and 6 (n=124)
Note. Responses of ‘strongly agree’ and ‘agree’ are more desirable.
0 10 20 30 40 50 60 70 80 90 100
Strongly
disagree Disagree Neither agreenor disagree Agree Strongly agree
0 10 20 30 40 50 60 70 80 90 100
Strongly
50
Most of the time, most of us get better from most illnesses without any help Years 3 and 4
Baseline and follow-up responses presented in Figure 9.6 show almost an equal spread of responses across each of the five possible options (ranging from ‘strongly disagree’ to ‘strongly agree)’. The highest proportion of responses was for ‘neither agree nor disagree’ when asked the following: “Most of the time, most of us get better from most illnesses without any help”.
Years 5 and 6
Figure 9.6 Pupils responses to: “Most of the time, most of us get better from most illness without any help” by Year group (%)
Years 3 and 4 (n=171) Years 5 and 6 (n=124)
Note. Responses of ‘strongly agree’ and ‘agree’ are more desirable.
0 10 20 30 40 50 60 70 80 90 100
Strongly
disagree Disagree Neither agreenor disagree Agree Strongly agree
0 10 20 30 40 50 60 70 80 90 100
Strongly
52
10.
Facts4Life Questionnaire – Statistical
comparisons by Year group
10.1 Introduction
As described above in chapter 8.2 mixed analysis of variance (MANOVA) models were used to identify any changes in each of the outcome measures from baseline to follow-up. For these tests, Years 3 and 4, and Years 5 and 6 were considered separately.
10.2 Statistical comparisons - Results
When I feel unwell I need to take medicine to feel better
Years 3 and 4
As shown in Figure 10.1, there was a statistically significant improvement in Year 3 and 4 intervention group responses to the item “When I feel unwell I need to take medicine to feel better”, when controlling for control group responses, F (1, 168) = 23.82, p = 0.01.
Years 5 and 6
53
Figure 10.1 Mean responses to: “When I feel unwell I need to take medicine to feel better” at baseline and follow-up by Year group*
Years 3 and 4 (n=171) Years 5 and 6 (n=124)
Note. Scores range from 1 = strongly disagree – 5 = strongly agree. A decrease in mean score is desirable. * Mean score based on
estimated marginal mean derived from MANOVA test. 1
2 3 4 5
Baseline Follow-up
1 2 3 4 5