Abstract — Related information of optimal cutting parameters for machining and spring force operations is required for process planning. Numerous nonlinear constrained machining models have been developed with the objective of determining optimal operating conditions. The purpose of this article includes studying two algorithms to test their efficiency in solving several benchmark machining models. Two promising meta-heuristic algorithms for the numerical process improvement are particle swarm optimisation (PSO) and firefly (FFA) algorithms. A brief description of each algorithm is presented along with its pseudocode to facilitate the implementation and use of such algorithms by researchers and practitioners. Benchmark comparisons between the algorithms are presented in terms of processing time, convergence speed, and quality of the results. The experimental results show that FFA is clearly and consistently superior compared to the PSO both with respect to precision as well as robustness of the results including design points to achieve the final solution. Only for simple data sets, the PSO and FFA can obtain the same quality of performance measures. Apart from higher levels of performance measures, FFA is easy to implement and requires hardly any parameter tuning compared to substantial tuning for the PSO.
Index Terms — Meta-Heuristic, Particle Swarm Optimisation, Firefly Algorithm, Turning Machining and Spring Force Problems
I. INTRODUCTION
Machining can be defined as the process of removing materials from a work piece in the form of chips. The technical term of metal cutting is used when the material is
Manuscript received December 9, 2010; revised January 24, 2011. This work was supported in part the Thailand Research Fund (TRF), the National Research Council of Thailand (NRCT) and the Commission on Higher Education of Thailand. The authors wish to thank the Faculty of Engineering, Thammasat University, THAILAND for the financial support. *P. Aungkulanon is a Ph. D. Candidate, the Industrial Statistics and Operational Research Unit (ISO-RU), Department of Industrial Engineering, Faculty of Engineering, Thammasat University, 12120, THAILAND. [Phone: (662)564-3002-9; Fax: (662)564-3017; e-mail: [email protected], [email protected]].
N. Chai-ead is a master student, ISO-RU, Department of Industrial Engineering, Faculty of Engineering, Thammasat University, 12120, THAILAND.
P. Luangpaiboon is an Associate Professor, ISO-RU, Department of Industrial Engineering, Faculty of Engineering, Thammasat University, 12120, THAILAND.
metallic. Most machining has very low set-up cost when compared to forming, molding, and casting processes. However, machining is much more expensive for the high levels of volumes. Machining is also necessary where tight tolerances on dimensions and finishes are required.
Manufacturing environment in many large industries have currently attempted to introduce flexible manufacturing systems as their strategy to adapt to the ever-changing competitive market requirements. To ensure the quality of machining products and to reduce the machining costs and increase the machining effectiveness, it is very important to determine the proper machining parameter levels when the machine tools are selected during the manufacturing processes [1].
The traditional methods for solving this kind of optimisation problem include calculus-based searches, dynamic programming, random searches, and gradient methods whereas modern heuristic methods consist of artificial neural networks and Lagrangian relaxation approaches [2] including simulated annealing [3, 4]. Some of these methods are successful in locating the optimal solution, but they are usually slow in convergence and require much computing time including higher levels of design points to approach the optimum. Other methods may risk being trapped at a local optimum which fails to give the optimal solution.
Balic [1] proposes a new optimisation technique based on genetic algorithms for the determination of the cutting parameters in the machining operations. In metal cutting processes, cutting parameter conditions have an influence on reducing the production cost and time and deciding the quality of a final product. Linn et. al [5] present the modeling of a machining sequencing problem that is integrated with the lower-level machining process optimisation problem of a turning process in a just-in-time delivery environment.
In this paper, natural intelligence-inspired approximation optimisation techniques called meta-heuristics are then introduced for determining the manufacturing condition optimisation. The common factor in meta-heuristics is that they combine rules and randomness to imitate natural phenomena. They widely grow and apply to solve many types of problems. The collective intelligent behaviour of insect or animal groups in the world such as growth of frogs, flocks of birds, colonies of ants, schools of fish and swarms of bees including flashing characteristics of fireflies have interested the attention of researchers.
Generally, meta-heuristics work as follows: a population of individuals is randomly initialised where each individual represents a potential solution to the problem. The quality of each solution is then evaluated via a fitness function. A
Simulated Manufacturing Process Improvement
via Particle Swarm Optimisation
and Firefly Algorithms
selection process is applied during the iteration of meta-heuristics in order to form a new population. The searching process is biased toward the better individuals to increase their chances of being included in the new population. This procedure is repeated until convergence rules are reached.
They can be categorised into three groups: physically-based inspiration such as Simulated Annealing or SA [4]; biologically-based inspiration, e.g. Particle Swarm Optimisation or PSO [6, 7, 8] , Memetics algorithm or MAs [8], Genetic algorithm or GA [8], Shuffled Frog Leaping algorithm or SFLA [8] , Firefly algorithm or FFA [9], Bees algorithm or BA [10] , Neural Network or NN [11], Harmony Search Algorithm or HSA [12], Ant Colony Optimisation or ACO [13], , Evolutionary Programming or EP [14] and Differential Evolution or DE [15]; socially-based inspiration, e.g. Taboo Search or TS [16].
An evolutionary technique of the particle swarm optimisation or PSO [7] is proposed as an alternative to the genetic algorithm (GA). Its artificial development was based on observations of the social behaviour of animals such as bird flocking, fish schooling, and swarm theory. PSO is initialised with a population of random feasible solutions. Each individual is assigned with a randomised velocity according to its own and its companions flying experiences, and the individuals, called particles, are then flown through hyperspace. There are some attractive characteristics on the PSO when compared with the GA.
The PSO has its own memory, so knowledge of good solutions is retained by all particles, whereas in the GA, the previous knowledge of the problem is destroyed once the population changes via the crossover and mutation procedures. It has constructive cooperation between particles that the particles in the swarm share the useful information between them. Upon this simple concept, this provides the easy implementation and quick convergence. The PSO has currently gained much attention and wide applications in different fields. However, the performance of simple PSO greatly depends on its parameters, and it often suffers the problem of being trapped in local optima so as to be premature convergence like other heuristics.
The other meta-heuristic algorithm, which idealises some of the flashing characteristics of fireflies, has been recently developed and named the Firefly algorithm (FFA). Nature-inspired methodologies are currently among the most powerful algorithms for optimisation problems. FFA is a novel nature-inspired algorithm inspired by social behavior of fireflies. Fireflies are one of the most special, captivating and fascinating creature in the nature. There are about two thousand firefly species, and most fireflies produce short and rhythmic flashes. The rate and the rhythmic flash, and the amount of time form part of the signal system which brings both sexes together. Therefore, the main part of a firefly's flash is to act as a signal system to attract other fireflies [9].
Nowadays, the selection of an economically optimal combination of machining conditions is advanced in the area of manufacturing engineering. Process plans typically contain the specified sequence of operating conditions to be performed, specifying various parameters that aid in producing the part like machining dimensions, tolerances and machine and tool selection. This is achieved by using optimisation models for manufacturing conditions. The models are usually a combination of manufacturing process variables which are either maximised or minimised as
appropriate. Like any other optimisation model, these are in the format of an objective function and a set of constraints.
The objective of this paper is to investigate the performance of Particle Swarm Optimisation and Firefly (FFA) algorithms and to find the optimal solutions of proposed manufacturing processes. This paper is organised as follows. Section II describes the selected meta-heuristic of the particle swarm optimisation (PSO) including its pseudo code. Sections III and IV are briefing about the Firefly algorithm (FFA) and manufacturing process models. Section V describe and illustrate the design and analysis of computational experiments for comparing the performance of the proposed methods. The conclusion is also summarised and it is followed by acknowledgment and references.
II. PARTICLE SWARM OPTIMISATION ALGORITHM
A. Swarm in Nature
Particle swarm optimisation is a stochastic population based optimisation approach, first published by Kennedy and Eberhart in 1995. This algorithm has received various applications in both continuous and discrete optimisation problems, since its first publication. A large number of researches has been done to study the performance measures of the PSO and to improve its performance. PSO is inspired by the social behaviour of a flock of migrating birds trying to reach an unknown better destination.
From procedures of the PSO, each feasible solution is a ‘bird’ in the flock and is referred to as a particle which is analogous to a chromosome or population member in the genetic algorithm (GA). As opposed to the GA, the evolutionary process in the PSO does not generate new birds from the parent ones. Rather, the birds in the population merely evolve their social behaviour and accordingly their movement towards a destination.
This process physically mimics a flock of birds that communicate together as they fly. Each bird looks in a specific direction, and then when communicating together, they determine the bird that is in the best location. Each bird accordingly speeds towards the best bird using a velocity that depends on its current location. Each bird, then, investigates the search domain space from its new local position, and the process repeats until the flock reaches a proper destination. It is important to note that the PSO process involves both social interaction and intelligence so that birds learn from their own experience or local search and also from the experience of others around them or global search [7].
B. Particle Swarm Optimisation Algorithm
The sequential process is initialised with a group of random particles or feasible solutions of N. The ith particle is
represented by its position as a point in a S-dimensional space, where S is the number of manufacturing process variables. Throughout the process, the i-th particle measures three values of its current position (Xi), the best position that
it reached in the previous cycles (Pi) and its flying velocity
(Vi). These three values are represented as follows:
Current position Xi (xi1, xi2,…,xiS)
Best previous position Pi (pi1, pi2,…,piS)
In each time interval (cycle), the position (Pg) of the best
particle (g) is calculated as the best fitness of all particles. Accordingly, each particle updates its velocity of Vi to catch
up with the best particle of g, as follows:
(
)
(
)
i i 1 2 g i
V current V
new
=ω∗+
c *rand()* p x c *rand() p x
− +
−
When the new velocity of Vi is applied, the particle’s updated position becomes
New position Xi = current position Xi + New Vi,
and Vmax ≤ Vi ≤ –Vmax, where c1 and c2 are two positive
constants named learning factors (usually c1 = c2 = 2) and
rand( ) is the random function in the range of [0, 1]. Vmax is
an upper limit on the maximal change of particle velocity. The parameter of ω is an inertia weight employed as an improvement to control the impact of the previous history of velocities on the current velocity.
The operator ω plays the role of balancing the global search and the local search. It was proposed to decrease linearly with time from a value of 1.4 – 0.5. As such, global search starts, with a large weight and then decreases with time to favour the local search over the global search. It is noted that the second term in the equation of New Vi represents the cognition or the private thinking of the particle when comparing its current position to its own best. The third term in the equation of New Vi, on the other hand, represents the social collaboration among the particles, which compares a particle’s current position to that of the best particle.
In order to control the change of particles’ velocities, upper and lower bounds for the velocity change is also limited to a user-specified value of Vmax. Once the new
position of a particle is calculated, using the equation of New position Xi, the particle then flies towards it. As such, the main parameters used in the PSO technique are: the population size (number of birds), number of generation cycles, the maximal change of a particle velocity of Vmax;
and ω. The procedures of the Particle Swarm Optimisation algorithm (PSO) can be summarised as the pseudo code shown in Fig. 1.
Procedure PSO Meta-heuristic() Begin;
Initialise algorithm parameters: N: the swarm size
ω: the weight factor
C1, C2 : the acceleration coefficients (learning factor)
V: the velocity clamping
Generate random population of N solutions (particles); For each individual i N: calculate fitness (i);
Initialise the value of the weight factor; For each particle;
Set pBest as the best position of particle i; If fitness (i) is better than pBest;
pBest(i)=fitness (i); End if;
Set gBest as the best fitness of all particles; For each particle;
Calculate particle velocity; Update particle position; End for;
Update the value of the weight factor; Check if termination Z true; End for;
End procedure;
Fig. 1. Pseudo code of the Particle Swarm Optimisation.
From the studies of meta-heuristic algorithms, much effort has been invested to obtain a better understanding of the convergence properties. These studies concentrated mostly on a better understanding of the basic control parameters. From the studies it can be concluded that the meta-heuristic algorithms is sensitive to control parameter choices. Wrong initialisation of these parameters may lead to divergent or cyclic behavior [15].
III. FIREFLY ALGORITHM (FFA)
A. Firefly in Nature
Fireflies or glowworms are the creatures that can generate light inside of it. Light production in fireflies is due to a type of chemical reaction. This process occurs in specialised light-emitting organs, usually on a firefly's lower abdomen. It is thought that light in adult fireflies was originally used for similar warning purposes, but evolved for use in mate or sexual selection via a variety of ways to communicate with mates in courtships. Although they have many mechanisms, the interesting issues are what they do for any communication to find food and to protect themselves from enemy hunters including their successful reproduction.
The pattern of flashes is often unique for a particular species of fireflies. The flashing light is generated by a chemical process of bioluminescence. However, two fundamental functions of such flashes are to attract mating partners or communication, and to attract potential victim. Additionally, flashing may also serve as a protective warning mechanism. Both sexes of fireflies are brought together via the rhythmic flash, the rate of flashing and the amount of time form part of the signal system. Females respond to a male’s unique pattern of flashing in the same species, while in some species, female fireflies can mimic the mating flashing pattern of other species so as to lure and eat the male fireflies who may mistake the flashes as a potential suitable mate.
The light intensity at a particular distance from the light source follows the inverse square law. That is as the distance increases the light intensity decreases. Furthermore, the air absorbs light which becomes weaker and weaker as there is an increase of the distance. There are two combined factors that make most fireflies visible only to a limited distance that is usually good enough for fireflies to communicate each other. The flashing light can be formulated in such a way that it is associated with the objective function to be optimized. This makes it possible to formulate new meta-heuristic algorithms.
B. Firefly Algorithm
The firefly algorithm (FFA) is a meta-heuristic algorithm, inspired by the flashing behaviour of fireflies. The primary purpose for a firefly's flash is to act as a signal system to attract other fireflies. Now this can idealise some of the flashing characteristics of fireflies so as to consequently develop firefly-inspired algorithms. For simplicity in describing our new Firefly Algorithm (FFA) [9], there are the following three idealised rules.
towards the brighter one. The attractiveness is proportional to the brightness and they both decrease as their distance increases. If there is no brighter one than a particular firefly, it will move randomly. Finally, no firefly can attract the brightest firefly and it moves randomly.
The brightness of a firefly is affected or determined by the landscape of the objective function. For a maximisation problem, the brightness can simply be proportional to the value of the objective function. Other forms of brightness can be defined in a similar way to the fitness function in genetic algorithms. Based on these three rules, the basic steps of the firefly algorithm (FFA) can be summarised as the pseudo code shown in Fig. 2.
Procedure FFA Meta-heuristic() Begin;
Initialise algorithm parameters:
MaxGen: the maximal number of generations
γ: the light absorption coefficient
r: the particular distance from the light source
d: the domain space
Define the objective function of f(x), where x=(x1,...,xd)T
Generate the initial population of fireflies or xi (i=1, 2 ,..., n)
Determine the light intensity of Ii at xi via f(xi)
While (t<MaxGen)
For i = 1 to n (all n fireflies); For j=1 to n (n fireflies)
if (Ij > Ii), move firefly i towards j; end if
Attractiveness varies with distance r via Exp[-γr2];
Evaluate new solutions and update light intensity; End for j;
End for i;
Rank the fireflies and find the current best; End while
[image:4.595.302.545.336.710.2]Postprocess results and visualisation; End procedure;
Fig. 2. Pseudo code of of the FFA Meta-heuristic.
In the firefly algorithm there are two important issues of the variation of light intensity and the formulation of the attractiveness. For simplicity, it is assumed that the attractiveness of a firefly is determined by its brightness which in turn is associated with the encoded objective function of the optimisation problems. On the attractiveness of the FFA the main form of attractiveness function or β(r) can be any monotonically decreasing functions such as the following generalised form of 0
m
r (r) = e− γ
β β , (m 1), where
r or rijis the distance between the ith and jth of two fireflies.
β0 is the attractiveness at r = 0 and γ is a fixed light
absorption coefficient. The distance between any two fireflies i and j at xi and xj is the Cartesian distance as
follows: 2
, ,
1
( )
d
ij i j i k j k k
r x x x x
=
= − =
∑
− , where xik is the k-thcomponent of the i-th firefly (xi). The movement of a firefly,
i is attracted to another more attractive (brighter) firefly j, is determined by
2
1 0 ij( ) ( 0.5)
r
i i j i
x+ =x + β e−γ x −x + α rand−
, where the second term is due to the attraction while the third term is the randomisation with α being the randomisation parameter. Rand is a random number generator uniformly distributed in the range of [0, 1]. For most cases in the implementation, β0 = 1 and α [0, 1]. Furthermore, the randomisation term can easily be extended to a normal distribution N (0, 1) or other distributions.
Additionally, if the scales vary significantly in different dimensions such as −105 to 105 in one dimension while, say, −0.001 to 0.01 along the other, it is a good idea to replace α by αSk where the scaling parameters Sk (k = 1, ...,
d) in the d dimensions should be determined by the actual scales of the problem of interest. The parameter γ
characterises the variation of the attractiveness, and its value is crucially important in determining the speed of the convergence and how the FFA behaves. In most applications, it typically varies from 0.01 to 100.
IV. MANUFACTURING PROCESS MODELS In this section, we review the different machining models we have used in this study. Optimal machining conditions play an important role as the key to economical machining operations. In this work, some benchmark machining models are evaluated for optimal machining conditions. These machining models are complex because of non-linearities, constraints and non-convexity [19].
Hati and Rao model
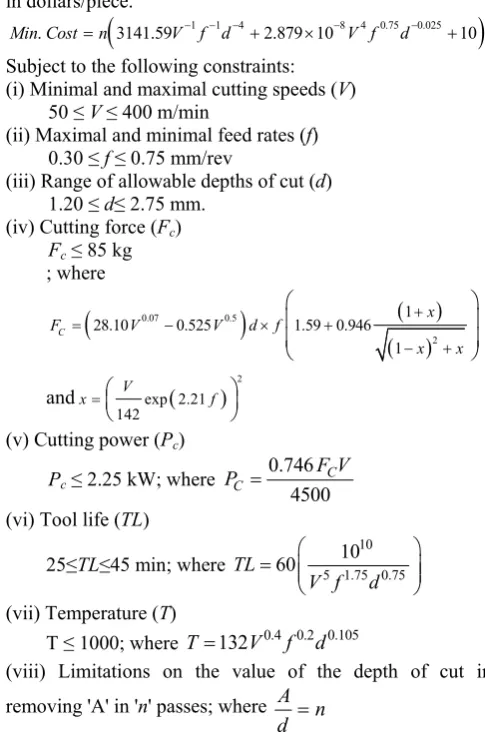
Hati and Rao have used this model in multi-pass turning optimisation of mild steel work-piece using a carbide tool. The objective function used is the minimal production cost in dollars/piece.
(
1 1 4 8 4 0.75 0.025)
. 3141.59 2.879 10 10
Min Cost=n V f d− − − + × −V f d− +
Subject to the following constraints: (i) Minimal and maximal cutting speeds (V)
50 ≤V≤ 400 m/min (ii) Maximal and minimal feed rates (f) 0.30 ≤f≤ 0.75 mm/rev (iii) Range of allowable depths of cut (d)
1.20 ≤d≤ 2.75 mm. (iv) Cutting force (Fc)
Fc≤ 85 kg ; where
(
)
(
)
(
)
0.07 0.5
2
1
28.10 0.525 1.59 0.946
1
C
x
F V V d f
x x
+
= − × +
− +
⎛ ⎞
⎜ ⎟
⎜ ⎟
⎝ ⎠
and ( )
2 exp 2.21 142
V
x=⎛⎜ f ⎞⎟
⎝ ⎠
(v) Cutting power (Pc)
Pc≤ 2.25 kW; where
0.746 4500
C C
F V P =
(vi) Tool life (TL)
25≤TL≤45 min; whereTL 60 5 1.75 0.751010
V f d
⎛ ⎞
= ⎜⎜ ⎟⎟
⎝ ⎠
(vii) Temperature (T)
T ≤ 1000; where T=132V0.4 0.2 0.105f d
(viii) Limitations on the value of the depth of cut in removing 'A' in 'n' passes; where n
d A=
Ermer model
Ermer's model minimises production cost in dollars/piece for single pass turning of
1 1 8 3 0.16
. 1.25 1.8 10 0.2
Min Cost= V f− − + × −V f +
SF≤ 100 μ in; where SF=1.36 10× 8V−1.52 1.004f
(ii) Feed rate (F)
F≤ 0.01 in/rev
(iii) Horsepower
HP≤ 2.0 hp; where HP=3.58V0.91f0.78
Ermer and Kromodihardjo model
This model minimises the production cost in dollars/piece for single pass turning.
2 . 0 10
77 . 1 2566
. 1
.Cost= V−1f−1+ × −8V3f0.16+
Min
Subject to the constraints: (i) Feed rate (f)
f≤ 0.1 in/rev
(ii) Horsepower (HP)
HP≤ 4 hp; where HP=2.39V0.91 0.78 0.75f d
(iii) Surface finish (SF)
SF≤ 50 μ in
; where SF=204.62 10× 6V−1.52 1.004f D0.25 Iwata, Oba and Murotsu model
Iwata, Oba and Murotsu have proposed this model for the multi -pass turning operation of medium carbon steel using carbide tool where the objective is the production cost/piece in yens/piece.
( )
∑
=
− −
− −
− + × +
= n
i
i i i
i i
i f V f f d
V Cost
Min
1
117 . 1 1
88 . 2 8 1
1 1.95 10 exp5.884 60
3927 .
Subject to the following constraints: (i) Minimal and maximal feed rates (f) 0.001 ≤ f ≤ 5.6 mm/rev
(ii) Minimal and maximal cutting speeds (V) 14.13 ≤V≤ 1005.3 m/min
(iii) Minimal and maximal depth of cut (d) 0 ≤d≤A mm
; where 'A' is the depth of material to be cut (iv) Maximal cutting force (FC)
FC≤ 170 kg; where FC =290.73V−0.1013 0.725f d
(v) Stable cutting region related to the cutting surface
f V 2≥ 2230.5
(vi) Maximum allowed surface roughness (Hmax)
0.356 f 2≤H
max; where Hmax ranges from 0.01 to 0.06
mm.
(vii) The maximal power consumption (PC)
PC=7.5 kW; where
4896
C C
F V P =
(viii) The sum of depths of cut of the ‘n’ passes used to remove the total depth 'A' of the material
; where
1
n i i
d A
= =
∑
Maximal spring force model
(
5)
3 2(
5)
41 1 1
140 280 280
. 300 16 1 20 1 1
Max Y x x x x x
x x x
= +
⎜
⎛
− +⎟ ⎜
⎞ ⎛
+ −⎜
⎛
− −⎞
⎟
⎞⎛
⎟⎜
−⎞
⎟
⎝
⎠ ⎝
⎝
⎠
⎠⎝
⎠
Subject to the following constraints:
(i) Minimal and maximal edge of paper facing to shaft (x1)
100 ≤x1≤ 180
(ii) Minimal and maximal joint of spring (x2)
35 ≤x2≤ 75
(iii) Minimal and maximal strength of spring (x3)
5 ≤x3≤ 15
(iv) Minimal and maximal compression distance of spring (x4)
20 ≤x4≤ 50
(v) Minimal and maximal paper thickness (x5)
0 ≤x5≤ 50
V. COMPUTATIONAL RESULTS AND ANALYSES In this work, for the computational procedures described above a computer simulation program was implemented in a Visual C# 2008 computer program. A Laptop computer ASUS F83SE Series was used for computational experiments. A comparison of the conventional procedures of PSO and FFA is determined in this section.
Each algorithm has its own influential parameters that affect its performance in terms of solution quality and execution time. To achieve the most preferable parameter choices that suit the tested manufacturing problems, a large number of experiments were conducted. In each algorithm, an initial setting of the parameters was established using values previously reported in the literature. The parameter values were then analysed to determine the proper levels and the results were monitored in terms of the solution quality. The parameter levels adopted for each of the method are followed.
For all optimisation problems presented in these paper PSO and FFA parameter levels were applied throughout. For the PSO, acceleration factors of c1 and c2 are set at 2. Rand(
) is the random function in the range of [0, 1] and Vmax is an
upper limit on the maximal change of particle velocity which is two. The operator (ω) plays the role of balancing the global search and the local search; and was proposed to decrease linearly with time from a value of 1.4–0, but in this paper it is at 0.08. FFA parameters were set as follows: β0=
1, α = [0, 1], γ = [0.01, 100] and the number of fireflies = 40. Both algorithms were executed with the same designed points of 6000 realisations.
The first turning process used in the study was the Hati and Rao model. Three runs were made with different initial vectors and the results are presented in Table I. A depth of cut of 5 millimeters was used or there was 2.5 millimeters for each pass. The second model used in the study was the Ermer model. A depth of 0.2 inches in one pass was removed and there were three different starting points. The numerical results are given in Table II. The third model used was Ermer and Kromodihardjo model.
The results are shown in Table III where 0.2 inches of material was removed in one pass. In the fourth operation in this study, the Iwata, Oba and Murotsu model were used for removing a depth of 2 millimeters and a surface roughness ranges from 0.01 to 0.06 millimeters. The results are presented in Table IV. The fifth model was the spring force. The results are presented in Table V. The Box plot to show the central tendency and dispersion effects on the process yields of Iwata, Oba and Murotsu model are presented in Fig.3.
TABLEI
EXPERIMENTAL RESULTS ON THE HATI AND RAO MODEL
Hati and Rao PSO FFA
Yield Time Yield Time Average 41.0013 1677.8072 39.6120 1557.9125 Std. Dev. 1.5794 127.3855 0.3817 119.6821
TABLEII
EXPERIMENTAL RESULTS ON THE ERMER MODEL
Ermer's model PSO FFA
Yield Time Yield Time Average 7.1946 1008.6035 6.9509 907.5122 Std. Dev. 0.3226 85.3539 0.0954 34.3319
Max 7.7423 1097.1795 7.0731 1052.9590 Min 6.4829 900.8781 6.6847 895.4814
TABLEIII
EXPERIMENTAL RESULTS ON THE ERMER AND KROMODIHARDJO MODEL
Ermer and
Kromodihardjo Yield Time Yield Time PSO FFA Average 1.7120 1176.4829 1.6260 1234.5305 Std. Dev. 0.0336 201.1963 0.0281 201.0742
Max 1.8025 1616.1655 1.6930 1430.3521 Min 1.6754 1035.1709 1.5881 924.4883
TABLEIV
EXPERIMENTAL RESULTS ON THE LWATA,OBA AND MUROTSU MODEL
lwata, Oba and Murotsu
PSO FFA Yield Time Yield Time Average 202.6114 1781.3440 192.9627 1639.5464 Std. Dev. 15.2584 114.6797 0.7273 101.5369 Max 256.9248 2009.4143 194.8105 1820.3144 Min 192.4981 1661.1357 192.1990 1490.5800
TABLEV
EXPERIMENTAL RESULTS ON THE SPRING FORCE MODEL
Spring Force Yield Time PSO FFA Yield Time Average 3253.9565 1613.0085 3369.8709 1367.8283 Std. Dev. 150.8181 125.1151 4.8730 100.5263
Max 3373.5019 1885.3254 3376.6198 1568.1757 Min 2814.0620 1538.3898 3357.5781 1218.5224
FFA PSO
260
250
240
230
220
210
200
190
Da
ta
lwata, Oba and Murotsu Model
[image:6.595.39.545.54.606.2]Fig. 3. Graphical Results on lwata, Oba and Murotsu Model.
In conclusion, we have formulated the FFA and analysed its similarities and differences with the PSO. From the results obtained, it can be concluded that the FFA seem highly reliable and converge consistently to the optimal solutions on five benchmark manufacturing optimisation problems.
It is interesting to investigate that the behaviour of each meta-heuristic algorithm in all tested problems was consistent. In particular, the FFA generally outperformed the other algorithm in solving all the tested problems on both minimisation and maximisation in terms of solution quality measures such as a speed of convergence, computation time, a central tendency and dispersion effects on the actual yields.
Accordingly, it can be concluded that the FFA is a promising optimisation tool, in part due to the variation of the attractiveness and its own effective sequential procedures. Moreover, FFA consumes the computation time
on only the first stage of generating initial feasible solution and there is no random sampling of solution during the recursive procedures. This is the difference when compared with the bees and harmony search algorithms.
REFERENCES
[1] F. Cus, J. Balic ,”Optimisation of Cutting Process by GA Approach”,
Robotics and Computer Integrated Manufacturing, vol.19, 2003, pp.
113–121.
[2] V.N. Hsu, M. Daskin, P.C. Jones and T.J. Lowe, “Tool Selection for Optimal Part Production: a Lagrangian Relaxation Approach”, IIE
Transaction, 1995, pp.417–26.
[3]
B. Hajek.,“A Tutorial Survey of Theory and Applications of
Simulated Annealing.”,
In Proceedings of the 24th IEEE
Conference on Decision and Control
, vol. 2 , 1985, pp. 755
–760.
[4] V. Granville, M. Krivanek and J. P.Rasson,“Simulated annealing: a Proof of Convergence”, Pattern Analysis and Machine Intelligence,
IEEE Transactions,vol. 16, Issue 6, 1994, pp. 652 – 656.
[5] R.J. Linn, B. Yen and W. Zhang ,”Just-in-Time Scheduling with Machining Economics for Single-Machine Turning Process”, Journal
of Manufacturing Systems,vol. 19, No.4,2000.
[6] Y.M. Cheng, L. Li and S.C. Chi , “Performance Studies on Six Heuristic Global Optimisation Methods in the Location of Critical Slip Surface Computers and Geotechnics”, Computers and
Geotechnics, vol. 34, 2007, pp.462–484.
[7] B. Liu, L. Wang, Y.H. Jin, F. Tang and D.X. Huang “Improved Particle Swarm Optimisation Combined with Chaos”, Solitons and
Fractals, vol. 25, 2005, pp.1261–1271.
[8] E. Emad, H. Tarek and G. Donald, “Comparison among Five Evolutionary-based Optimisation Algorithms,” Advanced Engineering Informatics, vol 19, 2005, pp. 43-53.
[9] X.S. Yang, “A Discrete Firefly Meta-heuristic with Local Search for Makespan Minimisation in permutation Flow Shop Scheduling Problems”, International Journal of Industrial Engineering
Computations, vol. 1, 2010, pp. 1–10.
[10] D.T. Pham, A. Ghanbarzadeh, E. Koc, S. Otri, S. Rahim and M. Zaidi, “The Bees Algorithm. Technical Note”. Manufacturing
Engineering Centre, Cardiff University, UK, 2005
[11] P. Muller and D.R. Insua, "Issues in Bayesian Analysis of Neural Network Models", Neural Computation, vol. 10, 1995, pp. 571–592. [12] K.S. Lee and Z.W. Geem, “A New Meta-heuristic Algorithm for
Continues Engineering Optimisation: Harmony Search Theory and Practice,” Comput: Meth. Appl. Mech. Eng., vol. 194, 2004, pp. 3902–3933.
[13] M. Dorigo, V. Maniezzo and A. Colorni, “Ant System: Optimisation by a Colony of Cooperating Agents”, IEEE Transactions on Systems,
Man, and Cybernetics Part B, vol. 26, numéro 1,1996, pp. 29-41.
[14] J.Y. Jeon, J.H. Kim, and K. Koh “Experimental Evolutionary Programming-based High-precision Control”, IEEE Control Sys. Tech., vol. 17, 1997, pp. 66-74.
[15] R. Storn, “System Design by Constraint Adaptation and Deferential Evolution", IEEE Trans. on Evolutionary Computation., vol. 3, no. 1, 1999 , pp. 22-34.
[16] A. Lokketangen, K. Jornsten and S. Storoy “Tabu Search within a Pivot and Complement Framework ” , International Transactions in
Operations Research, vol. 1, no. 3,1994, pp. 305-316.
[17] S. Lukasik and S. Zak, “Firefly Algorithm for Continuous Constrained Optimisation Tasks”, Systems Research Institute, Polish
Academy of Sciences, 2010, pp. 1–10.
[18] H. Zang, S. Zhang and K. Hapeshi, “A Review of Nature-Inspried Algorithms”, Journal of Bionic Engineering”, vol. 7, 2010, pp.232– 237.