An Interactive Evolutionary Parametric
Optimization of EDM on D2 Hot Die Steel by using
Grey-Taguchi Technique
Jitender1, Vaibhav Khurana2, Anil Kumar3 1, 2
Department of Mechanical Engineering, Geeta Engineering College, Panipat Haryana
3
Department of Product development and Engineering, Vehant Technologies, Noida, U.P.
Abstract: Electro discharge machining is one of the crucial non-traditional machining processes which widely used for arduous materials and for that material that could not be possible to machine with standard machining procedures such as composites along with inter- metallic products. EDM functions within the ignite erosion approach identical to having an electrical short which burns up a small hole inside the metal which come in contact. In EDM method both perform portion substance and the electrode substance must be conductors involving energy that is electricity. Complicated single profiles utilized in prosthetics, bio- medical purposes may be done with EDM. Likewise Electro Discharge Machining (EDM) involves in production of complicated shapes, micro openings along with substantial reliability in numerous electrically conductive products along with high- durability temperature-resistant components. In this paper investigated the optimization of process parameter of EDM machine to get the maximum MRR and minimum TWR. The aim of this paper to study the performance of electrodes of Copper Brass and Aluminium on D2 (Hot die steel) with EDM process.
Keywords: EDM, MRR, TWR, ANOVA, OA, S/N
I. INTRODUCTION
parameter and errors towards the variation of responses, Analysis of Variance (ANOVA) technique is used [4, 5]. Thus by influential the contribution of the parameters towards the responses, the influence of individual parameters on the response change can be resolute, thereby enabling the user to focus on the important factor that is most likely to cause a change in the responses.
II. EXPERIMENTALDETAILS A. Tool material
In EDM electrode material plays an significant role. During study, the electrode material is measured as a variable. In the presentstudy, three different electrodes are used as tool material for machining. The electrode materials used are brass, aluminium and copper.
B. Work material
The chemical composition of the work material D2 (HOT DIE STEEL) is shown in Table I and fig.1.Shows that the workpiece before and after the machining.
TABLE I
COMPOSITION OF D2 (HOT DIE STEEL)*
Composition Percentage (wt %) Composition Percentage (wt %)
Carbon 0.459% Vanadium 0.214%
Silicon 0.868% Tungsten 0.0313%
Manganese 0.332% Lead 0.0013%
Nickel 0.348% Tin 0.0101%
Chromium 6.40% Calcium 0.00016%
Molybdenum 1.00% Zinc 0.0129%
Sulphur 0.01% N 0.0147
Phosphorus 0.0189 B 0.00097%
Iron 90.00% As <0.0010%
Cobalt 0.0179% Nb 0.0076%
Copper 0.144 Aluminium <0.00050
Titanium 0.0025%
*Percentage of Composition Based on The Spectroscopy Test.
Fig. 1 Work piece before and after machining
III.RESEARCHMETHODOLOGY
multi-responses through grey relational grade. Furthermore, a statistical analysis of variance (ANOVA) is performed to see which process parameters are statistically significant. The steps involved are:
A. Selection of process parameters and response
[image:3.612.111.504.553.711.2]The process parameters and levels preferred for the experiments are shown in Table II
TABLE II LEVEL VALUES OF INPUT FACTORS
Control Factors I Level II Level III Level
Peak Current (Ip) amp 4 8 12
Pulse on time (Ton) sec. 500 1000 1500
Electrode Material Brass Aluminium Copper
B. Design of Experiment
Experiments are performed, randomly, according to the L9 orthogonal array created by Minitab-17 software; on D2 (HOT DIE
STEEL).For each experiment, a separate electrode is selected. The machining time is 10 minutes for every experiment. The machining time is noted from the timer of the machine. The electrode wear rate is calculated by weight difference between the electrodes using an automatic weighing machine with 300g capacity with a precision of 10mg. The observations along with the details of the values of various parameters for evaluating TWR, MRR based on the L9 orthogonal array are shown in Table III
TABLE III DESIGN OF EXPERIMENT
S.No Peak Current (A) Pulse On Time (sec) Electrode Material
1 4 500 COPPER
2 8 1000 BRASS
3 12 1500 ALUMINIUM
4 4 1000 ALUMINIUM
5 8 1500 COPPER
6 12 500 BRASS
7 4 1500 BRASS
8 8 500 ALUMINIUM
9 12 1000 COPPER
IV.RESULTANDDISCUSSION A. Observation and Calculation for MRR and TWR
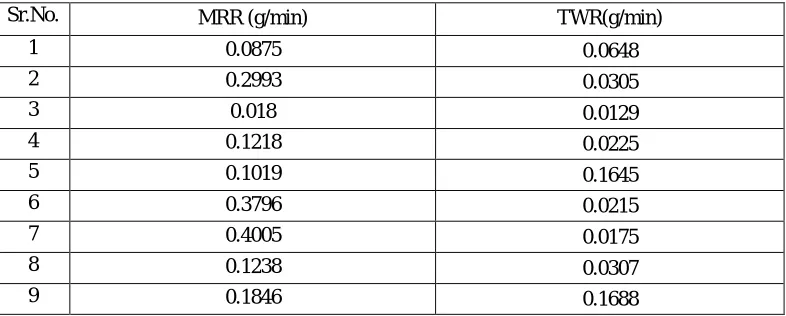
After the experimental procedure, different response factors like MRR, TWR calculated from the experimental data are tabulated in Table.
Table IV S/N Ratio for MRR and TWR
Sr.No. MRR (g/min) TWR(g/min)
1 0.0875 0.0648
2 0.2993 0.0305
3 0.018 0.0129
4 0.1218 0.0225
5 0.1019 0.1645
6 0.3796 0.0215
7 0.4005 0.0175
8 0.1238 0.0307
B. Calculation of the Normalized value of MRR &TWR
In this step of the grey relational analysis, pre-processing of the data was first performed for normalizing the raw data for analysis. This is shown in Table-V, Yi, Xi is normalized by the following formula to avoid the effect of adopting different units and to reduce the variability. The normalized output parameter (MRR) corresponding to the larger-the-better criterion can be expressed by equation-1.
)
(
min
)
(
max
)
(
min
)
(
)
(
k
x
k
x
k
x
k
x
k
X
i i i i i
(1)Then for the output parameters (TWR), which follow the lower-the-better criterion can be expressed by equation-2.
)
(
min
)
(
max
)
(
)
(
max
)
(
k
y
k
y
k
y
k
y
k
Y
i i i i i
(2) Where [image:4.612.85.525.293.454.2]xi (k),Xi(k) & yi (k),Yi(k) are the sequence after the data preprocessing and comparability sequence respectively, k=1;i=1, 2, 3…, 9 for experiment numbers 1 to 9.
Table V Normalized Value for MRR and TWR
Expt. No. Normalized MRR (Xi) Normalized TWR (Yi)
Reference Sequence 1.0000 1.0000
1 0.1685 0.6671
2 0.6819 0.8871
3 0.0000 1.0000
4 0.2516 0.9384
5 0.2034 0.0276
6 0.8766 0.9448
7 1.0000 0.9705
8 0.2565 0.8858
9 0.4039 0.0000
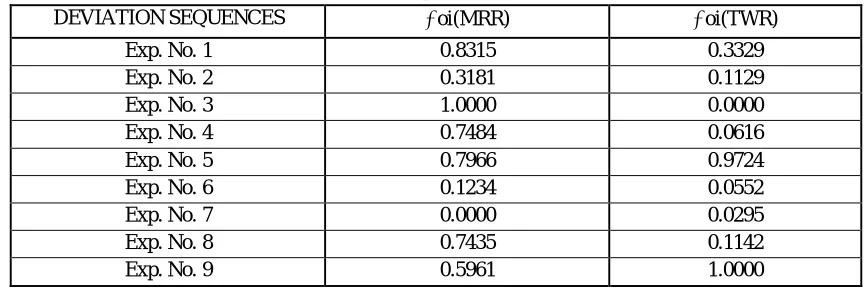
C. Calculation of Deviation Sequence
The grey relational coefficient is calculated to express the relationship between the ideal (best) and actual normalized experimental results. Before that the deviation sequence for the reference and comparability sequence were found out. These are given in Table V and the grey relational coefficient is given in Table VI the deviation sequence can be expressed by equation-3.
∆oi=│xo*(k) – xi*(k) │ (3)
Where ∆oi is the deviation sequence of the reference sequence xo*(k) and the comparability sequence xi*(k) and comparability value is taken as 1 for all the experiments.
Table VI Deviation sequence for MRR and TWR
DEVIATION SEQUENCES oi(MRR) oi(TWR)
Exp. No. 1 0.8315 0.3329
Exp. No. 2 0.3181 0.1129
Exp. No. 3 1.0000 0.0000
Exp. No. 4 0.7484 0.0616
Exp. No. 5 0.7966 0.9724
Exp. No. 6 0.1234 0.0552
Exp. No. 7 0.0000 0.0295
Exp. No. 8 0.7435 0.1142
[image:4.612.88.522.577.721.2]D. Calculation of Grey Relational Coefficient And Grade
After data pre-processing is carried out, a grey relational coefficient can be calculated with the pre-processed sequence. It expresses the relationship between the ideal and actual normalized experimental results. The grey relational coefficient is defined as follows by equation-4.
max )
(
max min
) (
0
k k
i i
(4)
Where
∆oi (k) is the deviation sequence of the reference sequence x*(k) and the comparability sequence is xi*(k), ξ distinguishing or identification coefficient. If all the parameters are given equal preference & taken as 0.5 [7].The grey relational coefficient for each experiment of the L9 OA can be calculated using equation and same is expressed in Table VII. After obtaining the grey relational
coefficient, the grey relational grade is computed by averaging the grey relational coefficient corresponding to each performance Characteristic. The overall evaluation of the multiple performance characteristics is based on the grey relational grade that is given by equation-5 [8].
= ( + ) (5)
Where ith the grey relational grade for the ith experiment and n is the number of performance characteristics which is taken as 2 for
MRR and TWR, Table VII shows the grey relational grade for each experiment using L9 OA. The higher grey relational grade
represents that the corresponding experimental results are closer to the ideally normalized value. Experiment 1 has been multiple performance characteristics among nine experiments because it has the highest grey relational grade. It can be seen that in the present study, the optimization of the complicated multiple performance characteristics of EDM of D2 (HOT DIE STEEL) has-been converted into optimization of a grey relational grade.
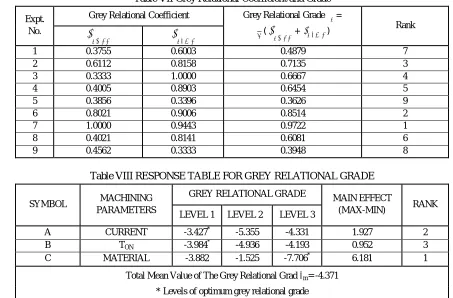
E. Calculation of Main effect and ANOVA
[image:5.612.74.527.431.729.2]Since the experimental design is orthogonal, it is then possible to separate out the effect of each machining parameter on the grey relational grade at different levels 1, 2 and 3 can be calculated by averaging the grey relational grade for the experiment 1 to 3, 4to 6 and 7 to 9 as respectively as shown in Table VIII
Table VII Grey Relational Coefficient and Grade
Expt. No.
Grey Relational Coefficient Grey Relational Grade =
( + ) Rank
1 0.3755 0.6003 0.4879 7
2 0.6112 0.8158 0.7135 3
3 0.3333 1.0000 0.6667 4
4 0.4005 0.8903 0.6454 5
5 0.3856 0.3396 0.3626 9
6 0.8021 0.9006 0.8514 2
7 1.0000 0.9443 0.9722 1
8 0.4021 0.8141 0.6081 6
9 0.4562 0.3333 0.3948 8
Table VIII RESPONSE TABLE FOR GREY RELATIONAL GRADE
SYMBOL MACHINING PARAMETERS
GREY RELATIONAL GRADE
MAIN EFFECT
(MAX-MIN) RANK LEVEL 1 LEVEL 2 LEVEL 3
A CURRENT -3.427* -5.355 -4.331 1.927 2
B TON -3.984* -4.936 -4.193 0.952 3
C MATERIAL -3.882 -1.525 -7.706* 6.181 1
Total Mean Value of The Grey Relational Grad m= -4.371
The mean of the grey relational grade for each level of the other machining parameters namely Peak current, pulse on time and electrode material can be computed in the same behavior. The mean of the grey relational grade for each level of the machining parameters is summarized and shown in Table VIII. In addition, the total mean of the grey relational grade for the nine experiments is also calculated and presented in Table VIII
Fig.2. shows the grey relational grade obtained for different process parameters. The mean of the grey relational grade for each parameter is shown by a horizontal line. Basically, the larger the grey relation grade is, the closer will be the product quality to the ideal value. Thus, the larger grey relational grade is desired for optimum performance. Therefore, the optimal parameters setting for better MRR and lesser TWR are (A1B1C3) as presented in Table VIII. The optimal level of the process parameters is the level with the highest grey relational grade.
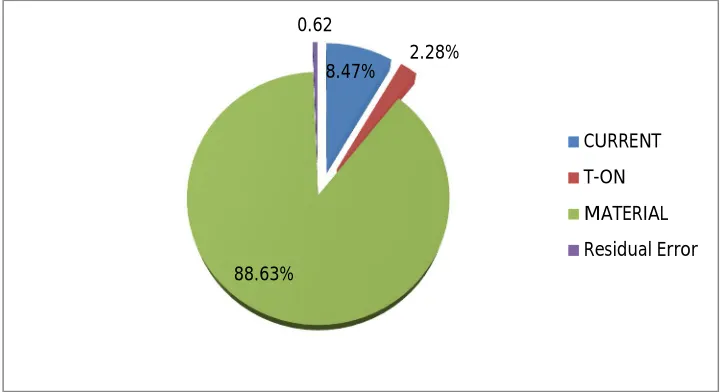
[image:6.612.116.495.280.575.2]Furthermore, ANOVA has been performed on grey relational grade to obtain contribution of each process parameter affecting the two process characteristics jointly and is discussed in the forthcoming section ANOVA for a grey relational grade is presented in Table IX. Percentage contributions for each term affecting grey relational grade are shown in Fig.3, Fig.3 clearly shows that Material & Current are the dominant parameter that affects grey relational grade and hence contributes in improving MRR and reducing TWR It can be seen from Figures 2 and 3 that current & material are the most significant factor that affects the grey relational grade. Metal removal is directly proportional to the amount of energy applied by the current.
[image:6.612.70.547.596.719.2]Fig.2 Main effect plot
Table IX Analysis Of Variance for Grey Relational Grade
Parameter DOF Sum of
squares Adj SS
Mean
Squares F ratio P
PERCENTAGE CONTRIBUTION
CURRENT 2 5.5790 5.5790 2.7895 13.78 0.068 8.47
T-ON 2 1.5036 1.5036 0.7518 3.71 0.212 2.28
MATERIAL 2 58.3841 58.3841 29.1921 144.18 0.007 88.63
Residual
Error 2 0.4049 0.4049 0.2025 0.62
Total 8 65.8716 100.00%
12 8
4 -1
-2
-3
-4
-5
-6
-7
-8
1500 1000
500 ALUMINIUM BRASS COPPER
CURRENT
M
e
a
n
o
f
S
N
r
a
ti
o
s
SPARK ON TIME TOOL MATERIAL
Main Effects Plot for SN ratios
Data Means
Fig.3Percentage contribution of parameters
V. CONFIRMATIONTEST
[image:7.612.93.520.359.480.2]Confirmation test has been carried out to verify the improvement of performance characteristics (MRR & TWR) in D2 (HOT DIE STEEL) using EDM the best possible parameters are selected for confirmation test as represented in Table X
Table X Theoretical and grey optimal level
CONDITION DESCRIPTION
OPTIMAL MACHINING PARAMETERS
MACHINING PARAMETERS IN THE SEVENTH TRIAL OF OA
GREY THEORY PREDICTION DESIGN
LEVEL A1B3C1 A1B1C1
MRR (g/min) 0.4005 0.4321
TWR (g/min) 0.0175 0.0146
Improvement In MRR=0.0316 g/min (approx.7.89%) Improvement In TWR= 0.0029g/min(approx.19.86% )
Table X which shows the comparison of the experimental results using the initial (OA, A1B3C1) and optimal (grey theory prediction design, A1B1C1) machining parameters.
Based on Table, MRR is accelerated from 0.4005 to 0.4321g/min; the TWR is decreased from 0.0175 to 0.0146 g/min. The corresponding improvements in MRR and TWR are 7.89 % and 19.86 % respectively. It is clearly shown that the multiple performance characteristics in the EDM process are greatly enhanced through this study.
VI.CONCLUSION
The GRA based on the Taguchi method’s response table has-been proposed as a way of studying the optimization of EDM process parameters for D2 (HOT DIE STEEL). The optimal machining parameters have been determined by the grey relational grade for Multiperformance characteristics that are MRR and TWR. Nine experimental runs based on OA’s have been performed. The following conclusions can be drawn from this study.
The work has successfully evaluated the feasibility of EDM of D2 (HOT DIE STEEL)
From the response table of the average grey relational grade, it is found that the largest value of grey relational grade for discharge current, pulse on time and material are 5A, 500µs and Brass respectively. These are the recommended levels of controllable process factors when better MRR and lesser TWR are concurrently obtained.
The ANOVA of the grey relational grade for multi-performance characteristics reveals that the material and current are the most major parameter.
Based on the confirmation test, the improvements in MRR and TWR are 7.89% and 19.86% respectively.
8.47% 2.28%
88.63% 0.62
CURRENT
T-ON
MATERIAL
It is shown that the performance characteristics of the EDM process such as MRR and TWR are improved together by using the method proposed by this study. The effectiveness of this approach has been successfully recognized by validation experiment.
REFERENCES
[1] Ramalingam, V.; Sivasubramanian, R.; and Senthil kumar, M. (2007). A Study on optimization of process parameters in EDM using Taguchi’s DOE technique. International Journal for Manufacturing Science and Production, 8(2-4), 181-186.
[2] Raghuraman, S.; Thiruppathi, K.; Panneerselvam, T.; and Santosh, S. (2013). Optimization of EDM parameters using Taguchi method and grey relational analysis for mild steel is 2026. International Journal of Innovative Research in Science, Engineering and Technology, 2(7), 3095-3104.
[3] Lajis, M.A.; Mohd Radzi, H.C.D.; and Nurul Amin, A.K.M. (2009). The implementation of Taguchi method on EDM process of tungsten carbide. European Journal of Scientific Research, 26(4) 609-617.
[4] Schonlau, M.; and Welch, W.J. (2006). Screening the input variables to a computer model via analysis of variance and visualization. Methods for Experimentation in Industry, Drug Discovery and Genetics, Chapter 14, 308-327.
[5] Radhika, N.; Subramanian, R.; and Babu Devasenapathi,S. (2013). Machining parameter optimization of an aluminium hybrid metal matrix composite by statistical modelling. Journal of Industrial Lubrication and Tribology, 65(6), 425-435.
[6] A textbook by R. Ranjit, A Primer on the Taguchi Method, van Nostrand Reinhold, New York (1990).
[7] Rajesh Khanna and Hari Singh, Comparison of optimized settings for cryogenic treated and normal D-3 steel on WEDM using grey relational theory, Journal of Materials: Design and Applications, Vol. 230(I) (2016) 219-232.