1
Adverse effects of antipsychotics on micro-vascular endothelial cells of the human blood brain barrier.
Ekramy Elmorsy*2, Laila M. Elzalabany2, Hany M. Elsheikha† , and Paul A. Smith*1
*School of Life Science, University of Nottingham Medical School, Queens Medical Centre,
Nottinghamshire, NG7 2UH, UK
2Departments of Forensic Medicine and Clinical Toxicology, Faculty of Medicine,
Mansoura University, Egypt
† School of Veterinary Medicine and Science, University of Nottingham, Sutton Bonington
Campus, Loughborough, Leicestershire, LE12 5RD, UK
1 To whom correspondence should be addressed at School of Life Science, University of
Nottingham Medical School, Queens Medical Centre, Nottinghamshire, NG7 2UH, UK,
Fax: (0115)823-0135. E-mail: [email protected]
Key words: Antipsychotics; Blood brain barrier; apoptosis; Evans blue,
2
Abstract
Although the mechanisms of action of antipsychotics (APs) on neuronal
function are well understood, very little is known about their effects on
cells of the blood brain barrier (BBB); one function of which is to limit the
access of these amphiphilic compounds to the central nervous system. To
address this question we have investigated the cytological and functional
effects of four APs: chlorpromazine (CLP), haloperidol (HAL), risperidone
(RIS) and clozapine CLZ), at concentrations typical of high therapeutic
dosage on a human brain microvascular endothelial cell (HBMEC) model of
the BBB. At ~10µM all four APs impaired the ability of HBMECs to reduce
MTT which was followed by decreased Trypan blue exclusion and increased
Lactate dehydrogenase release. These effects were associated with
oxidative stress which was partly reversed by incubation in 10mM
glutathione. At their EC50 concentrations for MTT reduction, all four APs
disrupted cellular ultrastructure and morphology. HAL, CPZ and CLZ
increased Caspase -3, -8 and -9 activity, chromatin condensation and
fragmentation, data indicative of apoptosis. These events were associated
with decreased transcytosis of Evans blue and increased transendothelial
potential difference and electrical resistance of this BBB model. These
findings suggest that at high therapeutic concentrations, CPZ and CLZ are
likely to incur cytoxic effects and apoptosis of BBB endothelia with an
3
aetiology of neuroleptic associated cerebral oedema and neuroleptic
4
1. Introduction
Antipsychotics (APs) are widely prescribed to manage psychoses that
occur with schizophrenia and bipolar disorder (Miyamoto et al., 2005).
Initially thought to achieve their therapeutic outcome by blockade of
central dopaminergic and serotonergic pathways, however, APs are now
known to involve a wider range of receptor targets which may, at higher
doses, impart advantageous as well as deleterious behavioural (Putten et
al, 1991) and neurological sequelae (Wiklund et al., 2010). Indeed, it is
well established that at high doses, members of the typical class of APs,
such as the phenothiazine chlorpromazine (CPZ) can be cytotoxic for
different types of cell in culture (Dwyer et al., 2003) as well as inhibiting
the proliferation of both normal and cancer cells (Nordenberg at al 1999).
Whereas, other typical antipsychotics, which have different chemical
structures, such as haloperidol (HAL) a butyrophenone, still have a similar
clinical outcome as CPZ but do not, however, always have the same
neurotoxic effects that are associated with high dosages of phenothiazines
(Munyon et al.,1987; Galili-Mosberg et al., 2000).
The mechanisms that underlie AP neurotoxicity remain unclear. They may
be related to their direct actions as ligands on dopaminergic and
serotonergic receptors (McGrath and Neifeld, 1985), or indeed other
receptor classes such as sigma receptors (Vilner et al., 1995). Their
neurotoxicity may result from disruptive actions on mitochondria and
5
cellular cholesterol metabolism (Dujovne and Zimmerman, 1969; Wiklund
et al., 2010). However, any in-vivo appreciation of the neurological
functional sequelae of AP usage, whether with normal or overdosage is
confounded by the fact that the access of these drugs to the CNS and
their associated pharmacokinetics, are subject to the transport properties
of the blood brain barrier (BBB).
The BBB controls the transport of metabolites, drugs and chemicals
between the blood and brain compartments, in doing so it acts to both
protect, but also maintain, the interstitial environment of the CNS (Abbott
2013, Abbott et al 2010; Wilhem et al 2011). Anatomically, the structure
of the BBB comprises of a monolayer of brain micro-vascular endothelial
cells joined by tight and adherent junctions (Weiss et al., 2009; Abbott et
al 2010). This physical arrangement ensures that the endothelial cells act
to restrict the movement of microscopic particles (e.g. bacteria) and
hydrophilic molecules into the cerebrospinal fluid (CSF) (Bernas et al.,
2010; Abbott 2013, Abbott et al 2010). Once this barrier is breached, the
CNS is exposed to potential insult by hazardous solutes and pathogens
circulating in the blood (Abbott et al 2010). In fact the BBB is functionally
predisposed to prevent the entry of amphiphilic compounds such as APs
into the CNS, which raises the question as to the mechanism by which
these drugs actually gain access to the CNS and affect their therapeutic
action (Abbott 2013, Abbott et al 2010; Wilhem et al 2011). This is a
6
members of the ABC transporter family such as P-glycoprotein
(Cordon-Cardo et al., 1989; Abbott et al 2010) whose predominant function is to
actively pump amphiphilic compounds out of cells. One possible
mechanism by which APs accumulate in the CNS is that these drugs
inhibit, or are not substrates, for P-glycoprotein of the BBB endothelial
cells. Alternatively the membrane permeability of the APs may be
sufficiently high such that their passive influx exceeds the capacity of
P-glycoprotein to extrude them the . Another further mechanism by which
APs may gain access to the CNS is that the drugs themselves are cytotoxic
to the cells of the BBB with the resultant impairment in the barrier
function allowing them access to the CNS.
It is unknown is to what extent that AP, especially at dosages at the
higher end of their therapeutic window, affect the function of cells of the
BBB, a phenomena that will have consequences for transport of these
drugs across the BBB, their associated pharmacokinetics, as well as the
overall effect of APs on CNS function and their clinical outcome. APs, at
concentrations similar to those measured in the serum of highly dosed
patients, are already established to induce gross permeability changes in
the BBB; for example its permeability to FeCl3, mannitol and inulin are all
enhanced by acute administration of 5µM CPZ (Pardridge et al., 1973;
Ben-Shachar et al., 1994), a phenomenon indicative of a BBB breach at a
drug concentration similar to that occasionally measured in human serum
7
Since it is possible to isolate and culture the different cell types that
constitute the BBB (Bernas et al., 2010) the primary aim of this study was
to investigate the cellular and functional effects of two typical APs (CPZ
and HAL) and two atypical APs: risperidone (RIS) and clozapine (CLZ), at
the higher end of therapeutic levels, as well as those expected with over
dosage, on a model system of the BBB. In particular, we wished to
determine to what extent these drugs affect cell viability, programmed cell
death, barrier permeability and to investigate putative mechanisms behind
8
2. RESULTS
We first investigated the concentration dependence for the effect of two
typical (CPZ and HAL) and two atypical (RIS and CLZ) APs on the viability
of human brain microvascular endothelial cells (HBMECs).
2.1 Antipsychotics impair HBME cell viability
Figure 1 show the relationships between drug concentrations and
reduction of MTT and exclusion of trypan blue for HBMECs for 4 different
time points (4hrs, 24hrs, 48hrs and 72hrs). At concentrations of AP at 10
µM or less, all the drugs significantly inhibited the ability of the cell
population to reduce MTT relative to control (p<0.001, ANOVA). However,
even at concentrations in excess of 0.3-1mM and with extended
incubation times of 72hrs none of the drugs abolished MTT reduction, with
~ 20-30% of the cell population apparently resistant to the action of the
APs. The inhibitory effects of the APs on the cells ability to reduce MTT
were mirrored by a decreased ability of the cells to exclude trypan blue;
data which indicates that a loss of plasma-membrane integrity of the cells
is associated with their redox capability. For both the MTT and trypan blue
exclusion assays, the concentration-effect relationships for HAL and RIS
were best described by a monophasic relationship (equation 1, Fraction =
0). For CPZ and CLZ their concentration-effect relationships on MTT were
best described by a biphasic relationship (equation 1) with the IC50 for the
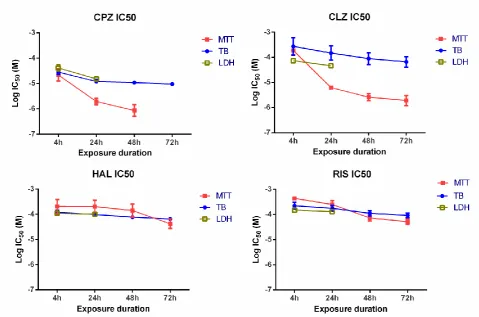
highest affinity components given in Figure 2. The fraction of the high
9
0.41, 95% CI) for CPZ and CLZ respectively. A monophasic equation (as
compared to a biphasic using the F-test) best described the relationship
between the concentrations of these drugs and the exclusion of trypan
blue. Over the 72hr incubation period neither the drugs nor vehicle control
produced a significant change in total cell count: cells excluding trypan
blue + cells containing trypan blue. This data inundates that the
proliferation rate of the cells was slow enough as not to be affected by the
time courses of the experimental paradigms employed.
For both RIS and HAL, a significant release of LDH (ANOVA) occurred at all
concentrations tested, with a greater release at higher concentrations
(data not shown). However, even after 24hrs incubation with either drug
at 1mM, only around 60% of the cell population released LDH; data again
indicative of a population of cells resistant to the cytotoxic effects of these
drugs. The concentration-effect relationship between either RIS or HAL
and the release of LDH was readily described by the monophasic form of
equation 1 with the IC50 given in Figure 2. CPZ and CLZ produced similar
effects on the release of LDH, with the data best described by the
monophasic form of equation 1 with the IC50s given in Figure 2.
Figure 2 clearly demonstrates that both CLZ and CPZ develop a greater
effect and potency with the MTT assay than on trypan blue exclusion at
prolonged exposure times; an observation that suggests that a decrease
10
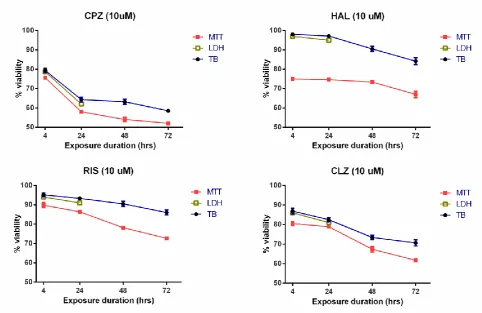
To further clarify the temporal effects of the APs, the relationships
between the percentage viability with 10µM of drug were plotted against
the time of exposure (Fig. 3). For all four APs tested, both MTT reduction
and TB were significantly and negatively correlated with incubation time
for a fixed drug concentration (r<-0.95, p<0.05 for all cases; Pearson
one-tailed). The greatest drug effect was always demonstrated with the
MTT assay (p<0.001, for each drug tested ANOVA); data again suggestive
that a decrease in cellular redox status precedes the loss of cell plasma
membrane integrity.
2.2 Antipsychotics condense chromatin
Cell visualised with transmission electron microscopy (TEM) revealed that
vehicle treated cells appeared normal (Fig. 4), whilst cells treated with
antipsychotics had degraded organelles, vacuolated cytoplasm, nuclear
breakdown, increased electron density and chromatin condensation;
observations consistent with apoptosis. Qualitatively, these apoptotic
effects appeared to be the most prominent in CPZ and CLZ treated cells,
but least in those treated with RIS and HAL. The induction of apoptosis by
the APs was supported by the observation of heterogeneous DAPI staining
of the nuclei. After 24hrs incubation at their EC50s for viability, the APs
led to ~50% of the nuclei to become heterogeneously stained: 50±2%,
51±0.3%, 46±2% and 46±0.5% for CPZ, HAL, RIS and CLZ respectively.
11
The TM and TD components of the Comet assay from cells treated with
vehicle or APs are shown in Figure 5. Although there was no significant
effect for any drug on the TM (ANOVA), the TD component was
significantly increased by 7.6% with CPZ (p<0.001; ANOVA) and 3.2%
with CLZ (p<0.01; ANOVA). Although we observed Gamma-Histone H2AX
staining within DAPI labelled nuclei with all treatments the actual amount
of staining, quantified by the number of immunofluorescent spots per cell,
was almost identical between the APs and the vehicle control (p=0.112,
Chi2 test; data not shown).
2.4 Antipsychotics and the cell cycle
There was no discernible effect of the APs on the number of cells in the
G0/G1 phase or the G2/G1 ratio of the cell cycle.
2.5 Antipsychotics activates Caspase-3, -8 and -9
Figure 6 shows, with the exception of RIS, the APs caused a significant
increase in the activity of Caspases-3, -8 and -9 relative to the vehicle
control (ANOVA).
2.6 Antipsychotics impair the transport properties of confluent
monolayers.
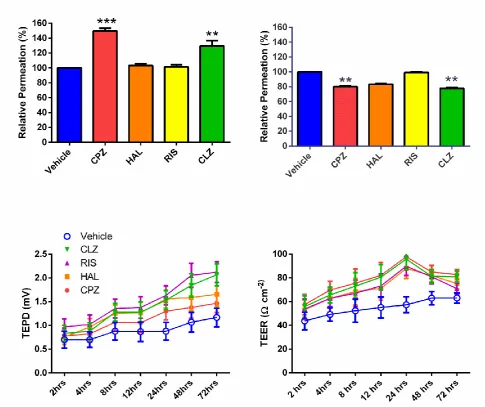
When applied for 72hrs at their EC50 concentration for viability, both CLZ
and CPZ greatly enhanced the permeability of Evans blue across HBMEC
monolayers (Fig. 7). In fact, an enhanced flux of Evans blue was observed
even after 2hr incubation with the drugs at these concentrations.
12
disruption of monolayer structure and continuity, data which suggests
these drug concentrations are too aggressive for the BBB to maintain
functionality. In response to this situation, the experiments were
repeated, but with the monolayers incubated at half the EC50 for each
respective AP. Under these conditions, the permeation of Evans blue after
72hr incubation with AP was significantly decreased by both CPZ and CLZ
(p<0.01, p<0.001 respectively; Kruskal Wallis Dunns multiple comparison
test to control) but not by RIS or HAL. Figure 7 shows that for both APs
and vehicle, both the TEER and TEPD significantly increased in magnitude
with incubation time (p<0.05 for TEER; p<0.01 for TEPD; Spearman Rank
correlation for all cases). Moreover all four APs significantly increased both
TEER (p<0.01 for all cases) and TEPD (p<0.01 for all cases with the
exception of CPZ p>0.05; Figure 7) relative to the values measured for
vehicle (2-way ANOVA, Dunnett's multiple comparison test in each
instance).
2.7 Antipsychotics cause oxidative stress.
Figure 8 illustrates that, with the exception of RIS, the APs, along with
antimycin A the positive control, at their lowest concentration tested
(<10µM) all significantly (p<0.001, ANOVA) increased oxidative damage,
indicative of ROS generation, relative to that produced with the vehicle
control. At their EC50s for cell viability, all four APs significantly increased
ROS generation relative to vehicle control (p<0.001, ANOVA). To
determine if the production of ROS and the resultant oxidative damage
13
of the HBMECs to the APs, cells were co-incubated with 10mM glutathione
(GSH); a reductant known to protect against oxidative stress and its
associated cellular damage. With the exception of CLZ, 10mM glutathione
significantly (p<0.05 in all cases, Unpaired t-test), but only partially,
reversed the decrease in MTT reduction produced by the APs at both the
lowest concentration tested and their EC50 concentration for viability.
However, in no case was 100% viability restored. 10mM glutathione also
reversed the DNA damage produced by CLZ at its EC50 for viability as
indicated by the Comet assay (Fig 5).
3. DISCUSSION
The primary aim of this study was to investigate the cellular and
functional effects of four antipsychotics (APs): two typical, CPZ and HAL,
and two atypical, RIS and CLZ, on a HBMEC model of the BBB, in
particular at concentrations similar to those seen with therapeutic over
dosage in man as well as those commonly used in animal models. At
concentrations of ~10µM and greater, all four drugs were found to
adversely affect HBMEC function, with CPZ and CLZ the most potent, HAL
and RIS lesser so. All four drugs impaired the ability of HBMECs to reduce
MTT, an effect paralleled by a loss of plasma membrane integrity with
increased uptake of trypan blue and leak of lactate dehydrogenase. At
their EC50 concentrations for these effects, all four APs disrupted cellular
ultrastructure and morphology. However, the same concentrations of
14
Comet assay, nor did they affect Gamma-Histone H2AX staining or the cell
cycle. HAL, CPZ and CLZ, but not RIS, did increase the activity of
Caspases -3, -8 and -9 as well as promoting chromatin condensation and
fragmentation, data indicative of apoptosis. These cytotoxic effects were
associated with changes in the transendothelial permeability and electrical
properties of a BBB model. The cytotoxic effects of these drugs were in
part mediated by oxidative stress since their action was partially blocked
with glutathione, a reductant well established to protect against oxidative
stress associated cytoxicity (Slater et al 1995).
Mechanisms of cytotoxicity
Phospholipidosis and bioenergetic impairment are two established
mechanisms by which antipsychotics induce cytotoxicity. Amphiphilic
compounds such as antipsychotics can promote phospholipidosis
(Halliwell, 1997), as well as interact directly with cell membrane sterols
(Dujovne and Zimmerman, 1969; Erik et al., 2010) either of which could
induce the cytotoxic changes we observed.
It is also well-established that antipsychotics can impair cellular
bioenergetics (Dwyer et al., 2005). These effects need not be secondary
to that of phospholipidosis; since, CPZ, HAL, RIS and CLZ are known to
affect mitochondrial function by an inhibition of Complex I of the electron
transport chain, with IC50’s of ~35µM for CPZ and HAL, ~65 µM for RIS
and >200µM for CLZ in isolated mitochondrial preparations (Burkhardt et
succinate-15
cytochrome C reductase activity as well as acting as a mitochondrial
uncoupler (Modica-Napolitano et al., 2003). Indeed the inhibition of
Complex I within neurons of the cortex by neuroleptics has previously
been proposed to partly explain the extrapyramidal symptoms seen with
this class of drugs (Maurer & Möller, 1997).
A consequence of mitochondrial function disruption is the induction of
apoptosis. The fact that in our study the APs led to nuclei heterogeneously
stained with DAPI, chromatin condensation, as well as degraded
organelles and vacuolated cytoplasm, supports an apoptotic rather than
necrotic mechanism of AP cytotoxicity. An idea also supported by the
ability of HAL, CPZ and CLZ, but not RIS, to activate the caspases -3, -8
and -9; enzymes whose activation is strongly associated with the
apoptotic cascade (Ola et al., 2011). RIS may induce apoptosis via a
non-caspase pathway.
The observation that the APs always had greater effect on MTT reduction
than on TBE; suggests the cytotoxic effect is initially precipitated by
impairment in the cellular redox status. This idea is consistent with a
mitochondrial target of the APs and is supported by the following
explanation of the conundrum as to why ~30-40% of any cell population
may be explained by the fact that cells at certain stages of the cell cycle
(Finkel and Hwang, 2009) are endowed with different metabolic profiles:
during the G1 phase, energy production occurs predominantly via
16
occurs predominantly by aerobic glycolysis (Schieke et al., 2008). Our cell
cycle analyses demonstrated that the populations of HBMECs we used
were not fixed at any particular stage of cell cycle but had cells in GO/G1,
S and G2. Since Complex I of the mitochondrial electron transport chain is
suggested to a major target for the APs we used, this notion implies that
cells in the S1 and G2 phases (~40% present study) whose metabolic flux
is predominantly glycolytic would be resilient to the cytotoxic effects of
these drugs, where as those in the G1\G0 phase of cell cycle (~60%
present study) would be prone. Since these percentages of cell cycle
phase are almost identical to the respective proportion of cells resilient
(~40%) or adversely affected (~60%) by the antipsychotics, is strong
evidence in support of the cell cycle phase and its associated bioenergetic
state affecting the cytotoxicity of antipsychotics in this HBMEC of the BBB.
Comparative potency of the antipsychotics
After 72hr exposure, CPZ had the most potent affect of the four APs on
MTT reduction, with an IC50 of <1µM (~1µM at 48hr) compared to 2µM for
CLZ, 48µM for HAL and 56µM for RIS. This data implies that, for CPZ and
CLZ at least, cytoxic effects of the BBB may occur with concentrations of
these AP at the higher end of their clinical therapeutic window: 300 ng/ml
(1µM) for CPZ and 700 ng/ml (2µM) for CLZ. The fact that the ability of
both CLZ and CPZ to inhibit MTT reduction was biphasic in nature suggests
that at least two sites of action exist for these two drugs. Interestingly the
17
and CLZ respectively are similar in magnitude to those estimated for HAL
and RIS; a finding which suggests that all four of these APs may share a
common, as yet undefined, low affinity target of action. When fitting the
biphasic relationship between MTT and the concentration of CPZ or CLZ it
was assumed that the fractional contribution of this component was
constant and it was the affinity, IC50, that changed with time. However, it
is more likely that the IC50 for the high affinity component is actually
constant and it is the fractional contribution of this component that
increased with time; an idea consistent with either intracellular
accumulation of the drug or\and the aggregation over time of its
molecular action. The observation that neither the loss of LDH or exclusion
of trypan blue did not have a high affinity component unlike MTT for either
CPZ or CLZ strongly suggests that the temporal decrease in MTT observed
with these two APs at low concentrations reflects a gradual impairment of
redox potential with drug exposure as demonstrated in figure 3 for these
two drugs. Whereas for HAL and RIS, who lack this high affinity
component, a higher concentration of drug is needed to do induce
cytotoxicity via the low affinity site which just happens to be just happens
to be the associated with a more rapid onset of action. The fact that
trypan blue exclusion, an indicator of cellular integrity, lags behind the
decrease in MTT by between 12 to 24 hours (fig.3) suggests that this is
the period of time it takes to complete the apoptotic pathway which
culminates in cell death and trypan blue uptake. Indeed similar length
18
described in other cellular systems e.g. 18hr for MPP + induced apoptosis
in neuroblastoma (Fall & Bennett 1999).
A similar ranked order of cytotoxic potency for these APs is reported for
the phaemocytochroma cell line, PC12 after 48hr exposure; with IC50s of
60 µM and 110µM for CPZ and CLZ respectively, and ~200µM for both RIS
and HAL (Dwyer et al., 2003). In endothelial cells of the human umbilical
vein (HUVECs) after 72hr exposure, CPZ was shown to be slightly less
cytotoxic with an IC50 of 25µM, whereas HAL had no effect up to 400 µM
(Wiklund et al., 2010). It thus appears that HBMECs are exquisitely
sensitive to CLZ and CPZ compared to HAL and RIS. Interestingly, the IC50
values for the cytotoxic effects of CPZ is similar to the value reported for
its direct inhibitory effect on the activity of Complex I in isolated rat brain
mitochondria: IC50 of <5µM (Rosenfeld et al., 2011). Together, this
evidence suggests that for CPZ to achieve a potency in HBMECs similar to
that observed for its inhibition of Complex I in isolated mitochondria the
drug must have easy access to the cytosol. Moreover, a predominantly
mitochondrial effect of these drugs explains why a decrease in redox
status, as monitored by the MTT assay, appears to be the primary event
in the cytotoxic cascade described here.
The generation of ROS with the production of oxidative stress and damage
is known to occur with agents that inhibit mitochondrial electron transport.
This fact is exemplified by our observation with Antimycin A which blocks
19
documented to lead to ROS production. Our findings support this notion
and indeed corroborate previous literature that demonstrates increased
oxidative stress by APs such as HAL and CPZ in the CNS in-vivo (Reinke et
al 2004). Elevated ROS can act as a trigger for apoptosis (Slater et al
1995) as well as having direct cytotoxic effects on a variety of cellular
proteins and processes. Our observation that exogenously supplied
glutathione partly alleviates the decrease in MTT observed with the APs,
as well as preventing DNA breakage as indicated by the Comet assay, is
strong evidence for a role for oxidative stress in the mechanism of AP
cytotoxicity. It is of note that only CPZ affected DNA breakage, an
observation that presumably relates to the fact that it was the most
potent drug studied.
One question is to how these drugs accumulate to high enough
concentrations to be mitochondrial poisons since endothelial cells of the
BBB possess members of the ABC transporter family such as
P-glycoprotein (Cordon-Cardo et al., 1989): proteins which act to pump
amphiphilic compounds, like APs out of the cell and in the case of
endothelial cells, out across the BBB (Hembury et al., 2008; Hemmelmann
et al., 2012). Our data suggests that the drugs we used are either not
transported by P-glycoprotein or they inhibit its activity. Alternatively,
these APs may possess passive membrane permeability so high such that
their rate of influx is larger than, and overwhelms that, of the
20
BBB models (Seelig, 2007). Although these APs at ~30µM can stimulate
the ATPase activity of P-glycoprotein and are perhaps substrates for
transportation (Boulton et al., 2002), the observation that at similar
concentrations they actually inhibit the ability of this protein to extrude
the amphiphilic molecule, RH123 from cells (Wang et al., 2006) strongly
suggest APs are in fact inhibitors of this particular ABC transporter. Such
an action will contribute to their relatively high potency of cytotoxicity due
to the inability of the cell to extrude them and prevent their intracellular
accumulation.
Another factor of consideration in the cellular dynamics of these drugs is
that they all have ionisation constants (pKa’s) > 7.4 (Lombardo et al.,
2004) which means they will accumulate in the relatively acidic
environment of the cytosol. Finally, all four drugs possess halogen
moieties within their molecular structures, a structural feature that
enhances their membrane permeability and potency (Gerebzoff et al
2004).
At their EC50’s for cell viability we have shown that the antipsychotics are
capable of severely disrupting cell integrity and function of endothelial
cells of the BBB. Even at concentrations within the upper range of
therapeutic doses, let alone overdose, a significant decrease in cell
viability was noted; affects exacerbated for CLZ and CPZ after an
extended period of incubation. The in-vivo consequences are numerous;
21
would make it leaky, not just to blood solutes and components with
ensuing extravasation (Pardridge et al., 1973; Ben-Schachar et al., 1994),
but also to the APs themselves with the various pathological consequences
this implies. Indeed, we have demonstrated that prolonged exposure at
high drug concentrations induce cytoxic actions on the HMBECs of the BBB
with a concomitant loss of its integrity and a subsequent inability to act as
a physical barrier to the passage of the drugs into the brain. Whereas at
the lower doses of APs we tested, more akin to those seen at the higher
therapeutically-relevant serum concentrations in man: 0.2-1µM for
CPZ,.15-2µM for CLZ, we saw an associated decrease in transepithelial
transport and enhanced transepithelial electrical resistance Since the
transcellular flux of Evans blue occurs via an energy-dependent
transcytosic process (Abbott 2013), its decrease with the lower doses of
CLZ and CPZ is consistent with the ability of these drugs to decrease the
energy state of the cells, as indicated by the MTT assay.
Regardless of whether the APs produce a breakdown in the endothelium of
the BBB, impair their bioenergetics or/and wreak oxidative stress damage,
any of these phenomena may contribute to the associated
neuropathologies observed with long term AP therapy such as neuroleptic
associated cerebral oedema (Jellinger 1977) and neuroleptic malignant
syndrome (Karagianis et al 1999). Since apoptosis was observed with
even the lowest concentrations of drug employed at the shortest
22
illicit catastrophic damage to the BBB. Whether over dosage with the APs
used within this study, or elevated levels outside their therapeutic window
affect the endothelial integrity of other microvasculature within the body
with its concomittant sequelue are unknown.
4. Experimental Procedure
Chemical and reagents. 3-(4,5-dimethylthiazol-2-yl)2,5-diphenyl
tetrazolium bromide (MTT) and DAPI were purchased from Promega
(Corp., Madison, Wisconsin, USA). CLZ was purchased from Abcam
(Cambridge, MA, USA). All other reagents, including CPZ, HAL and RIS
were purchased from Sigma-Aldrich (Poole, UK) unless stated otherwise.
All stock solutions of drugs were made in ethanol (vehicle).
4.1 Cells and tissue culture conditions
For this study we used primary human brain microvascular endothelial
cells (HBMECs), a fundamental element of the BBB. Cells were used from
passage 21-23 and were grown and maintained as previously described
(Elsheikha et al., 2013). When confluent, our HBMECs demonstrated an
endothelial morphology with features all typical of a functional
endothelium constructed from this cell type (Wong et al., 2004; Colgan et
al., 2008; Allen and Bayraktutan, 2009; Wilheml et al 2011):
transendothelial electrical resistances (TEER) of ~100Ωcm-2;
transendothelial potential differences (TEPD) of ~1mV; and an
23
was observed supports the idea that our monolayers were a homogenous
tight barrier with the absence of any gaps to produce an electrical
leakage, since these would dissipate the TEPD; even though the TEER
appear to be relatively low to those measured in other cellular (200Ωcm-2;
Wilhelm et al 2010) and ex-vivo (>1000Ωcm-2; Abbot et al 2010) models
of the BBB. Furthermore, the observation the monolayers significantly
decreased the passive flux of Evans blue across the transwell also argues
for a continuum of tight junctions between cells that limits paracellular
flux.
4.2 Cytotoxicity assays:
Fluorescent microscopy was conducted with a Leica DM5000 (Leica, B
Wetzlar, Germany) with images collected and processed with a Leica
DFC420 camera and Leica application suite v3.8 software. Since APs have
long half-lives, especially in the cases of overdose where their metabolism
is changed from 0th to 1st order kinetics (Ereshefsky, 1999), we
performed experiments at four different time points to mimic this: 4hrs,
24hrs, 48hrs and 72hrs post treatment. These longer time periods of
incubation were further warranted due to the time-dependence of AP
cytotoxicity, often taking at least 48hrs to achieve a maximum effect (Erik
et al., 2010). The lowest concentrations of CPZ and CLZ used in our
experiments are near to the top end of therapeutic serum levels for CPZ
and CLZ: 0.2-1µM (40-300 ng/ml) and 1-2µM (300-700 ng/ml)
24
~3µM for CPZ (~1000ng/ml; Van Putten et al 1991) and ~5µM for CLZ
(~1500ng/mL; Chang et al 1997). For HAL and RIS the lowest
concentrations of drugs used were about 70-80 times therapeutic serum
levels: 5-135nM (2-50ng/ml) for HAL and 50-160nM (20-65 ng/ml) for
RIS, although the lowest values we used in the present study are similar
to those measured in highly/over dosed individuals: ~ 0.7µM for HAL
(~270 ng/ml; Chang et al 1994) and for RIS ~0.5-0.8µM (~220 to 320
ng/mL ng/ml; Titier et al 2003, Nishikage et al 2002). We used these
higher concentrations to accelerate and evoke detectable effects of the
APs within the time frame of cell division as not to be confounded by
affects on cell proliferation. Furthermore, the concentrations used allowed
us to mimic overdose scenarios that are clinically experienced.
4.2.1 MTT assay
The MTT assay relies on cellular reduction of the MTT substrate to produce
a blue formazan product. As such it is a facile indicator of cell viability that
results from the product of cell number and redox status. For this assay
we followed the manufacturer protocol (CellTiter 96 Non-Radioactive Cell
Proliferation Assay; Promega, UK). Briefly, cells were seeded at 1x10⁴
cells per well in 96-well plastic plates (Nunc) and incubated overnight at
37°C under humidified 5% CO2 conditions. To assess chronic effects cells
were then incubated for a 4, 24, 48 or 72hrs in the presence of drug or its
vehicle. The original drug and vehicle measurements were corrected via
25
MTT absorbance value is expressed as a percent of the vehicle control
(defined as 100%). Each experiment was performed in triplicate, where n
represents the number of experiments (triplicates) performed.
4.2.2 Lactate dehydrogenase assay
Plates for this assay were prepared as for MTT, but with lysis by 2% Triton
X-100 the positive control. All measurements were corrected via
subtraction of a blank (media with reagents but without cells). Leakage of
LDH was calculated as a percentage of the Triton X-100 positive control.
Since LDH release was unaffected by vehicle we did not correct for it. Due
to degradation of LDH in the media over extended incubation times only 2
time points (4 and 24hrs) were assayed for its release. Each experiment
was done in triplicate, where n represents the total number of
experiments (triplicates) performed.
4.2.3 Trypan blue exclusion assay
To aid comparison with the MTT assay and determine the number of viable
cells we harvested both attached and floating cells for this assay. As the
vehicle did not affect the TBE assay we have not corrected for it. Results
are expressed as % viability compared to control. Each experiment was
done in triplicate per treatment, where n represents the number of
experiments (triplicates) performed.
26
To investigate nuclear/DNA toxic effects of the APs a variety of techniques
were used. For these protocols, drug treatment was achieved by
incubation of the cells for 24hrs at the EC50 concentration obtained from
the respective MTT assay for the APs tested: CPZ, 78µM; HAL, 330µM;
RIS, 300µM and CLZ, 153µM (see Figs. 1 & 2). For vehicle control, the
same volume of ethanol was added as used for drug.
4.3.1 Caspase Assay
To determine the pathway(s) by which APs, may induces apoptosis we
evaluated the activities of caspases 3, 8 and 9 after treatment with the
APs. These were determined using a BD ApoAlert caspase fluorescent
assay kits (Clontech Laboratories, Palo Alto, CA).
4.3.2 Ultrastuctural damage
Nuclear changes indicative of apoptosis were assessed by staining with
DAPI and measuring the proportion of cells with chromatin condensation
and nuclear fragmentation. Nuclei were considered to have a healthy
phenotype when their fluorescence was homogeneously bright, whereas
apoptotic nuclei were identified by condensed chromatin at their periphery
or a fragmented morphology. For analysis, at least 300 cells from 10
different fields of each treatment were counted and scored blind. Each
treatment was repeated at least 3 times. The number of the homogenous
27
experiment. Transmission Electron Microscopy (TEM) was also used to
study the structural integrity of cell nuclei.
4.3.3 Comet assay
The alkaline Comet assay is a sensitive method that can detect both single
and double stranded DNA breaks. Its “tail” parameters are the most
frequently used to describes DNA damage, with the tail moment (TM) and
tail DNA (TD) considered the most accurate markers of such damage (De
Boeck et al., 2000). After treatment with APs, cells were harvested in
ice-cold PBS and exposed to 30% ethanol. The infranatant was mixed with
agarose and plated onto slides. After lysis, the samples underwent
electrophoresis (30 minutes at 300 mA) and stained with propidium iodide
(1mg/ml). Cells were imaged by fluorescent microscopy at 546nm
excitation and 640nm emission. Images were analysed by Comet score IV
software (Perspective Instruments, UK).
4.3.4 Gamma-Histone H2AX
Gamma-Histone H2AX (γH2AX) is another marker for double stranded
DNA breaks (Lowndes and Toh, 2005). For γH2AX staining, cells were
grown on glass coverslips for 24 hrs and then treated with APs.
Inmunohistochemistry was performed with a Anti-H2AX mouse primary
antibody (phospho-Ser139, #05-636; Millipore, Billerica, MA) and an
AlexaFluor 594nM tagged fluorescent secondary antibody (Invitrogen,
28
dual excitation and emission filter pairs of 360nm and 470nm for DAPI,
and 546nm and 640nm for H2AX. A minimum of 100 nuclei per sample
were examined and the number of γH2AX foci per nuclei counted.
4.3.5 Cell cycle analysis
Cells were cultured in T25 flasks for 24 hrs and then treated. Both floating
and adherent cells were harvested and pelleted by centrifugation. DNA
content stained by propidium iodide was analysed by FACScan with
495nm excitation and 600nm emission (Beckman Coulter, High Wycombe,
UK). Data were analysed with Weasel software version 2.7.4 (Walter &
Eliza Analysis Software). Doublets and cellular aggregates are a common
problem of DNA analysis, where summation of the individual G1-phase
DNA contents is often recorded as a single event which leads to
overestimation of the G2/M population (Nunez, 2001). To overcome this
problem we only selected the area that contained single cells. These
experiments were repeated in triplicate.
4.4 Measurement of reactive oxygen species
We used the 3',7'-dichlorodihydrofluorescein diacetate (DCFDA) assay to
detect products of oxidative stress that result from the presence of
reactive oxygen species (ROS). Cells were cultured in 96-well plates and
treated for 24hrs with APs at either at its EC50 for viability or the lowest
concentration tested. Cells were then washed with PBS and incubated with
29
vehicle control, Antimycin A (10µM for 30 minutes) as the positive control
and wells with non-stained cells were used as blank. Cells were then
washed with PBS and their emitted fluorescence at 535nm measured with
485nm excitation. The drug and vehicle measurements were corrected via
subtraction of the blank. The oxidative products due to thepresence of
ROS are expressed as a percent of the vehicle control (defined as 100%).
Each experiment was performed in triplicate, where n represents the
number of experiments (triplicates) performed.
4.5 Functional assays
To assess the functional outcome of the antipsychotics and also to confirm
that our HBMEC cultures suitably modelled the transport properties of the
BBB endothelium, we utilized three assays of endothelial function:
transcellular transport of Evans blue, transendothelial electrical resistance
(TEER) and transendothelial potential difference (TEPD). For these studies,
cells were grown to confluence on semi permeable membrane 24-well
inserts (area 0.6 cm2; Millicell, Millipore Corporation). Cells were incubated
with APs for 72hrs at either the full or half of the respective MTT EC50
concentration. For controls, wells with confluent cells were incubated with
either vehicle alone or with just media with no additions. To assess the
transcellular permeability, Evans blue (0.05 mg ml-1) labelled albumin
(4%) was added to the culture media in the well insert. The passage of
labelled albumin across the monolayer was determined by the increase in
30
To measure the TEER and TEPD of the endothelial monolayer, we used a
WPI EVOM resistance meter (WPI, UK). This was prepared and calibrated
in accord with the manufacturer’s instructions. Controls with wells but
without cells did not restrict the movement of Evans Blue nor did they
possess a TEPD. However, blank wells do have a TEER which is in series
with that of the monolayer, this was corrected for by subtraction.
4.6 Statistical analysis
The D’Agostino-Pearson omnibus normality test was always sused to
check if data was Gaussian distributed. For multiple comparisons on
Gaussian distributed data, one way ANOVA test was used with either
Tukey’s multiple comparisons or Dunnett’s multiple comparisons
post-tests, whereas for non-normal data Kruskall Wallis test with Dunnett’s
multiple comparisons post-test was used; for counts, Chi2 was used.
Either Pearson r or Spearman Rank was used to correlate variables
depending on the data type and its statistical distribution.
Concentration-response relationships were constructed from single
concentration experiments. The concentration-response relationships were
quantified by fitting the data with the following biphasic equation:
Y = Span x Fraction + Span x (1-Fraction)
31
Where Y is the magnitude of drug effect normalised as a percentage of the
control effect; [D] is the concentration of drug; IC50_i is the drug
concentration that produces half-maximal effect (50%) and h_i is an index
of slope; for high affinity sites, i=1, and for low affinity sites, i=2. Span is
the range of the drug effect (Maximum - minimum) and Fraction is the
relative proportion of the concentration relationship described by the high
affinity component. For the situation where only a monophasic, low
affinity, relationship was observed, Fraction was set to zero. The IC50
values are quoted with 95% confidence intervals. When data was best
described by a monophasic relationship, the EC50 of the effect is equal to
the IC50, however, when the data was best described by a biphasic
relationship the EC50 of the effect was measured empirically.
These procedures were all performed using PRISM 6 (GraphPad Software
Inc., San Diego, CA). Statistical significance is defined as P <0.05, and is
indicated in the figures as *** for p<0.001, ** for p<0.01 and * for
p<0.05.
ACKNOWELDGEMENTS
Financial support to EE was provided by the Ministry of Higher Education
32
FIG. 1. Concentration-effect relationships for the effect of chlorpromazine (CPZ), haloperidol (HAL), risperidone (RIS) and clozapine (CLZ) on the reduction of MTT and exclusion of trypan blue (TBE). Data is measured at 4 different time points (, 4 hr; , 24hr; , 48hr and , 72hr), and is corrected for vehicle and
33
FIG. 2. The effect of incubation time (exposure duration) on the IC50 values determined for the reduction of MTT (), uptake of trypan blue () and release
of LDH (), for the four different antipsychotics as indicated. Data is shown as
[image:33.595.74.554.73.390.2]34
FIG. 3. Time courses of HBMEC viability measured with three different assays for the four APs all at 10µM. The least viability was demonstrated with the MTT assay (), followed by LDH () and trypan blue exclusion (). Data are shown
35
36
FI G. 5. Tail parameters determined from the Comet test (alkaline method) for HBMECs of BBB after 24hr incubation with antipsychotics. Top panels, comparison of tail moment (left panel) and tail DNA (right panel) for the four antipsychotics indicated at their EC50 for viability. Note that only CPZ elicited DNA breakage. Lower panels, comparison of tail moment and tail DNA for CPZ at its EC50 for viability, in the presence and absence of 10mM glutathione (GSH). Note how 10mM glutathione protects against DNA breakage by CPZ. Also shown is the effect of the positive control for DNA brakeage, 25 µM H202 for 1hr. Statistical significance is all relative to vehicle control. Data is shown as means (± S.E.M;
37
38
FIG. 7. Top panels: Permeation of Evans blue across endothelial monolayers relative to vehicle control after 72hr incubation at the viability EC50 (left) and half that value (right) for the APs indicated. Statistical significance is relative to vehicle control. Values are means ± S.E.M (n=5). Bottom two panels: The relationships between the effects of antipsychotics on the transendothelial potential difference (TEPD) and transendothelial electrical resistance (TEER) of HBMECs as a function of incubation time: Vehicle (), CLZ (), RIS (), HAL () and CPZ (). Cells were incubated at half the viability IC50 for the APs
[image:38.595.72.558.74.481.2]39
[image:39.595.75.553.73.443.2]40
REFERENCES
Abbott, N. J. (2013). Blood–brain barrier structure and function and the
challenges for CNS drug delivery. Journal of inherited metabolic disease,
36, 437-449..
Abbott, N. J., Patabendige, A. A., Dolman, D. E., Yusof, S. R., & Begley, D.
J. (2010). Structure and function of the blood–brain barrier. Neurobiology
of disease 37, 13-25.
Allen, C. L., and Bayraktutan, U. (2009). Antioxidants attenuate
hyperglycaemia-mediated brain endothelial cell dysfunction and
blood-brain barrier hyperpermeability. Diabetes Obes. Metab. 11, 480-490.
Ben-Shachar, D., Livne, E., Spanier, I., Leenders, K.L., and Youdim, M.B.
(1994). Typical and atypical neuroleptics induced alteration in blood-brain
barrier in brain 59FeCl3 uptake. J.Neurochem. 62, 1112-1118.
Bernas, M. J., Cardoso, F. L., Daley, S. K., Weinand, M. E., Campos, A. R.,
Ferreira, A. J. G., and Brito, M. A. (2010). Establishment of primary
cultures of human brain microvascular endothelial cells to provide an in
vitro cellular model of the blood-brain barrier. Nature Protoc. 5(7),
1265-1272.
Boulton, D. W., DeVane, C. L., Liston, H. L., and Markowitz, J. S. (2002).
In vitro P-glycoprotein affinity for atypical and conventional
41
Burkhardt, C., Kelly, J. P., Lim, Y. H., Filley, C. M., and Parker, W. D.
(1993). Neuroleptic medications inhibit complex I of the electron transport
chain. Ann.Neurol., 33(5), 512-517.
Chang, W. H., Shieh, Y. S., Liu, H. C., Jann, M. W., & Chien, C. P. (1994).
Plasma reduced haloperidol/haloperidol ratios in schizophrenic patients
treated with high dosages of haloperidol. European
Neuropsychopharmacology, 4(2), 119-126.
Chang, W. H., Lin, S. K., Lane, H. Y., Hu, W. H., Jann, M. W., & Lin, H. N.
(1997). Clozapine dosages and plasma drug concentrations. Journal of the
Formosan Medical Association 96(8), 599.
Colgan, O. C., Collins, N. T., Ferguson, G., Murphy, R. P., Birney, Y. A.,
Cahill, P. A., and Cummins, P. M. (2008). Influence of basolateral
condition on the regulation of brain microvascular endothelial tight
junction properties and barrier function. Brain Res. 1193, 84-92.
Cordon-Cardo, C., O'Brien, J. P., Casals, D., Rittman-Grauer, L., Biedler, J.
L., Melamed, M. R., and Bertino, J. R. (1989). Multidrug-resistance gene
(P-glycoprotein) is expressed by endothelial cells at blood-brain barrier
sites. Proc. National Acad. Sci. 86(2), 695-698.
De Boeck, M., Touil, N., De Visscher, G., Vande, P. A., and Kirsch-Volders,
M. (2000). Validation and implementation of an internal standard in
42
Dudani, A.K., and Gupta, R.S. (1987). Effect of chlorpromazine and
fluoperazine on cytoskeletal components and mitochondria in cultured
mammalian cell. Tissue Cell 19, 183–196.
Dujovne, C.A., and Zimmerman, H.J. (1969). Cytotoxicity of
phenothiazines on Chang liver cells as measured by enzyme leakage.
Proc. Soc. Exp.Biol. Med. 131, 583–587.
Dwyer, D.S., Lu, X.H., and Bradley, R.J. (2003). Cytotoxicity of
conventional and atypical antipsychotic drugs inrelation to glucose
metabolism. Brain Res. 971:31–39.
Dwyer, D.S., Donohoe, D., Lu, X.H., and Aamodt, E.J. (2005). Mechanistic
connections between glucose/lipid disturbances and weight gain induced
by antipsychotic drugs. Int. Rev. Neurobiol.65,211–247.
Elsheikha, H. M., McKinlay, C. L., Elsaied, N. A., and Smith, P. A. (2013).
Effects of Neospora caninum infection on brain microvascular endothelial
cells bioenergetics. Parasites & vectors 6(1), 24.
Ereshefsky, L. (1999). Pharmacologic and pharmacokinetic considerations
in choosing an antipsychotic. J. Clin. Psychiatry 60 Suppl 10:20-30.
Fall, C. P., & Bennett, J. P. (1999) Characterization and time course of
MPP+induced apoptosis in human SH-SY5Y neuroblastoma cells. Journal of
43
Finkel, T., and Hwang, P. M. (2009). The Krebs cycle meets the cell cycle:
Mitochondria and the G1–S transition. Proc.National. Acad.Sci. USA
106(29), 11825-11826.
Galili-Mosberg, R., Gil-Ad, I., Weizman, A., Melamed, E., and Offen, D.
(2000). Haloperidol-induced neurotoxicity-possible implications for tardive
dyskinesia. J. Neural Transm. 107, 479–490.
Gerebtzoff, G., Li‐Blatter, X., Fischer, H., Frentzel, A., & Seelig, A. (2004).
Halogenation of drugs enhances membrane binding and permeation.
ChemBioChem, 5(5), 676-684.
Halliwell, W.H. (1997). Cationic amphiphilic drug-induced
phospholipidosis. Toxicol.l Pathol. 25(1), 53-60.
Hemmelmann, M., Metz, V. V., Koynov, K., Blank, K., Postina, R., and
Zentel, R. (2012). Amphiphilic HPMA-LMA copolymers increase the
transport of Rhodamine 123 across a BBB model without harming its
barrier integrity. J. Control. Release 163, 170-177.
Hembury, A., and Mabondzo, A. (2008). Endothelin-1 reduces
P-glycoprotein transport activity in an in vitro model of human adult blood–
brain barrier. Cell. Mol. Neurobiol. 28(7), 915-921.
Jellinger, K. (1977). Neuropathologic findings after neuroleptic long-term
therapy. Neurotoxicology, 25.
Karagianis, J. L., Phillips, L. C., Hogan, K. P., & LeDrew, K. K. (1999).
44
a review of the literature. The Annals of pharmacotherapy, 33(5),
623-630.
Lombardo, F., Obach, R. S., Shalaeva, M. Y., & Gao, F. (2004). Prediction
of human volume of distribution values for neutral and basic drugs. 2.
Extended data set and leave-class-out statistics. J. Med. Chem, 47(5),
1242-1250.
Lowndes, N. F., and Toh, G. W. (2005). DNA repair: the importance of
phosphorylating histone H2AX. Curr. Biol. 15(3), 99-102.
Maurer, I., & Möller, H. J. (1997). Inhibition of complex I by neuroleptics
in normal human brain cortex parallels the extrapyramidal toxicity of
neuroleptics. In Detection of Mitochondrial Diseases (pp. 255-259).
Springer US.
McGrath P. C., and Neifeld J. P. (1985) Inhibition of human
neuroblastoma by dopamine antagonists. Surgery 98, 135–141.
Miyamoto S, Duncan G. E, Marx C. E, and Lieberman J. A. (2005).
Treatments for schizophrenia: a critical review of pharmacology and
mechanisms of action of antipsychotic drugs. Mol. Psychiatry 10,79–104.
Modica-Napolitano, J. S., Lagace, C. J., Brennan, W. A., and Aprille, J. R.
(2003). Differential effects of typical and atypical neuroleptics on
45
Munyon W.H., Salo R., and Briones D.F. (1987). Cytotoxic effects of
neuroleptic drugs. Psychopharmacology 91, 182–188.
Nishikage, H., Nakanishi, T., Takamitsu, Y., & Yamamoto, J. (2002).
Sequential changes in the plasma concentration of risperidone following
intentional overdose. Clinical neuropharmacology, 25(6), 307-309.
Nordenberg, J., Fenig, E., Landau, M., Weizman, R., and Weizman, A.
(1999). Effects of psychotropic drugs on cell proliferation and
differentiation. Biochem.Pharmacol. 58(8), 1229-1236.
Nunez, R. (2001). DNA measurement and cell cycle analysis by flow
cytometry. Curr. Issues Mol. Biol. 3, 67-70.
Ola, M. S., Nawaz, M., and Ahsan, H. (2011). Role of Bcl-2 family proteins
and caspases in the regulation of apoptosis. Mol. Cell. Biochem. 351(1),
41-58.
Pardridge, W. M., Crawford, I. L., and Connor, J. D. (1973). Permeability
changes in the blood-brain barrier induced by nortriptyline and
chlorpromazine. Toxicol. Appl. Pharmacol. 26(1), 49-57.
Reinke, A., Martins, M. R., Lima, M. S., Moreira, J. C., Dal-Pizzol, F., &
Quevedo, J. (2004). Haloperidol and clozapine, but not olanzapine,
induces oxidative stress in rat brain. Neuroscience letters, 372(1-2),
46
Rosenfeld, M., Brenner-Lavie, H., Ari, S. G. B., Kavushansky, A., &
Ben-Shachar, D. (2011). Perturbation in mitochondrial network dynamics and
in complex I dependent cellular respiration in schizophrenia. Biological
psychiatry. 69(10), 980-988.
Schieke, S. M., McCoy Jr, J. P., and Finkel, T. (2008). Coordination of
mitochondrial bioenergetics with G1 phase cell cycle progression. Cell
Cycle 7(12), 1782-1787.
Seelig, A. (2007). The role of size and charge for blood–brain barrier
permeation of drugs and fatty acids. J. Mol. Neurosci. 33(1), 32-41.
Titier, K., Bouchet, S., Pehourcq, F., Moore, N., & Molimard, M. (2003).
High-performance liquid chromatographic method with diode array
detection to identify and quantify atypical antipsychotics and haloperidol in
plasma after overdose. Journal of Chromatography B, 788(1), 179-185.
Slater, A. F., Stefan, C., Nobel, I., & Van Den Dobbelsteen, D. J. (1995).
Signalling mechanisms and oxidative stress in apoptosis. Toxicology
letters, 82, 149-153.
Van Putten, T., Marder, S. R., Wirshing, W. C., Aravagiri, M., & Chabert,
N. (1991). Neuroleptic plasma levels. Schizophrenia bulletin, 17(2),
197-216.
Vilner, B. J., de Costa, B. R., and Bowen, W. D. (1995). Cytotoxic effects
of sigma ligands: sigma receptor-mediated alterations in cellular
47
Wang, J. S., Zhu, H. J., Markowitz, J. S., Donovan, J. L., and DeVane, C.
L. (2006). Evaluation of antipsychotic drugs as inhibitors of multidrug
resistance transporter P-glycoprotein. Psychopharmacology 187(4),
415-423.
Weiss, N., Miller, F., Cazaubon, S. and Couraud, P.O. (2009). The blood–
brain barrier in brain homeostasis and neurological diseases. Biochem.
Biophys. Acta 1788, 842–857.
Wiklund, E. D., Catts, V. S., Catts, S. V., Ng, T. F., Whitaker, N. J., Brown,
A. J., and Lutze-Mann, L. H. (2010). Cytotoxic effects of antipsychotic
drugs implicate cholesterol homeostasis as a novel chemotherapeutic
target. Int. J. Cancer 126(1), 28-40.
Wilhelm, I., Fazakas, C., & Krizbai, I. A. (2011). In vitro models of the
blood-brain barrier. Acta Neurobiol Exp (Wars), 71(1), 113-128.
Wong, D., Dorovini-Zis, K., and Vincent, S. R. (2004). Cytokines, nitric
oxide, and cGMP modulate the permeability of an in vitro model of the