Tuning a Multiple Classifier System for Side Effect Discovery using
Genetic Algorithms
Jenna M. Reps, Uwe Aickelin and Jonathan M. Garibaldi
Abstract— In previous work, a novel supervised framework implementing a binary classifier was presented that obtained excellent results for side effect discovery. Interestingly, unique side effects were identified when different binary classifiers were used within the framework, prompting the investigation of applying a multiple classifier system. In this paper we investigate tuning a side effect multiple classifying system using genetic algorithms. The results of this research show that the novel framework implementing a multiple classifying system trained using genetic algorithms can obtain a higher partial area under the receiver operating characteristic curve than implementing a single classifier. Furthermore, the framework is able to detect side effects efficiently and obtains a low false positive rate.
I. INTRODUCTION
S
IDE EFFECTS of prescription drugs are a common occurrence that often lead to patient morbidity and mortality. When there is an association between a medical event (e.g., sickness, rash and weakness) and a drug, this is termed an adverse event (AE). When the relationship is proven to be causal (i.e., the drug causes the medical event), it is referred to as an adverse drug reaction (ADR).As a large quantity of medical data are often stored in databases, numerous methods have been presented that make use of medical databases with the aim of identifying ADRs efficiently [1], [2]. Unfortunately, the majority of these methods work by finding medical events that are highly associated to a drug, therefore, rather than detecting ADRs they detect AEs. This has lead to the methods having high false positive rates [3], [4] as the majority of associations are not causal. Recent research has focused on using super-vised techniques such as logistic regression [5] to reduce the impact of confounding (i.e., when a hidden variable is responsible for the association). These supervised methods aim to distinguish between associations that are causal or non-causal by finding alternative causes of the medical event. Unfortunately, this requires generating a large number of regression models and also requires additional knowledge of possible confounders (e.g., other possible causes of the medical event). Consequently, these methods are often slow and dependant on current knowledge. Alternatively, a recent framework, side effect classifier (SEC), has been proposed that applies a single supervised classifier to identify ADRs efficiently [6] and the results suggest this framework is less susceptible to confounding.
Jenna M. Reps, Uwe Aickelin and Jonathan M. Garibaldi are with the School of Computer Science, The University of Nottingham, UK (email:
{jenna.reps, uwe.aickelin, jonathan.garibaldi}@nottingham.ac.uk).
The SEC framework generates attributes inspired from the Bradford Hill causality criteria [7], a collection of factors that are often considered to determine causality, and uses these attributes and knowledge of existing ADRs to train a classifier capable of identifying new ADRs. The framework was shown to identify ADRs with a low false positive rate and is highly efficient once the classifier is trained. Different binary classifiers can be implemented within the framework, depending on the quantity of labelled data (this depends on the current knowledge of ADRs). It was noticed that the SEC framework implementing a different binary classifier will in general detect different ADRs, suggesting there is diversity between the classifiers. Inspired by this diversity, in this paper we investigate whether using a type of ensemble, called a multiple classifier system, that combines predictions obtained from multiple classifiers is better than using a single classifier’s prediction within the framework. The multiple classifier system classifies each data-point corresponding to a drug-medical event pair as an ADR or non-ADRs based on a weighted combination of each individual classifiers confidence of the data-point belonging to the ADR class. The weights are determined by using genetic algorithms to search for the values that optimise the SEC framework’s ability to detect ADRs.
This paper continues are follows. The next section gives an overview of genetic algorithms, multiple classifier systems and pharmacovigilance, including the SEC framework. In section III, we described the longitudinal medical database used in this research, known as The Health Improvement Network (THIN) database (www.thin-uk.com), and highlight current issues with the data. Section IV describes the genetic algorithm method used to determine the classifier weights implemented by the multiple classifier system. The results of the framework implementing the trained multiple classifier system is compared with the individual classifiers’ results and are presented and discussed in section V. The paper finishes with the conclusions in section VI.
II. BACKGROUND
A. Genetic Algorithms
Fig. 1. The schema of a multiple classifier system.
solutions are created by recombination and mutation of the previous candidate solutions’ genotypes based on their fitness.
B. Multiple Classifier System
The term ensemble is used to describe a composition of multiple classifiers. A type of ensemble that consists of a composition of various different classifiers has frequently been termed a multiple classifier system [9] rather than called an ensemble. This is to help distinguish between a combination of the same classifier trained with different perspectives (e.g., combining decision trees that are trained using different independent variables) and a combination of different classifiers (e.g., combining a SVM, a random forest, a neural network and a logistic regression model). Fig. 1 illustrates a multiple classifier system that combines the out-put of multiple single classifiers to generate a single outout-put. The aim of a multiple classifier system is the take advantage of diversity between classifiers to improve the classifying accuracy while maintaining efficiency. Multiple classifier systems have been successfully implemented in numerous machine learning tasks including diagnosing melanoma [10], classifying breast lesions [11] and detecting naked bodies in images [12]. In the previous examples, combining multiple classifiers, under a suitable weighting scheme, was shown to improve performance compared to a single classifier.
As the classifiers used to identify ADRs within the SEC framework appear to be diverse, implementing a multiple classifier system that combines all the classifiers may im-prove the detection of ADRs.
C. Previous Pharmacovigilance
[image:2.612.69.285.69.204.2]Pharmacovigilance is the study of prescription drug side effects. One important part of pharmacovigilance is the process of detecting drug side effects after the drugs have been approved and marketed. Identifying drug side effects is a difficult task due to the majority of side effects relying on multiple factors, so it is common for some side effects to be observed rarely. Clinical trails are unable to identify the majority of side effects prior to marketing due to them only involving a small number of patients and being conducted
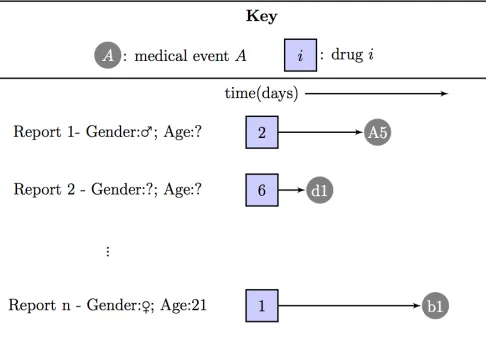
Fig. 2. An example of an SRS database entity relationship diagram
Fig. 3. Illustration of how the reports in the SRS database contain direct links between drugs and medical events. Each report within the database consists of an observation of a patient taking a drug and then experiencing the medical event sometime after.
under unrealistic conditions [13]. For example, patients in-volved in clinical trials are unlikely to take other drugs during the trial, so drug interactions can not be analysed.
In general, the most widely implemented pharmacovigi-lance techniques have been developed for a specific type of medical database known as the spontaneous reporting system (SRS) databases [14]. These databases consist of all the reports made by medical staff or the general public relating to a suspected ADR. The general design of the SRS databases is illustrated in Fig. 2. The SRS databases contain natural links between drugs and medical events, see Fig. 3. Sometimes additional information about the patient is included into the report, such as age and gender, but this is not compulsory. The techniques for detecting ADRs look for medical events linked disproportionally more to the drug than expected [15]. Unfortunately, due to the reporting being voluntary, many ADRs may not be reported, and it is possible that some rare ADRs may never be noticed. This under-reporting can prevent the early detection of ADRs and this means patients are put at risk for longer. In addition, there are known data quality issues such as missing, duplicated or incorrect data [16].
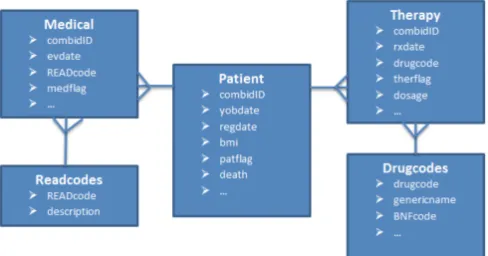
[image:2.612.316.559.240.409.2]health-Fig. 4. An example of a longitudinal healthcare database entity relationship diagram
care databases. These databases contain medical information about patients often spanning many years and it is common for them to contain records for millions of patients. As this type of database does not rely on voluntary reporting, it presents a unique perspective for signalling ADRs. However, it has been shown to suffer from different limitations. The main limitation is that there are no clear links between drugs and medical events within the data itself, so potential links are inferred by finding the medical events that occur shortly after the drug in time. This is illustrated in Fig. 5. Unfortunately, the majority of the drug and medical events linked by time are associated but do no correspond to ADRs, and it has proved difficult for unsupervised algorithms to distinguish between the non-causal and causal relationships. In [18], the authors presented a semi-supervised algorithm that requires a user to input a drug of interest and then returns a ranked list of medical events. The higher a medical event is ranked by the algorithm, the more likely that medical event corresponds to a rare ADR of the specified drug of interest. The algorithm generated the data by extracting attributes that are insightful for ADR detection from a longitudinal healthcare database and determined labels for some medical events by mining online medical websites. The labelled and unlabelled data were then used to clusters similar medical events into either an ADR cluster, an indicator (a cause of taking the drug) cluster or a noise cluster. Medical events assigned to the noise cluster were filtered, and the remaining medical events where ranked based on how often they occurred after the drug divided by how often they occurred before the drug multiplied by a cluster dependent weight.
The success of the semi-supervised algorithm them prompted the idea of generating causal inference based attributes for a selection of drug-medical event pairs that are definitively known ADRs or non-ADRs [19] and using this data to train a classifier that can then be used to pre-dict new ADRs. One such supervised framework generated attributes based on the counterfactual theory of causality [20], whereas another framework, SEC, generated attributes based on the Bradford Hill causality criteria. Rather than mining online forums for the known ADR and non-ADR labels, both frameworks used an online resource that contains
lists of ADRs that were mined from drug packaging. Both supervised frameworks demonstrated excellent performance and previous results suggest supervised techniques may help improve current pharmacovigilance.
1) SEC Framework: The previously presented SEC framework is a supervised algorithm for detecting ADRs. The algorithm automates the technique of inferring causality via the Bradford Hill causality criteria, as this technique is commonly applied to assess whether a side effect is caused by a drug or not. The SEC framework requires three steps. The first step is data generation where suitable labelled data are extracted for each drug-medical event pair that represent a possible acute ADR. The second step is training a binary classifier using the labelled data to classify each drug-medical event pair as an ADR or non-ADR, and the final step is applying the trained classifier to new unlabelled data.
Step 1) Data generation
As we are interesting in detecting acutely occurring ADRs, we find the drug-medical event pairs that are possible ADRs by investigating the medical events that occur within a month of a drug being prescribed. To train a binary classifier we need a set of attribute vectors xi ∈ Rn and their
corresponding class yi ∈ {−1,1}. In the SEC framework,
each data point corresponds to a drug-medical event pair of interest, where the ith drug-medical event pair has the attribute vector xi and class yi. Therefore, to generate the
training data, the first step is to identify the drug-medical event pairs of interest, the second step is to determine their labels and the final step is to calculate their attributes.
To identify the drug-medical events pairs of interest, we restrict out attention to a set of specified drugs, denoted by D. For each drug di ∈ D, we use temporal relationships
to identify the risk medical events of di (RM Edi). The
risk medical events of di are the medical events that were
observed during the month after a prescription of di for one
or more patients, RM Edi ={medical events| the medical
event occurs within a month ofdifor one or more patients}.
The drug-medical event pairs of interest are all the possible combinations of d-e, where d ∈ D and e ∈ RM Ed. The
drug-medical event pairs of interested with labels are then determined. For the ithdrug-medical event pair, if the medical event is labelled as a known side effect of the drug within the online drug resource known as SIDER [21], then the pair is labelled as an ADR (yi = 1). Alternatively, if the
medical event cannot possibly correspond to an acute ADR (e.g, the medical event is ‘cancer’, ‘menopause’ or ‘death of family member’), the drug-medical event is labelled as a non-ADR (yi =−1). Any drug-medical event pair neither listed
on SIDER as corresponding to a known ADR nor clearly a non-ADR is ignored as the pair has no definitive label.
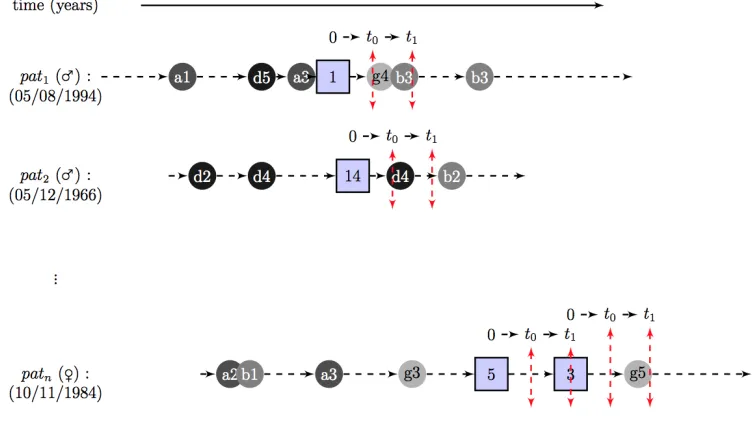
[image:3.612.57.301.83.211.2]Fig. 5. An example of inferring a link between a drug and medical event within a longitudinal healthcare database. The medical events are represented by circles and the drugs represented by squares. The potential acute ADRs are the medical events observed during the [t0,t1] time period centred around the prescription.
from a selection of the Bradford Hill causality criteria:
• Association strength: How strong the association
be-tween the drug and medical event is.
• Temporality:Does the drug precede the medical event
or the other way?
• Specificity:How specific the medical event is, or how similar patients experiencing the medical event are. item
Biological gradient:Measures whether the probability of the medical event increases as the drug dosage increases.
• Experimentation:Does the medical event start and stop when the drug starts and stops?
In summary, for the ith labelled drug-medical event pair we have (xi, yi), where xi is the Bradford Hill causality
attributes andyi= 1when theithdrug-medical event pair is
a known ADR andyi=−1when theithdrug-medical event
pair is a known non-ADR. The complete set of labelled data is denoted byX, whereX ={(xi, yi)}.
Step 2)Training a binary classifier
The labelled data are then used to train a binary classifier (the choice of classifier is determined by the user as any classifier can be used within the framework),
f :X →Y;f(xi)→ {−1,1} (1)
where f(xi) = −1 means the drug-medical event pair is classified as a non-ADR and f(xi) = 1 means the drug-medical event pair is classified as an ADR. The chosen classifier is trained using ten-fold cross validation to reduce overfitting. In previous work [6], the random forest classifier was found to perform better than a support vector machine, a logistic regression and a naive Bayes classifier.
Step 3)Applying trained classifier
The trained classifier is then applied to the attribute vectorx∗
for a new drug-medical event pair, and the prediction f(x∗)
is returned.
For evaluating the framework, the labelled data are par-titioned into training/testing data and validation data. The training/testing data are used to train the classifier and the validation data are used to evaluate the performance of the trained classifier by comparing the predicted class with the true class.
III. MATERIALS
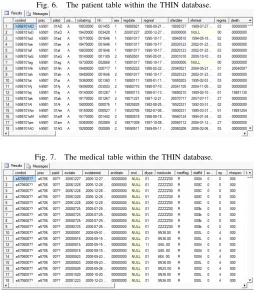
The THIN database contains temporal medical data for over 11 million patients (approximately 4 million currently active patients). The data is anonymised, so each patient is represented by a unique patient ID rather than the patients real name. There are three main tables within the THIN database, the patient table, the medical table and the therapy table, see Figs. 6-8. The patient table contains personal information about each patient in the database including their year of birth, their gender and their date of registration. The therapy table contains timestamped records of each patient’s drug prescription history, so each record includes the patient ID, the date of the prescription and information about the prescription (drug details and dose details). The medical table is similar to the therapy table but contains timestamped records of each patient’s medical event history (i.e., illnesses, diseases, laboratory tests and administrative events), so a typical record contains the patient ID, the date of the medical event and the medical event information, recorded via the READ codes.
Fig. 6. The patient table within the THIN database.
Fig. 7. The medical table within the THIN database.
the minimum path from the node to the root. Unfortunately, the READ codes have redundancies and the same medical event can be represented by various distinct READ codes. This can cause issues for data miners, however the SEC algorithm generates attributes specifically to prevent this issue having a negative effect on its ability to detect ADR.
IV. METHODOLOGY
[image:5.612.57.308.601.730.2]In this paper we are developing a multiple classifier system to be implemented within the SEC framework and com-paring its ability to detect side effects with the framework implementing a single classifier. Therefore, in this section the methods used to analyse the single classifier framework and the multiple classifier system framework are both described. To evaluate each framework, we determine all the la-belled drug-medical event pairs correspond to the25 drugs: nifedipine, amlodipine, felodipine, nicardipine, verapamil,
Fig. 8. The therapy table within the THIN database.
ciprofloxacin, ofoxacin, norfloxacin, nalidixic acid, moxi-floxacin, fluconazole, itraconazole, posaconazole, voricona-zole, ibuprofen, fenoprofen, ketoprofen, celecoxib, flurbipro-fen, nabumetone, naproxen, budesonide, beclometasone, hy-drocortisone and prednisolone. These labelled data are com-posed of the 30 Bradford Hill causality criteria derived attributes for each drug-medical event data-point and a label specifying whether the drug-medical event data-point is listed as an ADR on SIDER or one of the manually selected non-ADRs.
There were a total of5710drug-medical event data points with known labels corresponding to the25chosen drugs. The labelled data were partitioned into training/testing data XT
(80% of the labelled data) and validation data XV (20% of
the labelled data). The training/testing date were used to train the classifier or multiple classifier system and the validation data were used to evaluate the framework implementing the single classifier or multiple classifier system.
The measure used to determine the effectiveness of each framework is the area under the receiver operating charac-teristic curve. This measure corresponds to the probability of a drug-medical event pair known to be an ADR being assigned a higher confidence of being within the ADR class by the framework than a drug-medical event pair known to be a non-ADR [22]. In particular, we restrict out attention to a partial area, as we are only interested in the section of the curve where few drug-medical event pairs are classed as side effects [23]. When many drug-medical event pairs are classed as ADRs, there are likely to be many non-ADRs pairs incorrectly classed as ADRs and this is undesirable. The partial area under the curve that we are interested in is denoted by pAUC[0.9,1] and a more detailed explanation of
how the measure is calculated can be found in section IV-C.
A. SEC Framework: Single Classifier
To analyse the single classifier framework, the SEC frame-work implementing either a random forest, support vector machine, logistic regression, naive Bayes or k-nearest neigh-bours classifier is trained using ten-fold cross validation on the training/testing dataXT. The trained classifier is denoted
byf :R30→ {−1,1}, wheref(xi) =−1represents theith
drug-medical event pair being classifier as a non-ADR and f(xi) = 1 represents the ith drug-medical event pair being
classifier as an ADR.
B. SEC Framework: Ensemble Classifier
The multiple classifier system framework requires train-ing multiple classifiers and learntrain-ing the optimal weighted combination of the classifiers. In this framework, after the training data is generated, the data is firstly used to train various classifiers and then used to determine a weighted combination of all the classifier.
TABLE I
THE DIFFERENT CLASSIFIERS USED BY THE MULTIPLE CLASSIFIER SYSTEM AND THEIR OPTIMAL PARAMETERS.
Classifier Parameters :-(grid search range) Optimal Parameters
f1: Random Forest mtry:-[1,30] mtry=11
f2: Support Vector Machine (Radial) sigma:-(0,1], C:-(0,10] sigma=0.0978, C=6.1624
f3: K-Nearest Neighbours K:-[1,100] K= 17
f4: Logistic Regression decay:-[0,10] decay=0
f5: Naive Bayes fL:-[0,1], usekernel:-{TRUE,FALSE} fL=0, usekernel=TRUE
area of interest under the curve (pAUC[0.9,1], see section
IV-C) using the training/testingXT set. Each classifier is trained
using a grid search over suitable parameter values, these can be seen in Table I and the chosen parameter values are also listed.
For each trained classifier fi, we can also extract the
classifiers confidence that the drug-medical event is in the ADR class, this is denoted byci:R30→[0,1]. Soci(xj)is
the confidence of the ith classifier that the jthdrug-medical event pair is an ADR.
2) Determining the weights: Using these confidence func-tions, genetic algorithms are applied to find the optimal weights βi, i ∈[1,5]for the multiple classifier system that
determines the class of thejth drug-medical event pair by,
f6(xj) =
1 ifP
iβici(xj)≥α∈(0,1)
−1 otherwise (2)
The value α is the natural threshold and this controls the stringency of the multiple classifier system.
The weights are determined by implementing a genetic algorithm with a mutation rate of 0.1 and applying elitism with a candidate population size of 1000 until convergence, see Table II for full details. The fitness of each weight vector (β) is the ten fold cross validation average of the the partial AUC over the specificity range [0.9,1] for the multiple classifier system based on that weight scheme on the training/testing set. The optimal weight vector was,
β= (β1, β2, β3, β4, β5)
= (0.701,0.314,0.002,0.026,0.012) (3)
wherec1()is random forest,c2()is support vector machine,
c3()is K-nearest neighbours, c4()is logistic regression and
c5()is naive Bayes.
C. Evaluation
The framework implementing a single trained classifier or the multiple classifier system is then applied to the validation set and the prediction of each data-point in the validation set is compared with the truth. The number of true positives (TP), false positives (FP), false negatives (FN) and true negatives (TN) are calculated as follows,
TP: |{i|yi=f(xi) = 1}|
FP: |{i|yi=−1, f(xi) = 1}|
FN: |{i|yi= 1, f(xi) =−1}|
TN: |{i|yi=f(xi) =−1}|
Using the above values, the accuracy, precision, sensitivity, and specificity can be calculated,
Sensitivity=(TP)/(TP+FN)
Specificity=(TN)/(TN+FP)
Accuracy=(TP+TN)/(TP+FP+FN+TN)
Precision=(TP)/(TP+FP)
(4)
The receiver operating characteristic (ROC) curve is gener-ated by potting the sensitivity against 1 minus the specificity and the AUC is the area under this curve. The AUC measures the general ability of a classifier rather than only considering how well it does it at its natural threshold and is a fairer mea-sure for comparing different classifiers. The pAUC[0.9,1] is
the partial area under the ROC curve, between the specificity values of 0.9−1, this value is useful as we are interested in the classifiers ability when the specificity is high and the number of of false positives is low.
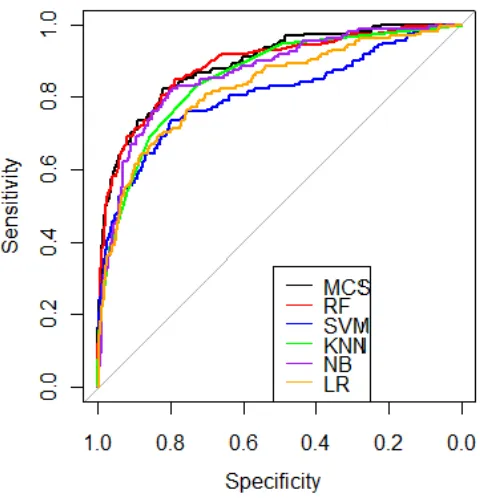
V. RESULTS& DISCUSSION
The results are presented in Table III and ROC plots for the framework implementing the range of classifiers or the multiple classifier system can be seen in Fig. 9. The optimal value for α (the multiple classifier system’s natural threshold) was found to be α = 0.4381. It can be seen that the framework implementing a multiple classifier system (f6) obtained a superior accuracy, sensitivity and
pAUC[0.9,1] than the framework implementing any single
classifier. However, using a bootstrap test to compare the pAUC[0.9,1]s [24] of the random forest and the multiple
classifier system at a 5% significance level, the pAUC[0.9,1]
was not shown to be significantly different (p-value=0.499). The highest precision and specificity values were obtained by the framework implementing a support vector machine and not the multiple classifier system. This is probably due to the multiple classifier system being optimised specifically for the partial AUC. If the precision or specificity was deemed to be more important, different weights could be calculated by the genetic algorithm to optimise the multiple classifier system for the desired measure (e.g., precision or specificity).
TABLE II
THE GENETIC ALGORITHM PARAMETERS.
Population size
Crossover type Mutation type Elitism used
Selection criteria Initialisation Stopping criteria 1000 Local arithmetic
crossover
Uniform random mutation
True Fitness proportional selection with fitness linear scaling
Uniformly chosen from [0,1]
After 500 iterations
TABLE III
THE RESULTS OF THESECFRAMEWORK IMPLEMENTING A SINGLE CLASSIFIER OR MULTIPLE CLASSIFIER SYSTEM FOR THE VALIDATION SET.
Framework classifier Accuracy Precision Sensitivity Specificity pAUC[0.9,1]
f1: Random Forest 0.930 0.789 0.380 0.989 0.769
f2: Support Vector Machine 0.921 0.809 0.241 0.994 0.710
f3: K-Nearest neighbours 0.917 0.729 0.222 0.991 0.695
f4: Logistic Regression 0.086 0.085 0.861 0.003 0.693
f5: Naive Bayes 0.912 0.577 0.354 0.972 0.710
f6: Multiple Classifier System 0.933 0.782 0.430 0.987 0.772
and this would then help indicate which of the classifiers was most influential within the ensemble. This knowledge could be used to remove classifiers that had little influence.
The advantage of ensemble approaches rather than relying on any individual classifier is that they generally reduce the classifier’s variance. This is useful for ADR detection, as the training set is likely to change and grow as new ADRs are discovered. An ensemble approach for ADR detection is also useful, as previous results have shown that each classifier tends to make different mistakes, so the ensemble can overcome an individual classifiers misclassification. This is the likely reason why the ensemble obtained an improved performance. However, the disadvantages are that the en-semble is computationally longer due to the requirement of training multiple classifiers and then tuning the ensemble weights. Although the multiple classifier system improved the accuracy and pAU C[0.9,1] compared to each single
classifier, the improvement was not significant. This may suggest that when the training data is sufficiently large to enable good performance from a single classifier, the small benefit in performance of the ensemble is not enough to overcome the extra cost of complexity. It would be interesting to investigate how the ensemble performs relative to each individual classifier at various training set sizes.
VI. CONCLUSIONS
[image:7.612.312.552.338.587.2]In previous work, it was shown that different classifiers detected different side effects. In this paper we combined various classifiers with the aim of improving the overall discovery of side effects. The classifiers were combined using genetic algorithms to tune a multiple classifier system that can be used within a side effect discovery framework. We then compared the side effect discovery framework imple-menting a multiple classifier system with the framework im-plementing a single classifier. The results show that a larger partial AUC can be obtained by a multiple classifier system that integrates multiple diverse classifier by calculating a
Fig. 9. The ROC plots for the frameworks ability to detect ADRs when implementing the different classifiers.
weighted aggregate of their confidences that a data-point belongs to the class ADR. This research presents a novel useful application of genetic algorithms.
REFERENCES
[1] G. N. Nor´en, J. Hopstadius, A. Bate, K. Star, and I. R. Edwards, “Temporal pattern discovery in longitudinal electronic patient records,”
Data Mining and Knowledge Discovery, vol. 20, no. 3, pp. 361–387, 2010.
[2] I. Zorych, D. Madigan, P. Ryan, and A. Bate, “Disproportion-ality methods for pharmacovigilance in longitudinal observational databases,”Statistical Methods in Medical Research, vol. 22, no. 1, pp. 39–56, 2013.
[3] P. B. Ryan, D. Madigan, P. E. Stang, J. Marc Overhage, J. A. Racoosin, and A. G. Hartzema, “Empirical assessment of methods for risk identification in healthcare data: results from the experiments of the Observational Medical Outcomes Partnership,”Statistics in Medicine, vol. 31, no. 30, pp. 4401–4415, 2012.
[4] J. M. Reps, J. M. Garibaldi, U. Aickelin, D. Soria, J. E. Gibson, and R. B. Hubbard, “Comparison of algorithms that detect drug side effects using electronic healthcare databases.”Soft Computing, vol. 17, no. 12, pp. 2381–2397, 2013. [Online]. Available: http://link.springer.com/content/pdf/10.1007%2Fs00500– 013–1097–4.pdf
[5] O. Caster, N. Nor´en, D. Madigan, and A. Bate, “Logistic regression in signal detection: another piece added to the puzzle,” Clinical Pharmacology & Therapeutics, vol. 94.
[6] J. M. Reps, J. M. Garibaldi, U. Aickelin, D. Soria, J. E. Gibson, and R. B. Hubbard, “Automating the bradford hill causality assessment for signalling drug side effects,”Journal of the American Medical Informatics Association (Submitted), 2014.
[7] A. B. Hill, “The environment and disease: association or causation?”
Proceedings of the Royal Society of Medicine, vol. 58, no. 5, p. 295, 1965.
[8] D. E. Goldberg and J. H. Holland, “Genetic algorithms and machine learning,”Machine Learning, vol. 3, no. 2, pp. 95–99, 1988. [9] T. Windeatt, “Diversity measures for multiple classifier system analysis
and design,”Information Fusion, vol. 6, no. 1, pp. 21–36, 2005. [10] A. Sboner, C. Eccher, E. Blanzieri, P. Bauer, M. Cristofolini, G.
Zu-miani, and S. Forti, “A multiple classifier system for early melanoma diagnosis,”Artificial Intelligence in Medicine, vol. 27, no. 1, pp. 29– 44, 2003.
[11] R. Fusco, M. Sansone, A. Petrillo, and C. Sansone, “A multiple classifier system for classification of breast lesions using dynamic and morphological features in DCE-MRI,” inStructural, Syntactic, and Statistical Pattern Recognition. Springer, 2012, pp. 684–692. [12] L. G. Esposito and C. Sansone, “A multiple classifier approach for
detecting naked human bodies in images,” inIn Proceedings of the 17 th International Conference on Image Analysis and Processing
(ICIAP). Springer, 2013, pp. 389–398.
[13] O. P. Corrigan, “A risky business: the detection of adverse drug reac-tions in clinical trials and post-marketing exercises,”Social Science & Medicine, vol. 55, no. 3, pp. 497–507, 2002.
[14] L. H¨armark and A. Van Grootheest, “Pharmacovigilance: methods, recent developments and future perspectives,” European Journal of Clinical Pharmacology, vol. 64, no. 8, pp. 743–752, 2008.
[15] E. P. van Puijenbroek, A. Bate, H. G. Leufkens, M. Lindquist, R. Orre, and A. C. Egberts, “A comparison of measures of disproportionality for signal detection in spontaneous reporting systems for adverse drug reactions,”Pharmacoepidemiology and Drug Safety, vol. 11, no. 1, pp. 3–10, 2002.
[16] J. Lexchin, “Is there still a role for spontaneous reporting of adverse drug reactions?” Canadian Medical Association Journal, vol. 174, no. 2, pp. 191–192, 2006.
[17] P. M. Coloma, G. Trifir`o, M. J. Schuemie, R. Gini, R. Herings, J. Hippisley-Cox, G. Mazzaglia, G. Picelli, G. Corrao, L. Pedersen
et al., “Electronic healthcare databases for active drug safety surveil-lance: is there enough leverage?”Pharmacoepidemiology and Drug Safety, vol. 21, no. 6, pp. 611–621, 2012.
[18] J. M. Reps, J. M. Garibaldi, U. Aickelin, D. Soria, J. E. Gibson, and R. B. Hubbard, “A novel semi-supervised algorithm for rare prescription side effect discovery,”IEEE Journal of Biomedical and Health Informatics, vol. 18, no. 2, pp. 537–547, 2014.
[19] J. Reps, J. M. Garibaldi, U. Aickelin, D. Soria, J. E. Gibson, and R. B. Hubbard, “Attributes for causal inference in electronic healthcare databases,” inIn Proceedings of the IEEE 26th International Sympo-sium on Computer-Based Medical Systems (CBMS). IEEE, 2013, pp. 548–549.
[20] J. M. Reps, J. M. Garibaldi, U. Aickelin, D. Soria, J. E. Gibson, and R. B. Hubbard, “Signalling paediatric side effects using an ensemble of simple study designs,”Drug Safety, vol. 37, no. 3, pp. 163–170, 2014.
[21] M. Kuhn, M. Campillos, I. Letunic, L. J. Jensen, and P. Bork, “A side effect resource to capture phenotypic effects of drugs,”Molecular Systems Biology, vol. 6, no. 1, pp. 343–348, 2010.
[22] A. P. Bradley, “The use of the area under the ROC curve in the eval-uation of machine learning algorithms,”Pattern Recognition, vol. 30, no. 7, pp. 1145–1159, 1997.
[23] Y. Jiang, C. E. Metz, and R. M. Nishikawa, “A receiver operating characteristic partial area index for highly sensitive diagnostic tests.”
Radiology, vol. 201, no. 3, pp. 745–750, 1996.