ISSN Print: 2162-1985
DOI: 10.4236/oje.2019.912034 Dec. 27, 2019 521 Open Journal of Ecology
Comparing Freshwater Benthic
Macroinvertebrate Communities in Forest
and Urban Streams of the Coastal Ecological
Region of Cameroon
Fils Mamert Onana
1*, Serge Hubert Zebaze Togouet
2, Antoine Arfao Tamsa
3,
Nectaire Lié Nyamsi Tchatcho
1, Siméon Tchakonte
3, Ernest Koji
4,
Armel William Yemtsa Yemeli
1, Abigaelle Natacha Sandrine Mouto Makong
11Department of Aquatic Ecosystems Management, Institute of Fisheries and Aquatic Sciences, University of Douala, Douala, Cameroon
2Department of Animal Biology and Physiology, Faculty of Science, University of Yaoundé I, Yaoundé, Cameroon
3Microbiology and Biotechnology Laboratory, Saint Jerome Polytechnic Institute, Saint Jerome Catholic University of Douala, Douala, Cameroon
4Department of Animal Biology and Physiology, Faculty of Sciences, University of Douala, Douala, Cameroon
Abstract
In this study conducted in the coastal zone of Cameroon, biological indices and functional feeding groups of benthic macroinvertebrates were used to assess the health status of two urban streams. For a better diagnosis, two streams located in coastal forest zone were used as a reference. Benthic ma-croinvertebrates were sampled monthly over a 3-month period (from May to July 2017) in six urban stations and six forest stations. Measurements of the physicochemical variables were done simultaneously. Physicochemical analy-sis revealed that urban streams are strongly polluted with high content of de-caying organic matters, while forest streams are slightly polluted as indicated by the Principal Component Analysis. Concerning benthic macroinvertebrates, urban streams are poorly diversified with the proliferation of taxa tolerant to water pollution and belonging to the functional feeding groups of collectors- gatherers. Inversely, forest streams are more diversified and dominated by sensitive taxa, most belonging to the functional feeding groups of predators and shredders. These marked differences between biological indices and feed-ing mode of benthic macroinvertebrates in forest and urban rivers confirm the reliability of benthic macroinvertebrates as good indicators of freshwater ecosystem in the coastal zone of Cameroon.
How to cite this paper: Onana, F.M., Zebaze Togouet, S.H., Tamsa, A.A., Nyamsi Tchatcho, N.L., Tchakonte, S., Koji, E., Yem- tsa Yemeli, A.W. and Mouto Makong, A.N.S. (2019) Comparing Freshwater Benthic Ma-croinvertebrate Communities in Forest and Urban Streams of the Coastal Ecological Region of Cameroon. Open Journal of Ecol-ogy, 9, 521-537.
https://doi.org/10.4236/oje.2019.912034
Received: November 5, 2019 Accepted: December 24, 2019 Published: December 27, 2019
Copyright © 2019 by author(s) and Scientific Research Publishing Inc. This work is licensed under the Creative Commons Attribution International License (CC BY 4.0).
http://creativecommons.org/licenses/by/4.0/
DOI: 10.4236/oje.2019.912034 522 Open Journal of Ecology
Keywords
Urban and Forest Streams, Benthic Macroinvertebrates, Water Pollution, Biological Indices, Functional Feeding Groups
1. Introduction
Assessment of the impacts of urbanization on rivers and streams involves the research and use of a wide range of physical, chemical, and biological indicators [1]. However, [2] recommend the use of biological communities at the expense of physicochemical variables which provide a punctual approximation of the quality of the environment. The benthic macroinvertebrates are metazoans that are widely represented in rivers and streams and constitute a good tool for this diagnosis [3]. Their preference for biological monitoring of rivers is justified for to the following characteristics [2]: 1) they occupy a wide range of trophic levels and pollution tolerance, providing solid information for the interpretation of cumulative effects due to exposure to pollutants; 2) their sedentary life style make it possible to reflect the local conditions of the environment, and to give a significant image of the quality of the habitat over time.
In Cameroon, the use of benthic macroinvertebrates as bioindicators of the health status of rivers has expanded considerably in the last 15 years. However, most of the works on this group of organisms has been conducted in urban and forest streams in the South-Central Forest Ecological region with bimodal rain-fall [4] [5] [6]. The data available for the coastal eco-zone with unimodal rainrain-fall relate to only a few urban and peri-urban rivers in the industrial-port city of Douala [7] [8] [9]. To date and to our knowledge, no study has been conducted on the ecology of benthic macroinvertebrates of coastal forest streams in the unimodal rainfall ecological region. However, in order to understand the func-tioning of a biological system, it must be understood and interpreted according to its particular ecological situation and implicitly implies a reference model adapted to the ecological region considered [10].
DOI: 10.4236/oje.2019.912034 523 Open Journal of Ecology
2. Materials and Methods
2.1. Study Area and Sampling Stations
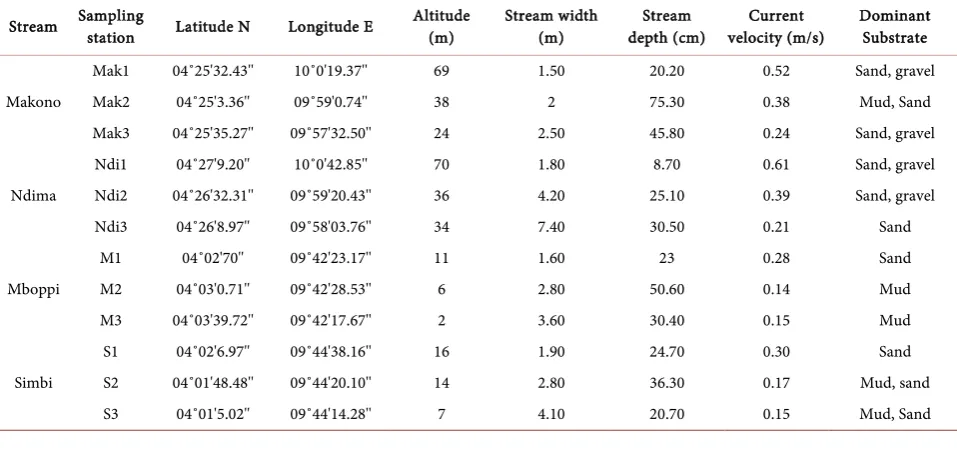
The present study was conducted in the littoral region of Cameroon, which is subject to a unimodal equatorial climate of Guinean type and Cameroonian coastal sub-type, characterized by two seasons: a long rainy season of 9 months (March-November) and a shot dry season of 3 months (December to February) [11]. Rainfalls are abundant and regular y (2596 - 5328 mm). The air tempera-ture is relatively high with a monthly average of 28˚C. The streams chosen for study are situated in the localities of Douala and Yabassi. Table 1 presents the characteristics of sampling stations.
The locality of Yabassi extends on a surface area of approximately 3080 km2
located between 4˚27' and 4˚40' of latitude North and between 9˚57' and 10˚10' of longitude East. It has a population of about 14,685, representing a density of 4.77 inhabitants per km2. Watersheds are covered more than 85% by of a dense
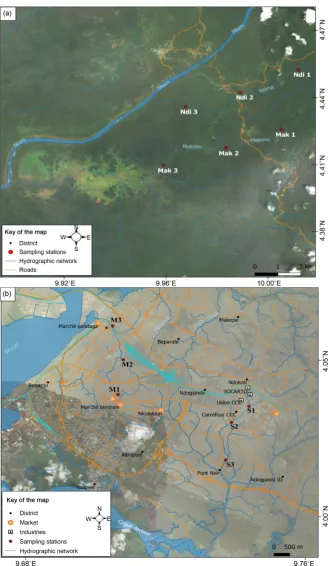
evergreen forest composed of big trees with an important canopy. In Yabassi, two streams namely Makono and Ndima were chosen for the study (Figure 1(a)). Three sampling stations coded Mak1, Mak2 and Mak3 were positioned respectively in the upper, middle and lower sections of the Makono stream. In the Ndima stream, three sampling stations were also chosen (Ndi1, Ndi2 and Ndi3) and located respectively in the upper, middle and lower sections of the stream (Figure 1(a)).
The city of Douala lies between 3˚58' and 4˚7' of latitude North and between 9˚34' and 9˚49' of longitude East. It covers a surface area of approximately 923 km2 for an estimated population of about 2.8 million inhabitants, with a density
of 3033.59 inhabitants per km2. For this study, two streams were selected
[image:3.595.57.536.508.734.2](Mboppi and Simbi) (Figure 1(b)). The Mboppi river basin is characterized by
Table 1. Characteristics of the study sites.
Stream Sampling station Latitude N Longitude E Altitude (m) Stream width (m) depth (cm) Stream velocity (m/s) Current Dominant Substrate
Makono
Mak1 04˚25'32.43'' 10˚0'19.37'' 69 1.50 20.20 0.52 Sand, gravel
Mak2 04˚25'3.36'' 09˚59'0.74'' 38 2 75.30 0.38 Mud, Sand
Mak3 04˚25'35.27'' 09˚57'32.50'' 24 2.50 45.80 0.24 Sand, gravel
Ndima
Ndi1 04˚27'9.20'' 10˚0'42.85'' 70 1.80 8.70 0.61 Sand, gravel
Ndi2 04˚26'32.31'' 09˚59'20.43'' 36 4.20 25.10 0.39 Sand, gravel
Ndi3 04˚26'8.97'' 09˚58'03.76'' 34 7.40 30.50 0.21 Sand
Mboppi
M1 04˚02'70'' 09˚42'23.17'' 11 1.60 23 0.28 Sand
M2 04˚03'0.71'' 09˚42'28.53'' 6 2.80 50.60 0.14 Mud
M3 04˚03'39.72'' 09˚42'17.67'' 2 3.60 30.40 0.15 Mud
Simbi
S1 04˚02'6.97'' 09˚44'38.16'' 16 1.90 24.70 0.30 Sand
S2 04˚01'48.48'' 09˚44'20.10'' 14 2.80 36.30 0.17 Mud, sand
DOI: 10.4236/oje.2019.912034 524 Open Journal of Ecology
Figure 1. Hydrographic map of the study area showing sampling stations. Yabassi (a);
Douala (b).
respec-DOI: 10.4236/oje.2019.912034 525 Open Journal of Ecology tively in the upper, middle and lower sections of the stream (Figure 1(b)). The Simbi watershed is characterized by the presence of some industries whose ef-fluent flows into the Simbi stream: Cameroonian Chemical Complex (CCC), paper making industry (SOCARTO) and industries specialized in the Modeling of Synthetic Organic Products (SCIMPOS). Three sampling stations were posi-tioned on the Simbi stream. Station S1 is located in the upstream, S2 is situated in the middle section of the stream and S3 positioned downstream.
2.2. Physicochemical Analyzes
The measurements of the physicochemical parameters at each of the twelve sam-pling stations were done monthly, between 7 and 10 am, from May to July 2017. These measurements were conducted in accordance with standard methods de-scribed by [12]. Thus, a total of 36 measurements were carried out for each pa-rameter (18 measurements in the 6 stations of the forest streams and 18 others in the 6 stations of the urban streams). Water temperature (T), pH, electrical con-ductivity (EC), and dissolved oxygen concentration (DO) were measured in situ using a portable multi-parameter HANNA HI 9829. For the parameters in-tended to be measured in the laboratory, samples of water were collected at each sampling point using pre-clean double-capped polyethylene bottle of 500 ml, and preserved in refrigerated conditions. Turbidity (Turb), water color (Col), Suspended Solids (SS), Orthophosphate ( 3
4
PO−), Ammonium (
4
NH+) and
[image:5.595.207.540.524.644.2]Ni-trites (NO2−) were measured using a HACH DR/3900 spectrophotometer. To as-sess the organic pollution level, the Organic Pollution Index (OPI) was calcu-lated according to the methodology described by [13] which is based on three ion concentrations (NH4+, NO2− and PO34−). For each parameter, 5 classes of contents having an ecological significance are defined (Table 2). The OPI corresponds to the arithmetic mean value of the class number of each parameter and the values obtained are apportioned into 5 levels of pollution (Table 3).
Table 2. Boundary of the Organic Pollution Index (OPI) classes.
Parameters
Classes NH4
+ (mg-N/l)
2
NO− (µg-N/l)
4
PO3- (µg-N/l)
5 <0.10 5 15
4 0.10 - 0.90 6 - 10 16 - 75
3 1 - 2.40 11 - 50 76 - 250
2 2.50 - 6 51 - 150 251 - 900
1 >6 >150 >900
Table 3. Classification of the pollution level according to the class values of the OPI.
OPI Class 1.00 - 1.90 2.00 - 2.90 3.00 - 3.90 4.00 - 4.50 4.60 - 5.00 Organic pollution
[image:5.595.207.540.678.724.2]DOI: 10.4236/oje.2019.912034 526 Open Journal of Ecology
2.3. Sampling and Identification of Benthic Macroinvertebrates
Benthic macroinvertebrates samples were collected at each station using a long- handled kick net (30 cm × 30 cm side, 400-µm mesh size and 45 cm of depth). All the available habitats within the study station including leaf packs, branches, macrophyte beds, sand, mud and rafts were sampled. Samplings were done in a 100-m stretch for each station, following protocols described by [14]. At each sampling station, 20 drags of the kick net were done in different micro-habitats, each corresponding to a surface area of 0.3 m2 (30 cm × 100 cm), for a total
sampled surface area of 6 m2 per station. Each time, the benthic
macroinverte-brates retained by the meshes of the net were sorted and collected using a pair of fine forceps, and then introduced into plastic bottles containing 70% alcohol. In the laboratory, all of the benthic macroinvertebrates at each sampling station were identified to the family taxonomic level and counted, using a Wild M5 ste-reomicroscope and appropriate taxonomic identification keys proposed by [15] [16] [17]. Recent research indicates that extensive identification up to the family provides a sufficient level of taxonomic resolution to detect responses of the communities studied to anthropogenic disturbances [18].
2.4. Benthic Macroinvertebrates Metrics and Indices
The diversity index of Shannon and Weaver (H') and the Pielou’s evenness index (J) were calculated from the taxonomic richness (S) and abundance (TA) of ma-croinvertebrates. These indices informed on the distribution of individuals within the taxa so as to compare the diversity of the communities of the different sam-pling stations [19]. The assumption is that undisturbed environments are cha-racterized by high diversity or richness and an even distribution of individuals among the Taxa [20].
Seven benthic macroinvertebrate’s metrics were calculated to analyze the community structure: taxonomic richness of the groups Ephemeroptera-Plecop- tera-Trichoptera (S-EPT), Plecoptera-Odonata Ephemeroptera-Trichoptera (S- POET), relative abundance of the group EPT (%-EPT), relative abundance of Insecta (%-Ins), relative abundance of Diptera (%-Dip), relative abundance of Insecta Non Diptera (%-Ins-N-Dip), and relative abundance of Oligochaeta (%-Oligo). Significant changes in the value of these metrics can indicate envi-ronmental disturbances, including freshwater pollution and habitat degradation [18].
DOI: 10.4236/oje.2019.912034 527 Open Journal of Ecology taxa [21]. The tolerance score assigned to each organism in this study was taken from [22] [23].
Lastly, we assigned each taxon to one of the five functional feeding groups (FFGs): shredders (shr), scrapers (scr), collectors-gatherers (c-g), collectors-fil- terers (c-f) and predators (prd); based on the food habit descriptions in literature [16]-[24]. In fact, functional approach which the goal is to characterize ecosys-tem condition uses FFGs to describe ecosysecosys-tem attributes in streams [24].
2.5. Statistical Analyses
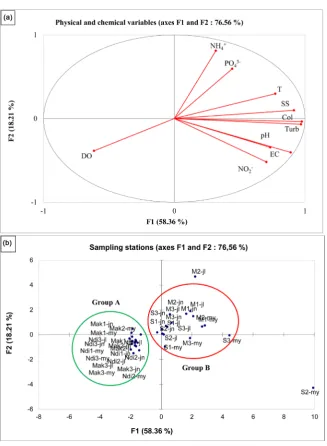
A Principal Component Analysis (PCA) was performed on the physicochemical data set made up of 10 variables measured on the 36 water samples collected during the study. This PCA permitted us to identify firstly homogeneous groups having great physicochemical characteristic similarities, and secondly, characte-rizing each group according to the physicochemical variables measured. The purpose of this test was to discriminate samples from forest and urban sites ac-cording to pollution gradient. The normality test of Shapiro Wilk was carried out before comparing the biotic and abiotic parameters of forests and urban streams. In addition, the Man Whitney U-test was performed to search for sig-nificant differences between the physicochemical variables measured at forest and urban sites, and also between the benthic macroinvertebrates metrics values of these two groups of samples. Relationships between physicochemical variables and metrics obtained from benthic macroinvertebrates were determined using Spearman’s correlation test and PCA. All the statistical analyses were compiled using the XLSTAT 2007 software.
3. Results
3.1. Physicochemical Quality of Water
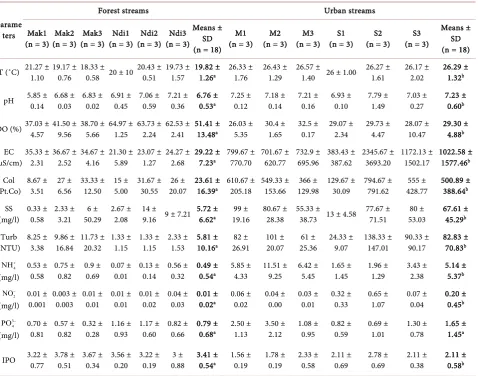
Except for orthophosphates, the values of pH, temperature, electrical conductiv-ity, color, Suspended Solids, turbidconductiv-ity, ammonia and nitrite were significantly lower (P < 0.01) at the forest stations compared those recorded in the urban sta-tions. Inversely, the highest values of dissolved oxygen were recorded at the for-est stations, while the urban stations showed very high oxygen content (Table 4). Moreover, the organic pollution level of the water was moderate at the forest sites (OPI = 3.41 ± 0.54) whereas in the urban area it was high (OPI = 2.11 ± 0.58) (Table 4).
DOI: 10.4236/oje.2019.912034 528 Open Journal of Ecology
Table 4. Mean and standard deviation (SD) values of the physicochemical variables at each sampling station of forest and urban
streams.
Parame ters
Forest streams Urban streams
Mak1
(n = 3) (n = 3) Mak2 (n = 3) Mak3 (n = 3) Ndi1 (n = 3) Ndi2 (n = 3) Ndi3 Means ±
SD (n = 18)
M1
(n = 3) (n = 3) M2 (n = 3) M3 (n = 3) S1 (n = 3) S2 (n = 3) S3
Means ± SD (n = 18)
T (˚C) 21.27 ± 1.10 19.17 ± 0.76 18.33 ± 0.58 20 ± 10 20.43 ± 0.51 19.73 ± 1.57 19.82 ± 1.26a 26.33 ± 1.76 26.43 ± 1.29 26.57 ± 1.40 26 ± 1.00 26.27 ± 1.61 26.17 ± 2.02 26.29 ± 1.32b
pH 5.85 ± 0.14 6.68 ± 0.03 6.83 ± 0.02 6.91 ± 0.45 7.06 ± 0.59 7.21 ± 0.36 6.76 ± 0.53a 7.25 ± 0.12 7.18 ± 0.14 7.21 ± 0.16 6.93 ± 0.10 7.79 ± 1.49 7.03 ± 0.27 7.23 ± 0.60b
DO (%) 37.03 ± 4.57 41.50 ± 9.56 38.70 ± 5.66 64.97 ± 1.25 63.73 ± 2.24 62.53 ± 2.41 51.41 ± 13.48a 26.03 ± 5.35 30.4 ± 1.65 32.5 ± 0.17 29.07 ± 2.34 29.73 ± 4.47 28.07 ± 10.47 29.30 ± 4.88b
EC
(µS/cm) 35.33 ± 2.31 36.67 ± 2.52 34.67 ± 4.16 21.30 ± 5.89 23.07 ± 1.27 24.27 ± 2.68 29.22 ± 7.23a 799.67 ± 770.70 701.67 ± 620.77 732.9 ± 695.96 383.43 ± 387.62 2345.67 ± 3693.20 1172.13 ± 1502.17 1022.58 ± 1577.46b
Col
(Pt.Co) 8.67 ± 3.51 27 ± 6.56 33.33 ± 12.50 15 ± 5.00 31.67 ± 30.55 20.07 26 ± 23.61 ± 16.39a 610.67 ± 205.18 549.33 ± 153.66 129.98 366 ± 129.67 ± 30.09 794.67 ± 791.62 428.77 555 ± 500.89 ± 388.64b
SS
(mg/l) 0.33 ± 0.58 2.33 ± 3.21 50.29 6 ± 2.67 ± 2.08 14 ± 9.16 9 ± 7.21 5.72 ± 6.62a 19.16 99 ± 80.67 ± 28.38 55.33 ± 38.73 13 ± 4.58 77.67 ± 71.51 53.03 80 ± 67.61 ± 45.29b
Turb
(NTU) 8.25 ± 3.38 9.86 ± 16.84 11.73 ± 20.32 1.33 ± 1.15 1.33 ± 1.15 2.33 ± 1.53 5.81 ± 10.16a 26.91 82 ± 101 ± 20.07 25.36 61 ± 24.33 ± 9.07 138.33 ± 147.01 90.33 ± 90.17 82.83 ± 70.83b
4
NH+
(mg/l) 0.53 ±
0.58 0.75 ± 0.82 0.9 ± 0.69 0.07 ± 0.01 0.13 ± 0.14 0.56 ± 0.32 0.49 ± 0.54a 5.85 ± 4.33 11.51 ± 9.25 6.42 ± 5.45 1.65 ± 1.45 1.96 ± 1.29 3.43 ± 2.38 5.14 ± 5.37b
2
NO− (mg/l)
0.01 ±
0.001 0.003 ± 0.003 0.01 ± 0.01 0.01 ± 0.01 0.01 ± 0.02 0.04 ± 0.03 0.01 ± 0.02a 0.06 ± 0.02 0.04 ± 0.00 0.03 ± 0.01 0.32 ± 0.33 0.65 ± 1.07 0.07 ± 0.04 0.20 ± 0.45b
3 4
PO−
(mg/l) 0.70 ±
0.81 0.57 ± 0.82 0.32 ± 0.28 1.16 ± 0.93 1.17 ± 0.60 0.82 ± 0.66 0.79 ± 0.68a 2.50 ± 1.13 3.50 ± 2.12 1.08 ± 0.95 0.82 ± 0.59 0.69 ± 1.01 1.30 ± 0.78 1.65 ± 1.45a
IPO 3.22 ± 0.77 3.78 ± 0.51 3.67 ± 0.34 3.56 ± 0.20 3.22 ± 0.19 0.88 3 ± 3.41 ± 0.54a 1.56 ± 0.19 1.78 ± 0.19 2.33 ± 0.58 2.11 ± 0.69 2.78 ± 0.69 2.11 ± 0.38 2.11 ± 0.58b
Mann Whitney tests were used to evaluate differences among the two groups of streams (forest streams and urban streams). The values followed by the superscript (a, b) for a given physicochemical parameter indicate that this parameter is significantly different between forest and urban streams (P < 0.01).
from the Simbi and Mboppi streams, located in Douala. These urban sampling sites have very poor water quality with higher values of water color, turbid, ions content, and important organic matter load.
3.2. Benthic Macroinvertebrates Communities’ Structure
DOI: 10.4236/oje.2019.912034 529 Open Journal of Ecology
Figure 2. Projections of the physicochemical variables of water samples collected on the
plane of the first two axes of the PCA. Correlation circle (a) and grouping of stations into two classes based on their physicochemical characteristics (b); where my, jn et jl represent respectively sampling months May, June and July.
while Diptera, Haplotaxida and Basommatophora are the most represented orders with 5, 4 and 4 families respectively. Similarly, Decapoda crustaceans are absent in urban streams while in forest streams, they were present and represented by 4 families. In addition, the average number of family (S), the S-EPT and S-POET metric values were significantly higher (P < 0.01) in forest stream than those recorded in urban stations (Table 5).
DOI: 10.4236/oje.2019.912034 530 Open Journal of Ecology
Table 5. Values of the metrics used to describe the benthic macroinvertebrates communities’ structure and to measure the
pollu-tion tolerance.
Metrics
Forest rivers Urban rivers
Mak1 Mak2 Mak3 Ndi1 Ndi2 Ndi3 Means ± SD (n = 6) M1 M2 M3 S1 S2 S3 Means ± SD (n = 6)
Community structure Index
16 13 9 15 16 17 14.33 ± 2.94a 7 10 6 8 7 11 8.17 ± 1.94b
S
TA 125 139 104 73 83 101 104.16 ± 724.81a 62 252 23 255 86 72 125 ± 101.72a
S-EPT 1 4 2 1 4 1 2.17 ± 1.47a 0 0 0 0 0 0 0b
S-POET 5 5 3 5 7 6 5.17 ± 1.33a 0 0 0 0 0 0 0b
H' 2.43 2.63 2.23 3.28 3.20 3.31 2.85 ± 0.47a 2.43 1.55 2.02 1.548 1.71 3.14 2.07 ± 0.62b
J 0.61 0.71 0.71 0.84 0.80 0.81 0.75 ± 0.08a 0.86 0.47 0.78 0.52 0.61 0.91 0.69 ± 0.19a
%-EPT 0.80 36.69 4.81 1.37 14.46 3.96 10.35 ± 13.81a 0.00 0.00 0.00 0.00 0.00 0.00 0.00b
%-Ins 21.60 46.04 22.12 54.79 45.78 58.42 41.46 ± 15.96a 43.55 2.78 17.39 37.65 13.95 29.17 24.08 ± 15.43a
%-Ins-N-Dip 20.80 45.32 22.12 54.79 45.78 58.42 41.21 ± 16.12a 0.00 0.39 0.00 1.57 4.65 5.56 2.03 ± 2.48b
%-Dip 0.80 0.72 0.00 0.00 0.00 0.00 0.25 ± 0.39a 43.55 2.38 17.39 36.08 9.30 23.61 22.05 ± 15.70b
%-Oligo 0.80 0.72 0.00 0.00 0.00 0.00 0.25 ± 0.39a 6.45 4.37 4.35 3.92 2.33 34.72 9.36 ± 12.50b
Pollution tolerance Index
%-To 1.60 0.00 3.85 27.40 24.10 13.86 11.80 ± 11.87a 66.13 57.1 65.22 92.94 68.6 52.78 67.14 ± 13.99b
%-Into 6.40 34.53 6.73 1.37 24.10 10.89 14.00 ± 12.68a 0.00 0.00 0.00 0.00 0.00 0.00 0.00b
%-Dom 55.20 30.20 50.00 26.03 34.94 29.70 37.68 ± 12.01a 25.81 54.4 43.48 55.29 55.81 20.83 42.60 ± 15.69a
FBI 5.59 4.22 5.54 6.44 5.51 5.28 5.43 ± 0.71a 8.10 7.13 7.61 7.82 7.35 7.24 7.54 ± 0.37b
FMWP 77.00 57.00 44.00 81.00 74.00 92.00 70.83 ± 17.38a 54.00 68.00 47.00 54.00 54.00 80.00 59.52 ± 12.16a
ASPT 4.81 4.38 4.89 5.40 4.63 5.41 4.92 ± 0.42a 7.71 6.80 7.83 6.75 7.71 7.27 7.35 ± 0.48b
Mann Whitney tests were used to evaluate differences among the two groups of streams (forest streams and urban streams). The values followed by the superscript (a, b) for a given metric indicate that this metric is significantly different between forest and urban streams (P < 0.01).
account for 82.53% of the total abundance in urban streams. In the forest streams, a total abundance of 625 individuals was registered. The Desmocaridae (17.12%), Thiaridae (15.36%), Lymnaeidae (10.24%) and Atyidae (10.24%) are the most represented benthic macroinvertebrate families in forest streams. Also, pollu-tion-sensitive taxa are significantly represented with Perlidae (8.64%), Gyrinidae (7.68%), and Gomphidae (2.72%). In addition, Statistical analyses revealed that, metric values such as %-EPT and %-Ins-N-Dip, were significantly higher (P < 0.01) in forested streams than in urban streams (Table 5). Inversely, the %-Dip and %-Oligo indices showed significantly lower values (P < 0.01) in forested streams as compared to urban streams.
in-DOI: 10.4236/oje.2019.912034 531 Open Journal of Ecology dex were noted (2.07 ± 0.62 bits/ind) (Table 5). Although indicating, a better distribution of individuals within different taxa in forest (0.75 ± 0.08) and urban (0.69 ± 0.19) stations, the Pielou evenness index (J) did not vary significantly (P > 0.05) (Table 5). The %-Into and FMWP indices measuring sensitivity of taxa to pollution were higher in forest streams than in urban ones. For %-To and FBI, the values recorded in urban streams are significantly high (P < 0.05) than those registered in forested sites (Table 5). In addition, the FBI revealed that forest streams waters are of medium quality with fairly substantial organic pollu-tion (FBI = 5.43 ± 0.71) whereas waters from urban streams are of very poor quality with severe organic pollution (FBI = 7.54 ± 0.37).
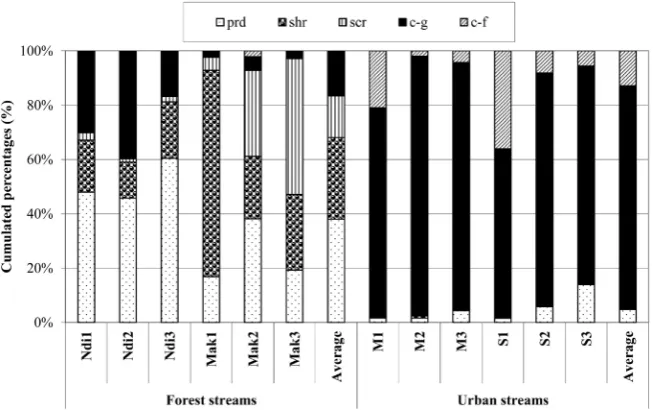
Regarding FFGs, in the forest streams, predators and shredders are the most represented with 38.04% and 30.02% of relative abundances respectively (Figure 3). The collectors-gatherers and the scrapers represent 16.18% and 15.40% of the total abundance respectively. The collectors-filterers are very poorly represented with 0.36% of individuals. In urban streams, macroinvertebrates are dominated by collectors-gatherers, which constitute 82.15% of the population. However, we also find collectors-filterers, predators and shredders which respectively account for 12.85%, 4.80% and 0.20% of macroinvertebrates.
3.3. Relationship between Benthic Macroinvertebrates Metrics
and Physicochemical Water Quality
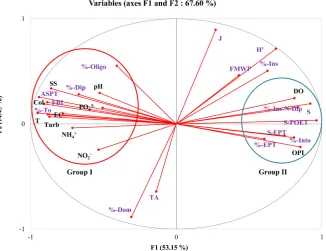
[image:11.595.209.537.503.708.2]The PCA based on the physicochemical variables and the benthic macroinverte-brates metrics showed that the first two axes (F1, F2) account for 67.60% of the total variance (Figure 4). The distribution of the observations according to the factorial plane 1 - 2 discriminates two groups. The group I is consisted of physi-cochemical parameters such as nitrites, ammonium, orthophosphates, color, SS, turbidity, pH and temperature, which are positively and significantly corre-lated to %-Dip, %-Oligo, %-To, FBI and ASPT. It may be thought that benthic
DOI: 10.4236/oje.2019.912034 532 Open Journal of Ecology
Figure 4. Correlations circle between physicochemical variables and benthic
macroin-vertebrates metrics from the first two axes (axis 1 horizontal and axis 2 vertical) of the PCA.
macroinvertebrates individuals belonging to the orders of Diptera, Oligochaeta and all other individuals belonging to pollution-tolerant families (tolerance score > 6) proliferate in very turbid waters, with high temperature and heavy organic matter load, characteristics of urban streams located in Douala. This is confirmed by the positive and significant correlations between metrics such as %-Dip, %-Oligo, %-To, FBI and ASPT and environmental variables such as temperature, electrical conductivity, color, turbidity, SS, nitrites, ammonium and orthophosphates (Table 6). Inversely, the group II, gathered metrics such as %-Ins-N-Dip, %-Into, %-EPT, S, S-EPT and S-POET which are positively and significantly correlated with dissolved oxygen and OPI (Figure 4), indicating low organic matter load in the forest streams of Yabassi. Similarly, the Spearman correlation matrix revealed that the installation and the proliferation of non-Dipterans insects, EPT, POET and all other sensitive individuals (tolerance score < 4) are favored in well oxygenated water with low organic matter concen-tration (Table 6).
4. Discussion
DOI: 10.4236/oje.2019.912034 533 Open Journal of Ecology
Table 6. Spearman’s correlation coefficient between the physicochemical variables and the benthic macro-invertebrates metrics.
Variables Metrics
S S-EPT S-POET H' %-EPT %-Ins %-Ins-N-Dip %-Dip %-Oligo %-To %-Into FBI ASPT T −0.62* −0.85** −0.75** NS −0.88** −0.63* −0.86** 0.75** 0.82** 0.74** −0.85** 0.79** 0.82**
pH NS −0.59* NS NS NS NS NS NS NS 0.69* NS NS 0.78**
DO 0.67* 0.82** 0.88** 0.62 0.83** NS 0,83** −0.94** −0.90** −0.66* 0.80** −0.80** −0.69* EC −0.72* −0.78** −0.86** NS −0.77** −0.61* −0.79** 0.84** 0.86** 0.60* −0.75** 0.67* 0.76** Col −0.78** −0.72* −0.82** NS −0.7* NS −0.73** 0.70* 0.73** 0.74** −0.74** 0.69* 0.77** SS NS −0.72* −0.67* NS −0.7* NS −0.66* 0.62* 0.72* 0.72* −0.70* 0.65* 0.77** Turb −0.73** −0.79** −0.90** −0.7 −0.78** −0.74** −0.78** 0.73** 0.81** 0.61* −0.78** 0.64* 0.74** NH4+ −0.76** −0.77** −0.88** −0.67 −0.75** −0.65* −0.87** 0.73** 0.84** 0.58* −0.75** 0.64* 0.78**
NO2- NS −0.81** −0.73** NS −0.77** NS NS 0.65* 0.58* 0.85** −0.77** 0.70* 0.76**
PO43- NS NS NS NS NS NS NS NS NS NS NS NS NS
OPI 0.48* 0.86** 0.71* NS 0.86** NS 0.74** −0.79** −0.82** −0.79** 0.82** −0.78** −0.78** Significant correlation (*: P < 0.05; **: P < 0.01); NS: non-significant correlation.
Mboppi market, Sandaga market), households and traditional toilets of the spontaneous habitats. The resulting aerobic degradation of organic matter is re-sponsible of the hypoxic condition of these waters [25]. As regards forest streams, they showed a better water quality due to the presence of riparian vege-tation. In fact, the important riparian forest limits the exposure of the streams to solar rays, which considerably reduces the temperature of the water. It also re-duces soils erosion and indirectly the amount of nutrients and organic matter loaded in the streams [26]. The values of parameters indicating organic matter load (nitrites, ammonium and phosphates) are lower in forest streams; however, these parameters revealed through the OPI, a moderate organic pollution of wa-ter. [27] has attributed such a situation in the forest zone, principally due to the degradation of the litter coming from the riparian vegetation.
DOI: 10.4236/oje.2019.912034 534 Open Journal of Ecology insects are highly sensitive to pollution and/or habitat modification, resulting in their disappearance in a disturbed environment. Moreover, the virtual absence of EPT orders in urban stations confirms their great degradation.
In a study conducted in the United States, [29] indicate that EPT taxa are among the most sensitive benthic macroinvertebrates and therefore their species richness decreases drastically with the urbanization of watersheds. Our results are in line with those of [30] who showed that a decrease in the number of EPT taxonomic richness in human impacted streams is clearly related to changes in water quality and habitat suitability. For freshwater Decapoda, it is recognized that these organisms proliferate in well-oxygenated waters [16] [31]. In addition, the great prominence of the Decapoda order would also be related to their be-longing to the functional feeding groups of shredders and to the presence of large amounts of litter in forest streams. They find an important part of their food resources in the litter. [32] showed that macroinvertebrates associated with litter in Guinea’s rivers were largely dominated by shredder Decapoda.
The proliferation of Physidae, Lymnaeidae and Chironomidae in the urban streams of the city of Douala is explained by the fact that these waters systems are subjected to heavy organic matter load. To live in such disturbed environ-ments, these organisms have developed special adaptations. Indeed, [33] showed that Physidae and Lymnaeidae have a rudimentary lung through which they breathe atmospheric air and thus can live in hypoxic aquatic environments. Moreover, their rapid maturation and their ability to self-fertilize in difficult conditions are also at the origin of their important development [34]. As for Chironomidae, studies by [35] [36] have shown that these organisms have adapted to hypoxic media with the hemoglobin in their hemolymph which al-lows them to store oxygen in the cuticle when it is abundant in the medium and to release it when its concentration becomes low. Furthermore, Chironomidae have what appears to be finger-like “gills” at the posterior ends of their bodies, which are actually involved in osmoregulation and permitted them to live in polluted waters with high ionic concentrations [8]. In addition, the high abun-dance of Physisae, Lymnaeidae and Chironomidae is related to their feeding mode; indeed, they are collectors-gatherers and proliferate in turbid aquatic mi-lieu with important decaying organic matters load [24]. This is primarily due to various anthropogenic pollution sources found in the rivers basins of Douala township.
5. Conclusion
en-DOI: 10.4236/oje.2019.912034 535 Open Journal of Ecology vironmental conditions, confirming the reliability of benthic macroinvertebrates in assessing disturbances in streams of the coastal ecological region of Came-roon.
Conflicts of Interest
The authors declare no conflicts of interest regarding the publication of this pa-per.
References
[1] Wang, B.D., Liu, S., Liu, Y., Zhang, D., Lu and Wang, L. (2012) Impacts of Urbani-zation on Stream Habitats and Macroinvertebrate Communities in the Tributaries of Qiangtang River, China. Hydrobiologia, 680, 39-51.
https://doi.org/10.1007/s10750-011-0899-6
[2] Barbour, M.T., Gerritsen, J., Snyder, B.D. and Stribling, J.B. (1999) Rapid Bioas-sessment Protocols for Use in Stream and Wadeable Rivers: Periphyton, Benthic Macroinvertebrates and Fish. 2nd Edition, U.S. Environmental Protection Agency, Office of Water, Washington DC.
[3] Gresens, S.E., Belt, K.T., Tang, J.A., Gwinn, D.C. and Banks, P.A. (2007) Temporal and Spatial Responses of Chironomidae (Diptera) and Other Benthic Invertebrates to Urban Stormwater Runoff. Hydrobiologia, 575, 173-190.
https://doi.org/10.1007/s10750-006-0366-y
[4] Foto Menbohan, S., Koji, E., Ajeagah Gideon, A., Bilong Bilong, C.F. and Njiné, T. (2012) Impact of Dam Construction on the Diversity of Benthic Macroinvertebrates Community in a Periurban Stream in Cameroon. International Journal of Bios-ciences, 11, 137-145.
[5] Foto Menbohan, S., Tchakonte, S., Ajeagah, G., Zebaze Togouet, S.H., Bilong Bi-long, C.F. and Njine, T. (2013) Water Quality Assessment Using Benthic Macroin-vertebrates in a Periurban Stream (Cameroon). International Journal of Biotech-nology, 2, 91-104.
[6] Nyamsi Tchatcho, N.L., Foto Menbohan, S., Zebaze Togouet, S.H., Onana, F.M., Adandedjan, D., Tchakonte, S., Yemele Tsago, C., Koji, E. and Njine, T. (2014) Multimetric Index of Yaounde Benthic Macroinvertebrates (IMMY) for the Biolog-ical Assessment of Stream Water Quality in the South-Central Forestry Region of Cameroon. European Journal of Scientific Research, 123, 412-430.
[7] Tchakonté, S., Ajeagah, G.A., Diomande, D., Camara, I.A. and Ngassam, P. (2014) Diversity, Dynamic and Ecology of Freshwater Snails Related to Environmental Factors in Urban and Suburban Streams in Douala-Cameroon (Central Africa).
Aquatic Ecology, 48, 379-395.https://doi.org/10.1007/s10452-014-9491-2
[8] Tchakonté, S., Ajeagah, G.A., Camara, A.I., Diomandé, D., Nyamsi Tchatcho, N.L. and Ngassam, P. (2015) Impact of Urbanization on Aquatic Insect Assemblages in the Coastal Zone of Cameroon: The Use of Biotraits and Indicator Taxa to Assess Environmental Pollution. Hydrobiologia, 755, 123-144.
https://doi.org/10.1007/s10750-015-2221-5
DOI: 10.4236/oje.2019.912034 536 Open Journal of Ecology
Review. Bulletin d’Ecologie, 20, 109-127.
[11] Suchel, J. (1972) Climates of Cameroon. PhD Thesis, Universityof Bordeaux III, Bordeaux.
[12] Rodier, J., Legube, B. and Merlet, N. (2009) The Water Analysis. 9th Edition, Du-nod, Paris.
[13] Leclercq, L. and Maquet, B. (1987) Two New Chemical and Diatomic Indices of Running Water Quality. Application to Samson and Its Tributaries (Belgian Meuse Basin). Comparison with Other Chemical, Biocenotic and Diatomic Indices. Royal Institute of Natural Sciences of Belgium, Bruxelles, Work Document 38, 1-113. [14] Stark, J.D., Boothroyd, K.G., Harding, J.S., Maxted, J.R. and Scarsbrook, M.R.
(2001) Protocols for Sampling Macroinvertebrates in Wadeable Streams. New Zealand Macroinvertebrates Working Group, Report No. 1, Ministry for the Envi-ronment Report, 1-57.
[15] De Moor, I.J., Day, J.A. and De Moor, F.C. (2003) Guides to the Freshwater Inver-tebrates of Southern Africa, Volume 7: Insecta I. Ephemeroptera, Odonata, Plecop-tera. Prepared for the Water Research Commission, Pretoria, WRC Report No. TT 207/03, Pretoria.
[16] Tachet, H., Richoux, P., Bournaud, M. and Usseglio-Polatera, P. (2006) Freshwater Invertebrates: Systematic, Biology and Ecology. CNRS Editions, Paris.
[17] Tachet, H., Richoux, P., Bournaud, M. and Usseglio-Polatera, P. (2010) Freshwater Invertebrates: Systematic, Biology and Ecology. CNRS Editions, Paris.
[18] Camargo, J.A., Alonso, A. and De la Puente, M. (2004) Multimetric Assessment of Nutrient Enrichment in Impounded Rivers Based on Benthic Macroinvertebrates.
Environmental Monitoring and Assessment, 96, 233-249.
https://doi.org/10.1023/B:EMAS.0000031730.78630.75
[19] Dajoz, R. (2000) Fundamentals of Ecology. Dunod, Paris.
[20] Li, L., Zheng, B.H. and Liu, L.S. (2010) Biomonitoring and Bioindicators Used for River Ecosystems: Definitions, Approaches and Trends. Procedia Environmental Sciences, 2, 1510-1524.https://doi.org/10.1016/j.proenv.2010.10.164
[21] Tolkamp, H.H. (1985) Biological Assessment of Water Quality in Running Water Using Macroinvertebrates: A Case Study for Limburg, the Netherlands. Water Science and Technology, 17, 867-878.https://doi.org/10.2166/wst.1985.0186
[22] Bode, R.W., Novak, M.A., Abele, L.E., Heitzman, D.L. and Smith, A.J. (2002) Qual-ity Assurance Work Plan for Biological Stream Monitoring in New York State, Al-bany (New York). Stream Biomonitoring Unit Bureau of Water Assessment and Management, Division of Water. NYS Department of Environmental Conservation. [23] Hilsenhoff, W.L. (1988) Rapid Field Assessment of Organic Pollution with a Fami-ly-Level Biotic Index. Journal of the North America Benthological Society, 7, 65-68.
https://doi.org/10.2307/1467832
[24] Cummins, K.W, Merritt, R.W. and Andrade, P.C.N. (2005) The Use of Invertebrate Functional Groups to Characterize Ecosystem Attributes in Selected Streams and Rivers in South Brazil. Studies on Neotropical Fauna and Environment, 40, 69-89.
https://doi.org/10.1080/01650520400025720
[25] Othoniel, C. (2006) The Growth of Photosynthetic Biofilm: An Indicator of the Trophic Status of Rivers? PhD Thesis, University of Bordeaux I, Bordeaux.
[26] Allan, J.D. and Castillo, M.M. (2007) Stream Ecology: Structure and Function of Running Waters. 2nd Edition, Springer, Dordrecht.
DOI: 10.4236/oje.2019.912034 537 Open Journal of Ecology
Headwater Streams: Study of the Litter Decomposition Process. PhD Thesis, Uni- versity of Toulouse III, Toulouse.
[28] Wang, S.Y., Bernhardt, E.S. and Wrigh, J.P. (2014) Urban Stream Denitrifier Com- munities Are Linked to Lower Functional Resistance to Multiple Stressors Associated with Urbanization. Hydrobiologia, 726, 13-23.
https://doi.org/10.1007/s10750-013-1747-7
[29] Carliste, D.M., Meador, M.R., Moulton II, S.R. and Ruhl, P.M. (2007) Estimation and Application of Indicator Values for Common Macro-Invertebrates Genera and Families of the United States. Ecological Indicators, 7, 22-23.
https://doi.org/10.1016/j.ecolind.2005.09.005
[30] Song, M.Y., Leprieur, F., Thomas, A., Lek-Ang, S., Chon, T.S. and Lek, S. (2009) Impact of Agricultural Land Use on Aquatic Insect Assemblages in the Garonne River Catchment (SW France). Aquatic Ecology, 43, 999-1009.
https://doi.org/10.1007/s10452-008-9218-3
[31] Fossati, O., Mosseron, M. and Keith, P. (2002) Distribution and Habitat Utilization in Two Atyid Shrimps (Crustacea: Decapoda) Macro- and Micro- in the Rivers of Nuku-Hiva Island (French Polynesia). Hydrobiologia, 472, 197-206.
https://doi.org/10.1023/A:1016311220269
[32] Tenkiano Doumbou, N.S. (2017) Benthic Macroinvertebrates and Aquatic Hypho-mycetes: Diversity and Involvement in the Ecosystem Functioning of Guinea’s Wa-tercourses. PhD Thesis, University of Toulouse, Toulouse.
[33] Mouthon, J. (2001) Freshwater Mollusks and Biodegradable Pollution of Rivers: Proposal of Scale of Species Sensitivity, Genera and Families. Ingénieries, 26, 3-15. [34] Dillon, R.T.Jr., McCullogh, T.E. and Earnhardt, C.E. (2005) Estimates of Natural
Allosperm Storage Capacity and Self-Fertilisation Rate in the Hermaphrodite Freshwater Pulmonate Snail, Physa acuta. Invertebrate Reproduction and Develop-ment, 47, 111-115.https://doi.org/10.1080/07924259.2005.9652151
[35] Scholz, F. and Zerbst-Boroffka, I. (1998) Environmental Hypoxia Affects Osmotic and Ionic Regulation in Freshwater Midge-Larvae. Journal of Insect Physiology, 44, 427-436.https://doi.org/10.1016/S0022-1910(98)00031-6