Accelerated Diffusion and Phase Transformations in Co
Cu Alloys
Driven by the Severe Plastic Deformation
Boris B. Straumal
1,2,3,4, Andrei A. Mazilkin
1,2,4, Brigitte Baretzky
1,
Gisela Schütz
4, Eugen Rabkin
5and Ruslan Z. Valiev
61Karlsruher Institut für Technologie, Institut für Nanotechnologie, Hermann-von-Helmholtz-Platz 1,
76344 Eggenstein-Leopoldshafen, Germany
2Institute of Solid State Physics, Russian Academy of Sciences, 142432 Chernogolovka, Moscow district, Russia
3National University of Science and Technology“MISIS”, Leninsky prospect, 4, 119049 Moscow, Russia
4Max-Planck-Institut für Intelligente Systeme ( former MPI Metallforschung), Heisenbergstrasse 3, 70569 Stuttgart, Germany
5Department of Materials Engineering, TECHNION-Israel Institute of Technology, 32000 Haifa, Israel
6Ufa State Aviation Technical University, 450000 Ufa, Russia
The cast Co5.6 mass%Cu and Co13.6 mass%Cu alloys were subjected to severe plastic deformation (SPD) by the high-pressure torsion (HPT). The HPT treatment drastically decreases the size of the Co grains (from 20 µm to 100 nm) and the Cu precipitates (from 2 µm to 10 nm). The metastable fcc-Co disappeared, and supersaturated Co-based solid solution present in the as-cast alloys completely decomposed after HPT. Only the phases stable below 400°C remained after severe plastic deformation (i.e. almost pure hcp-Co and fcc-Cu grains). The applicability of the concept of effective temperature originally developed for materials under irradiation for the SPD-accelerated diffusion is discussed.
[doi:10.2320/matertrans.MD201111]
(Received July 14, 2011; Accepted October 31, 2011; Published December 25, 2011)
Keywords: severe plastic deformation, cobaltcopper alloys, phase transformations, driven systems
1. Introduction
The objective of this work is to prove whether the concept of effective temperature is applicable to the severe plastic deformation (SPD). This concept was originally developed for the materials under strong irradiation. SPD is a novel technique for materials processing. It allows producing bulk nanomaterials. In addition to significant grain refinement, SPD also causes phase transformations in the material during treatment (at ambient temperature and during short process-ing times).1) SPD can induce the formation210) or decom-position1113) of a supersaturated solid solution, dissolution of phases,1526)disordering of ordered phases,1729) amorph-ization of crystalline phases,3038) synthesis of the low-temperature,19,26)high-temperature3941)or high-pressure4246) allotropic modifications, and nanocrystallization in the amorphous matrix.4754)Some of these phase transformations are associated with small atomic displacements, while the others are controlled by the long-range atom transport. The results of such SPD-driven transitions cannot be explained by neither bulk nor grain boundary diffusion at the SPD temperature. A new explanation is needed for the SPD-driven accelerated mass transfer.
The experimental part of this work is devoted to the investigation of high pressure torsion (HPT) of the super-saturated CoCu alloys. Co and Cu form a simple peritectic system with rather large Cu solubility of about 12 mass%at the peritectic temperatureTper=1112°C.55)Below 400°C the solubility of Cu in Co is negligible. Co has two allotropes, namely the face-centered cubic¡-Co, stable above 422°C and the hexagonal closely-packed ¾-Co, stable below 422°C. Using the example of fast decomposition of supersaturated solid solution of Cu in Co and simultaneous ¡-Co¼¾-Co transformation we demonstrate that the concept of effective temperature originally developed for materials under
irradi-ation is also applicable to the SPD. We calculated the values of effective temperature for the SPD data published in Refs. 1151). We demonstrate also that the concept of effective temperature allows a prediction of the structure and composition of phases formed during SPD.
2. Experimental
CoCu alloys containing 13.6 and 5.6 mass% Cu were prepared by the vacuum induction melting of the high purity components (5N Co and 5N5 Cu). The high purity Co (delivered by Goodfellow) and Cu (delivered by PPM Pure Metals) were sawed into pieces, chemically etched, weighted and placed into the induction melting machine EL 1100 (HF generator 0.8 MHz, 25 kW) under the vacuum of 10¹4Pa. The initial materials were inductively heated up to the temperature well above the melting point of Co and kept melted about 10 min in order to ensure the complete and uniform mixing of the components. The melt was poured in the vacuum into the water-cooled cylindrical copper crucible of 10 mm diameter. After sawing, grinding, and chemical etching, the 0.7 mm thick disks cut from the as cast cylinders were subjected to HPT in a Bridgman anvil type unit (room temperature, pressure 6 GPa, 5 torsions, 1 rotation-per-minute). After HPT, the central (low-deformed) part of each disk (about 3 mm in diameter) was excluded from further investigations. The samples for structural investigations were cut from the deformed disks at a distance of 45 mm from the sample center. For this distance the shear strain is ³6. Scanning electron microscopy (SEM) investigations were carried out in a Tescan Vega TS5130 MM microscope equipped by the LINK energy-dispersive spectrometer produced by Oxford Instruments. Using the same equipment, the composition of various structural elements in as-cast samples was controlled with the aid of electron probe
Special Issue on Advanced Materials Science in Bulk Nanostructured Metals
microanalysis. X-ray diffraction (XRD) data were obtained on a Siemens diffractometer (Fe K¡radiation). Transmission electron microscopy (TEM) investigations were carried out on a JEM4000FX microscope with an accelerating voltage of 400 kV. Grain size was estimated by the XRD line broadening and using the Scherer formula.56)
3. Results
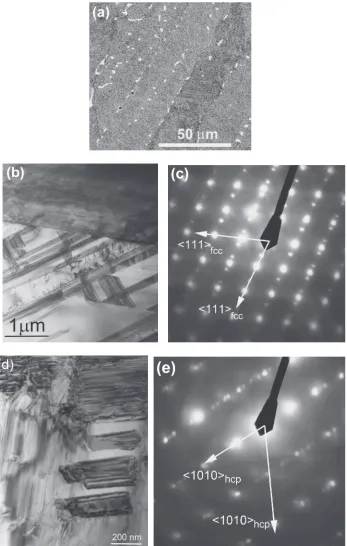
The as-cast alloys prior to the HPT-treatment exhibited a coarse-grained microstructure. They consisted of a super-saturated (Co) solid solution containing 5 and 12 mass%Cu, respectively, and of (Cu)-precipitates. The SEM micrograph in Fig. 1(a) shows the morphology of (Co) and (Cu) grains. The grains in the (Co) matrix [appear dark-grey in Fig. 1(a), different grains have slightly different color] are elongated perpendicular to the axis of the cast cylinders. The length of (Co) grains is about 100200 µm long, their width is³20 µm. The (Cu)-precipitates [appear light-grey in Fig. 1(a)] can be found mainly in the (Co)/(Co) grain boundaries. The width of (Cu)-precipitates is³2 µm, their length is about 220 µm. The morphology of the (Cu)-precipitates depends on the temperature, it is governed by the grain boundary (GB) wetting by a second solid phase and has been discussed elsewhere.57) The Cu content in (Co) solid solution was measured using the electron probe microanalysis. It has been also estimated by the XRD measurements of (Co) lattice constant using the available tabulated data. Both alloys first solidify as a (Co) solid solution. The (Cu)-phase starts to precipitate from the (Co) phase at 1100°C in the Co 5.6 mass% Cu alloy and at 970°C in the Co13.6 mass% Cu alloy, according to the CoCu phase diagram.55) Cu precipitated as elongated particles in the (Co) GBs. The amount of (Cu)-phase is higher in the Co13.6 mass%Cu alloy, compared to that of the Co5.6 mass%Cu alloy. According to the XRD data the Co-matrix is a mixture of metastable fcc ¡-Co and stable hcp ¾-Co [Figs. 2(a), 2(b)]. The intensity ratio of fcc¡-Co and hcp¾-Co diffraction lines [Fig. 2(a)] shows that the majority of grains in the Co-matrix are those of fcc ¡-Co (about 90%). The bright-field TEM-micrograph in Fig. 1(b) shows the microstructure of such fcc ¡-Co grain [the respective electron diffraction pattern is in Fig. 1(c)]. The bright-field TEM-micrograph in Fig. 1(d) shows the microstructure of such fcc ¾-(Co) grain [the respective electron diffraction pattern is in Fig. 1(e)]. No nanometer-sized (Cu) precipitates are present neither in ¡ -(Co) nor in ¾-(Co) grains [Figs. 1(b) and 1(d)]. Both¡-(Co) and¾-(Co) matrix grains contain numerous twins [Figs. 1(b) and 1(d)]. It is visible also in both diffraction patterns [Figs. 1(c) and 1(e)]. They contain the strong reflexes of the main grain and weak secondary reflexes from the twins.
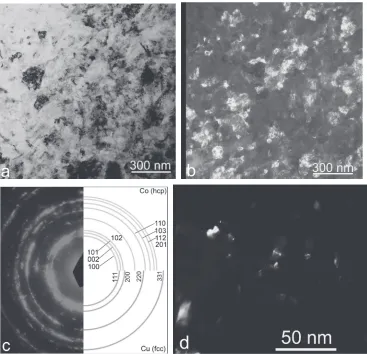
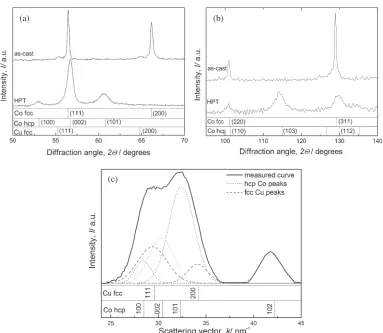
After HPT the mean grain size in both CuCo alloys drastically decreases by three orders of magnitude, with averages for Co-grains of about 100 nm and for Cu-grains of about 10 nm [see Figs. 2(b), 2(d)]. The distance between small Cu precipitates is about 40 nm. The weak Cu peaks clearly visible in the XRD patterns of the as-cast samples are broader after HPT and almost disappear from the diffraction patterns [Fig. 3(a)]. However, the formation of fine Cu particles in the samples after HPT can be seen in the
dependence of the electron diffraction intensity on the scattering vector [Fig. 3(c)]. Due to the small Cu concen-tration and hence low X-ray peak intensity, the size of Cu precipitates could only roughly be estimated to be around 10 nm. Dark-field TEM micrographs give similar Cu grain size values [Fig. 2(d)]. Moreover, the supersaturated solid solution completely decomposes: the Co-peaks in the as-cast alloys are shifted towards lower 2ª values in comparison to the pure fcc-Co. After HPT the Co-peaks are practically in the exact positions of pure hcp-Co [Figs. 3(a), 3(b)]. According to the shift of XRD peaks, the concentration of Cu in the Co-matrix after HPT is below 0.2 mass% in both alloys. Instead of supersaturated (Co) solid solutions, almost pure hcp ¾-Co is formed, which is an equilibrium phase below about 400°C, according to the CoCu phase diagram.55)It should be noted that under“normal”processing conditions (i.e. conventional casting) the fcc–hcp trans-formation in Co is suppressed due to the kinetic reasons.
4. Discussion
4.1 Accelerated diffusion in CoCu alloys
4.2 Effective temperature in the driven systems
Phase stability in driven systems is an important problem motivated both by its scientific interest and technological relevance. Atom movements caused by strong external forces can drive both accelerated diffusion and phase transforma-tions in the material. Historically, such unusual behavior was
first observed in the materials under severe irradiation.60) G. Martin proposed the simplified mean-field description of solid solutions subjected to irradiation-induced atomic
mixing.61)His main idea was that the forced mixing induced by irradiation emulates the increase of entropy and changes the thermodynamic potentials in the alloy. In a simple case of regular solution in the Bragg–Williams approximation a law of corresponding states was formulated: The equilibrium configuration of the solid under irradiation flux ¤ at temperature T is identical to the configuration at¤=0 and a certain effective temperature
[image:3.595.128.475.69.615.2]Teff¼Tð1þÞ: ð1Þ
If the irradiation-driven movements of atoms are similar in amplitude to conventional diffusion jumps, they can be described by the “ballistic” diffusion coefficient Dball and
¦=Dball/Db, where Db is conventional bulk diffusion coefficient, possibly increased due to the non-equilibrium defect concentration.61) It means that one can use the equilibrium phase diagram for the description of the system under irradiation, but atTeffinstead of the actual temperature
T. For example, if the liquid phase is present in the phase diagram at Teff, the amorphous phase would appear under irradiation.61,62)
Later the approach based on a competition between cascade mixing and thermally activated demixing was further developed and extended.6365)Several authors observed also that many reactions are not governed by purely thermal effects. Rather, their observations suggest the occurrence of coupled mechanical and chemical effects like in cases of allotropic transformation of fcc cobalt powders to the hcp phase,66) formation of supersaturated solid solutions,67,68) amorphization,69) and nanocrystallization of amorphous alloys70) during ball milling (mechanical alloying). The powder particles during ball milling collide stochastically with each other and with milling bodies. The main deformation mode is the periodical compression. The degree
and type of plastic deformation introduced in the material is difficult to control. Later a number of severe plastic deformation techniques were developed, in which the main deformation mode is a simple shear.71,72)For example, HPT, equal channel angular pressing (ECAP) and twist extrusion (TE) allow introducing a controlled (and practically un-limited) amount of shear strain in the material, which is quite important for the development of the physical model of the process.71,72) However, the numerous phase transformations observed under HPT, ECAP or TE do not follow, on the
first glance, any simple regularities. In this paper we will demonstrate that the approach based on the Martin’s model can explain and also predict the behavior of the materials subjected to the severe plastic shear.
4.3 Applicability of the concept of effective temperature for the SPD-driven diffusion
In the present work we observed a complete (or almost complete) transformation of the fcc¡-Co into hcp¾-Co. On the other hand, in a number of other works an incomplete transformation, or even a reverse¡-¾transformation at large strains were observed.73) In this work the high pressure torsion of the CoCu alloys leads to the (1) full decom-position of the supersaturated (Co) solid solution, and to the (2) formation of low-temperature Co allotrope. The hexagonal closely-packed ¾-Co is stable below 422°C. The
[image:4.595.114.481.69.423.2]face-centered cubic ¡-Co, stable above 422°C completely disappears during HPT. The phases remaining in the studied alloys after SPD (pure ¾-Co and Cu) can be found in the equilibrium CoCu phase diagram below 422°C. In order to exclude this uncertainty in the Teff, and because of the very high diffusivity during SPD (see Section 4.1), we set the effective temperature of the HPT treatment of this system close to the equilibrium ¡¾transformation temperature, i.e.
Teff=400°C. The large initial Cu precipitates in the as cast alloy completely disappeared after HPT. It means that the intensity of forced mixing caused by shear strain is comparable with that of the diffusion-controlled precipitation. In other words, the Martin’s approach is applicable.61)
We can further check the applicability of the Martin’s law (1) to the forced diffusion driven by pure shear deformation. For this purpose, the experiments where HPT led to the phase transformations have been analyzed. We found the data in the literature where (i) HPT was performed in similar conditions at 46 GPA with 46 torsions, (ii) the phases appeared after HPT were different from those before HPT and (iii) the phases before and after HPT can be easily localized in the phase diagrams.
The composition of the phases after SPD allows to localize those phases in the respective equilibrium phase diagram and to estimate the effective temperature Teff. Such a schematic diagram is shown in Fig. 4. The data concerning different
alloys and used for drawing this scheme are given in the Table 1. In Fig. 4 the dashed vertical lines denote compo-sitions of various alloys. Figurative points corresponding to
(a) (b)
(c)
Fig. 3 XRD spectra for the as-cast Co13.6 mass%Cu alloy (top) and after HPT (bottom) for the medium (a) and high (b) diffraction angles 2ª. The positions and indices of XRD lines for hcp-Co, fcc-Co and fcc-Cu are shown at the bottom of each spectrum. In the as-cast state only fcc-Co is present. After HPT only hcp-Co is present in the alloy. Low-intensity Cu peaks are visible in the as-cast state. After HPT, Cu can be detected in the intensity distribution of diffracted electrons (c). The peak deconvolution (performed by the ORIGIN software) permits to resolve the individual contributions of fcc copper and hcp cobalt.
L
αα
γ
δ
β
1
2 3
4
5
6
L +L1 2
A %B B
T
emperature
x
x x
x x
a b
cx d
e
f
x
g
x x
x x
hi j k
7 8
9
10
γ
[image:5.595.107.490.64.397.2] [image:5.595.318.536.478.687.2]the effective temperature of the alloys are indicated by an open circle and numbered. Each star with a letter indicates the composition and temperature of an alloy’s treatment (normal cooling, SPD or rapid quenching). For example, the results of the current work on HPT of CoCu alloys are
schematically shown by the points a,b and 2 (Fig. 4). The composition of the supersaturated solid solution of the component B in£-phase of A corresponds to the pointb. This undercooled supersaturated solid solution in the metastable£ -phase is HPT-treated in the point a. After HPT the almost
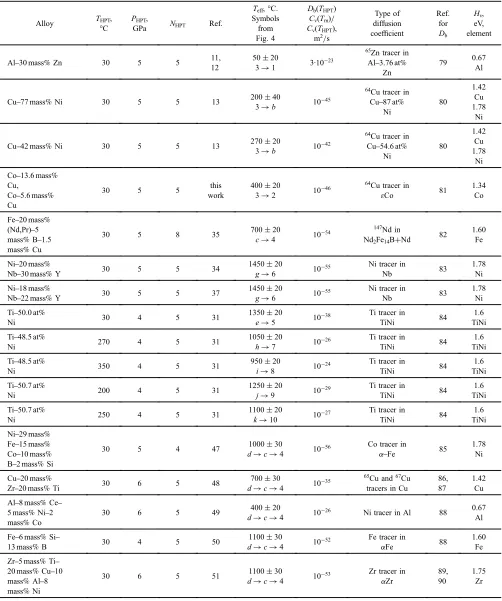
Table 1 Parameters of the Martin law for SPD (Fig. 4).Teffvalues are calculated in this work. Respective symbols for the phases before
and after HPT (from Fig. 4) are given together withTeff in the same column. The formation enthalpiesHv for the estimation of
concentration of thermal vacanciesCvwere taken from Ref. 78).
Alloy THPT, °C
PHPT,
GPa NHPT Ref.
Teff, °C.
Symbols from Fig. 4
Db(THPT) Cv(Tm)/ Cv(THPT),
m2/s
Type of diffusion coefficient
Ref. for Db Hv, eV, element
Al30 mass%Zn 30 5 5 11,
12
50«20
3¼1 3·10¹23
65Zn tracer in
Al3.76 at% Zn
79 0.67
Al
Cu77 mass%Ni 30 5 5 13 200«40
3¼b 10¹45
64Cu tracer in
Cu87 at% Ni 80 1.42 Cu 1.78 Ni
Cu42 mass%Ni 30 5 5 13 270«20
3¼b 10¹42
64Cu tracer in
Cu54.6 at% Ni 80 1.42 Cu 1.78 Ni
Co13.6 mass% Cu,
Co5.6 mass% Cu
30 5 5 this
work
400«20
3¼2 10
¹46 64Cu tracer in
¾Co 81
1.34 Co
Fe20 mass% (Nd,Pr)5 mass%B1.5 mass%Cu
30 5 8 35 700«20
c¼4 10¹54
147Nd in
Nd2Fe14B+Nd
82 1.60
Fe
Ni20 mass%
Nb30 mass%Y 30 5 5 34
1450«20
g¼6 10
¹55 Ni tracer in
Nb 83
1.78 Ni
Ni18 mass%
Nb22 mass%Y 30 5 5 37
1450«20
g¼6 10
¹55 Ni tracer in
Nb 83
1.78 Ni
Ti50.0 at%
Ni 30 4 5 31
1350«20
e¼5 10
¹38 Ti tracer in
TiNi 84
1.6 TiNi
Ti48.5 at%
Ni 270 4 5 31
1050«20
h¼7 10
¹26 Ti tracer in
TiNi 84
1.6 TiNi
Ti48.5 at%
Ni 350 4 5 31
950«20
i¼8 10¹24
Ti tracer in
TiNi 84
1.6 TiNi
Ti50.7 at%
Ni 200 4 5 31
1250«20
j¼9 10
¹29 Ti tracer in
TiNi 84
1.6 TiNi
Ti50.7 at%
Ni 250 4 5 31
1100«20
k¼10 10¹27
Ti tracer in
TiNi 84
1.6 TiNi
Ni29 mass% Fe15 mass% Co10 mass% B2 mass%Si
30 5 4 47 1000«30
d¼c¼4 10
¹56 Co tracer in
¡Fe 85
1.78 Ni
Cu20 mass%
Zr20 mass%Ti 30 6 5 48
700«30
d¼c¼4 10¹35
65Cu and67Cu
tracers in Cu
86, 87
1.42 Cu
Al8 mass%Ce 5 mass%Ni2 mass%Co
30 6 5 49 400«20
d¼c¼4 10¹26 Ni tracer in Al 88
0.67 Al
Fe6 mass%Si
13 mass%B 30 4 5 50
1100«30
d¼c¼4 10¹52
Fe tracer in
¡Fe 88
1.60 Fe
Zr5 mass%Ti 20 mass%Cu10 mass%Al8 mass%Ni
30 6 5 51 1100«30
d¼c¼4 10¹53
Zr tracer in
¡Zr
89, 90
[image:6.595.48.550.104.705.2]pure ¡-phase of A is formed as a consequence of £¡ transition. It corresponds to the point 2. The respective
Teff=400°C for the CoCu system. In a similar way theTeff was calculated (Table 1) for the formation210) or decom-position1113) of a supersaturated solid solution, dissolution of phases,1526)disordering of ordered phases,1729) amorph-ization of crystalline phases,3038) synthesis of the low-temperature,19,26)high-temperature3941)or high-pressure4246) allotropic modifications, and nanocrystallization in the amorphous matrix.4754)
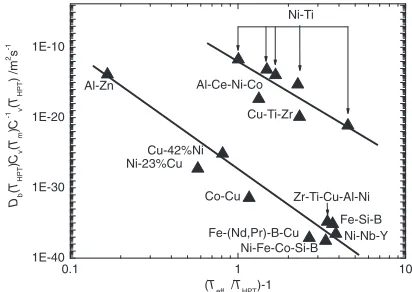
Do the values of Teff estimated in such a way and the values of Db estimated by the extrapolation of bulk diffusivities to the temperature of the HPT-treatment, THPT, follow the Martin’s law (1)? To account for acceleration of bulk diffusion by HPT, we multiplied the values ofDbby an enhancement factorCv(Tm)/Cv(THPT) (hereTmis the melting temperature of the material andCvis the equilibrium vacancy concentration at respective temperature). This renormaliza-tion of Db is based on the assumption, that a maximum concentration of vacancies, which can be sustained by a crystal lattice, equals to the equilibrium vacancy concen-tration at the melting point of the crystal.74) Indeed, the extremely high excess vacancy concentration, which is usually achieved at thermal equilibrium near the melting point, was observed in situ during HPT of Cu using high-energy synchrotron light.75) Thus, this enhancement factor provides an upper bound for the diffusion acceleration caused by the non-equilibrium vacancies produced by HPT. In Fig. 5 the Teff,THPTand renormalizedDb values are plotted in the Martin’s coordinates log(Db)¹log[(Teff/THPT)¹1]. The data indeed group along two straight lines with negative slope. It means that even the simplest approximation (1) properly describes the behaviour of various alloys subjected to HPT. For our compilation, we only selected the experimental data from the works, in which the HPT treatment with similar processing parameters was employed (simple shear, 46 GPa pressure, 57 torsions). In this case one can expect thatDHPT is also similar in all experiments. It is because the physical mechanism of the intermixing induced by plastic shear is a roughening of the bi-material interface, which is kinematic in nature (i.e. controlled mainly by slip geometry), and is a weak function of the other material constants.76) Physical meaning of a plot in Fig. 5 is very simple: if the coefficient of conventional diffusion Dbis low at the temperature of HPT treatment, the ratio DHPT/Db is high, and Teff is also high. However, it is remarkable that the points in Fig. 5 group along two separate straight lines. The difference between these two lines is about 1015 orders of magnitude. Most probably it is because the HPT-forced intermixing of atoms can be either uniform throughout the whole volume, or localised. For example, the deformation-induced intermixing may be localised along certain GBs, which exhibit an ultra-high diffusivity in the radiotracer experiments performed after SPD.77) Two lines in the Martin’s plot (Fig. 5) could be the evidence of the localized high diffusivity along the short-circuit diffusion paths formed during SPD.
The main idea of the Martin’s approach is that the external influence on a material changes its thermodynamic poten-tials.61) It means that the state of the material being under the external influence should be described by a new,
non-equilibrium phase diagram. In case of irradiation, the material is not far from equilibrium, the forced atomic movements are similar to those during conventional entropy-driven diffusion, and the system can easily be described by an equilibrium phase diagram, however, not at the treatment temperature, but at a certain effective temperatureTeff.62,63)In case of SPD, it is already not so obvious that the deformation-driven atomic movements are similar to the atomic diffusion jumps. It means that the applicability of a central Martin’s equation (1) becomes questionable. Nevertheless, the main idea of the Martin’s approach remains valid. In other words, the external influence on a material (deformation, stresses, collisions, high concentration of defects like vacancies, interstitials, disloca-tions, disclinations etc.) changes the phase diagram drasti-cally. The problem is that this (changed) phase diagram is unknown, and the only instrument which remains in our hands is still the equilibrium phase diagram. And even when the Martin’s approach is not exactly applicable, we still are able to find the phases, appeared after SPD, in the equilibrium phase diagram and assign them a certain
“effective temperature”. Such attempt has been performed in this work, and it is visible, indeed, that if the conventional diffusivity is low, the phases formed during SPD can be found at highTeff. Visa versa, if the conventional diffusivity is high, the Teffis low and close to the SPD temperature.
5. Conclusions
(1) The high pressure torsion of the CoCu alloys leads to the full decomposition of the supersaturated (Co) solid solution and to the formation of low-temperature Co allotrope, namely the hexagonal closely-packed ¾-Co, stable below 422°C. The face-centered cubic ¡-Co, stable above 422°C completely disappears during HPT; (2) the phases remaining in the studied alloys after SPD (pure¾-Co and Cu) can be found in the equilibrium CoCu phase diagram below 422°C; (3) the structure and composition of phases remaining in the other alloys after SPD also permit to attribute to SPD process a certain effective temperatureTeffby comparing the structure and composition of phases formed after SPD with those determined from an equilibrium phase diagram; (4) it is because, like in the case of irradiated materials, the SPD-driven atom movements can modify the parameters of phase
10 1
1 . 0 1E-40 1E-30 1E-20 1E-10
Al-Ce-Ni-Co
Cu-Ti-Zr Ni-Ti
Ni-Nb-Y Fe-Si-B Zr-Ti-Cu-Al-Ni
Ni-Fe-Co-Si-B Fe-(Nd,Pr)-B-Cu Co-Cu Ni-23%Cu
Cu-42%Ni Al-Zn
Db
(
THPT
)
Cv
(
Tm
)
C
-1 v
(
THPT
) /m
2s
-1
(Teff /THPT)-1
[image:7.595.323.529.70.216.2]equilibrium in the material during processing, and those changes in turn are equivalent to the increase of the temperature; (5) the Teff scales inversely with the bulk diffusivity; (6) there are two different mechanisms of SPD-driven diffusion (most probably, the atom movements can be homogeneous throughout the bulk, or highly localized in certain grain boundaries); (7) thus, the concept of effective temperature originally developed for materials under irradi-ation is also applicable to the SPD, and this concept allows a prediction of the structure and composition of phases formed during SPD.
Acknowledgements
The investigations were partly supported by Russian Foundation for Basic Research (contracts 09-03-92481, 11-03-00029 and 11-08-90439) and Israel Ministry of Science (contract 3-5790). Authors cordially thank Prof. A. M. Gusak for stimulating discussions.
REFERENCES
1) X. Sauvage, A. Chbihi and X. Quelennec:J. Phys.240(2010) 012003.
2) H. W. Zhang, S. Ohsaki, S. Mitao, M. Ohnuma and K. Honoa:Mater. Sci. Eng. A421(2006) 191199.
3) W. Lojkowski, M. Djahanbakhsh, G. Burkle, S. Gierlotka, W. Zielinski and H. J. Fecht:Mater. Sci. Eng. A303(2001) 197208.
4) K. Hono, M. Ohnuma, M. Murayama, S. Nishida, A. Yoshie and T. Takahashi:Scr. Mater.44(2001) 977983.
5) A. Taniyama, T. Takayama, M. Arai and T. Hamada:Scr. Mater.51 (2004) 5358.
6) V. G. Gavriljuk:Mater. Sci. Eng. A345(2003) 8189.
7) X. Sauvage, X. Quelennec, J. J. Malandain and P. Pareige:Scr. Mater. 54(2006) 10991103.
8) V. A. Teplov, V. P. Pilugin, V. S. Gaviko and E. G. Chernyshov:Phil. Mag. B68(1993) 877881.
9) V. V. Stolyarov, R. Lapovok, I. G. Brodova and P. F. Thomson:Mater. Sci. Eng. A357(2003) 159167.
10) X. Sauvage, F. Wetscher and P. Pareige:Acta Mater.53(2005) 2127 2135.
11) B. B. Straumal, B. Baretzky, A. A. Mazilkin, F. Phillipp, O. A. Kogtenkova, M. N. Volkov and R. Z. Valiev:Acta Mater.52(2004) 44694478.
12) A. A. Mazilkin, B. B. Straumal, E. Rabkin, B. Baretzky, S. Enders, S. G. Protasova, O. A. Kogtenkova and R. Z. Valiev:Acta Mater.54 (2006) 39333939.
13) B. B. Straumal, S. G. Protasova, A. A. Mazilkin, E. Rabkin, D. Goll, G. Schütz, B. Baretzky and R. Z. Valiev:J. Mater. Sci.47(2012) DOI: 10.1007/s10853-011-5805-0.
14) C. M. Cepeda-Jiménez, J. M. García-Infanta, A. P. Zhilyaev, O. A. Ruano and F. Carreño:J. Alloy. Compd.509(2011) 636643.
15) Y. Ivanisenko, I. MacLaren, X. Sauvage, R. Z. Valiev and H.-J. Fecht:
Acta Mater.54(2006) 16591669.
16) X. Sauvage and Y. Ivanisenko:J. Mater. Sci.42(2007) 16151621.
17) Y. Ivanisenko, W. Lojkowski, R. Z. Valiev and H. J. Fecht:Acta Mater. 51(2003) 55555570.
18) V. V. Sagaradze, S. V. Morozov, V. A. Shabashov, L. N. Romashev and R. I. Kuznetsov: Phys. Met. Metall.66(1988) 328338.
19) B. B. Straumal, A. A. Mazilkin, S. G. Protasova, S. V. Dobatkin, A. O. Rodin, B. Baretzky, D. Goll and G. Schütz:Mater. Sci. Eng. A503 (2009) 185189.
20) V. V. Sagaradze and V. A. Shabashov: Nanostruct. Mater.9(1997) 681684.
21) M. Murayama, K. Hono and Z. Horita: Mater. Trans. JIM40(1999) 938941.
22) S. Ohsaki, S. Kato, N. Tsuji, T. Ohkubo and K. Hono:Acta Mater.55
(2007) 28852895.
23) X. Sauvage and R. Pippan:Mater. Sci. Eng. A410411(2005) 345 347.
24) X. Sauvage, C. Genevois, G. Da Costa and V. Pantsyrny:Scr. Mater.61 (2009) 660663.
25) X. Sauvage, W. Lefebvre, C. Genevois, S. Ohsaki and K. Hono:Scr. Mater.60(2009) 10561061.
26) B. B. Straumal, S. V. Dobatkin, A. O. Rodin, S. G. Protasova, A. A. Mazilkin, D. Goll and B. Baretzky:Adv. Eng. Mater.13(2011) 463 469.
27) A. V. Korznikov, O. Dimitrov, G. F. Korznikova, J. P. Dallas, A. Quivy, R. Z. Valiev and A. Mukherjee:Nanostruct. Mater.11(1999) 1723.
28) A. V. Korznikov, G. Tram, O. Dimitrov, G. F. Korznikova, S. R. Idrisova and Z. Pakiela:Acta Mater.49(2001) 663671.
29) C. Rentenberger and H. P. Karnthaler:Acta Mater.56(2008) 2526 2530.
30) A. V. Sergueeva, C. Song, R. Z. Valiev and A. K. Mukherjee:Mater. Sci. Eng. A339(2003) 159165.
31) S. D. Prokoshkin, I. Yu. Khmelevskaya, S. V. Dobatkin, I. B. Trubitsyna, E. V. Tatyanin, V. V. Stolyarov and E. A. Prokofiev:Acta Mater.53(2005) 27032714.
32) X. Sauvage, L. Renaud, B. Deconihout, D. Blavette, D. H. Ping and K. Hono:Acta Mater.49(2001) 389394.
33) T. Miyazaki, D. Terada, Y. Miyajima, C. Suryanarayana, R. Murao, Y. Yokoyama, K. Sugiyama, M. Umemoto, T. Todaka and N. Tsuji:
J. Mater. Sci.46(2011) 42964301.
34) A. A. Mazilkin, G. E. Abrosimova, S. G. Protasova, B. B. Straumal, G. Schütz, S. V. Dobatkin and A. S. Bakai:J. Mater. Sci.46(2011) 4336 4342.
35) V. V. Stolyarov, D. V. Gunderov, A. G. Popov, V. S. Gaviko and A. S. Ermolenko:J. Alloy. Compd.281(1998) 6971.
36) Y. Matsuura, S. Hirosawa, H. Yamamoto, S. Fujimira, M. Sagawa and K. Osamura:Jpn. J. Appl. Phys. Part 2Lett.24(1985) L635L637.
37) B. B. Straumal, A. A. Mazilkin, S. G. Protasova, D. Goll, B. Baretzky, A. S. Bakai and S. V. Dobatkin: Kovove Mater. Metall. Mater. 49 (2011) 1722.
38) Á. Révész, S. Hóbor, J. L. Lábár, A. P. Zhilyaev and Zs. Kovácz:
J. Appl. Phys.100(2006) 103522.
39) I. MacLaren, Y. Ivanisenko, R. Z. Valiev and H. J. Fecht:J. Phys.26 (2006) 335338.
40) Y. Ivanisenko, I. MacLaren, X. Sauvage, R. Z. Valiev and H. J. Fecht:
High Pressure Technology of Nanomaterials, Book series Sol. State Phenom.114(2006) 133144.
41) Y. Ivanisenko, I. MacLaren, X. Sauvage, R. Z. Valiev and H. J. Fecht:
Acta Mater.54(2006) 16591669.
42) A. P. Zhilyaev, I. Sabirov, G. González-Doncel, J. Molina-Aldareguía, B. Srinivasarao and M. T. Pérez-Prado:Mater. Sci. Eng. A528(2011) 34963505.
43) A. P. Zhilyaev, A. V. Sharafutdinov and M. T. Pérez-Prado:Adv. Eng. Mater.12(2010) 754757.
44) A. P. Zhilyaev, F. Gálvezc, A. V. Sharafutdinov and M. T. Pérez-Prado:
Mater. Sci. Eng. A527(2010) 39183928.
45) M. T. Pérez-Prado, A. V. Sharafutdinov and A. P. Zhilyaev:Mater. Lett. 64(2010) 211214.
46) M. T. Pérez-Prado and A. P. Zhilyaev:Phys. Rev. Lett.102(2009) 175504.
47) A. M. Glezer, M. R. Plotnikova, A. V. Shalimova and S. V. Dobatkin:
Bull. Russ. Ac. Sci. Phys.73(2009) 12331236.
48) S. Hóbor, Á. Révész, A. P. Zhilyaev and Zs. Kovácz: Rev. Adv. Mater. Sci.18(2008) 590592.
49) Zs. Kovács, P. Henits, A. P. Zhilyaev and Á. Révész:Scr. Mater.54 (2006) 17331737.
50) G. E. Abrosimova, A. S. Aronin, S. V. Dobatkin, S. D. Kaloshkin, D. V. Matveev, O. G. Rybchenko, E. V. Tatyanin and I. I. Zverkova:
J. Metastab. Nanocryst. Mater.24(2005) 6972.
51) Á. Révész, E. Schafler and Zs. Kovács:Appl. Phys. Lett.92(2008) 011910.
52) S. Hóbor, Zs. Kovács, A. P. Zhilyaev, L. K. Varga, P. J. Szabó and Á. Révész:J. Phys.240(2010) 012153.
54) P. Henits, Á. Révész, A. P. Zhilyaev and Zs. Kovács:J. Alloy. Compd. 461(2008) 195199.
55) T. B. Massalski (ed.):Binary Alloy Phase Diagrams, 2nd ed. (ASM International, Materials Park, OH, 1990).
56) T. Ungar and A. Borbely:Appl. Phys. Lett.69(1996) 31733175.
57) B. B. Straumal, O. A. Kogtenkova, A. B. Straumal, Yu. O. Kuchyeyev and B. Baretzky:J. Mater. Sci.45(2010) 42714275.
58) E. Rabkin, H. S. Nam and D. Srolovitz:Acta Mater.55(2007) 2085 2099.
59) G. Neumann and V. Tolle:Phil. Mag. A57(1988) 621630.
60) K. C. Russell:Progr. Mater. Sci.28(1984) 229434.
61) G. Martin:Phys. Rev. B30(1984) 14241436.
62) G. Thomas, H. Mori and H. Fujita:Scr. Metall.16(1982) 589592.
63) J. M. Roussel and P. Bellon:Phys. Rev. B65(2002) 144107.
64) L. C. Wei and R. S. Averback:J. Appl. Phys.81(1997) 613623.
65) F. Soisson, P. Bellon and G. Martin:Phys. Rev. B46(1992) 11332 11345.
66) F. Delogu:Scr. Mater.58(2008) 126129.
67) F. Delogu:Mater. Chem. Phys.115(2009) 641644.
68) S. Q. Xi, K. S. Zuo, X. G. Li, G. Ran and J. Zhou:Acta Mater.56 (2008) 60506060.
69) H. W. Sheng, K. Lu and E. Ma:J. Appl. Phys.85(1999) 64006407.
70) W. H. Jiang and M. Atzmon:Scr. Mater.54(2006) 333336.
71) R. Z. Valiev and T. G. Langdon:Progr. Mater. Sci.51(2006) 881981.
72) R. Z. Valiev, Y. Estrin, Z. Horita, T. G. Langdon, M. J. Zehetbauer and Y. T. Zhu:JOM4(2006) 3339.
73) J. Y. Huang, Y. K. Wu and H. Q. Ye:Acta Mater.44(1996) 12011209.
74) Q. S. Mei and K. Lu:Progr. Mater. Sci.52(2007) 11751262.
75) A. R. Kilmametov, G. Vaughan, A. R. Yavari, A. LeMoule, W. J. Botta
and R. Z. Valiev:Mater. Sci. Eng. A503(2009) 1013.
76) P. Bellon and R. S. Averback:Phys. Rev. Lett.74(1995) 18191822.
77) Y. Amouyal, S. V. Divinski, Y. Estrin and E. Rabkin:Acta Mater.55 (2007) 59685979.
78) H.-E. Schaefer:Phys. Stat. Sol. A102(1987) 4765.
79) D. L. Beke, I. Godeny and F. J. Kedves:Philos. Mag. A47(1983) 281 289.
80) D. B. Butrymowicz, J. R. Manning and M. E. Read:Diffusion Rate Data and Mass Transport Phenomena for Copper Systems, INCRA Monograph V, (National Bureau of Standarts, Washington, 1977). 81) K.-I. Hirano, R. P. Agarwala, B. L. Averbach and M. J. Cohen:Appl.
Phys.33(1962) 30493051.
82) W. Sprengel, S. Herth, V. Barbe, H.-E. Schaefer, T. Wejrzanowski, O. Gutfleisch and R. Würschum:J. Appl. Phys.98(2005) 074314.
83) R. P. Agarwala and K.-I. Hirano: Trans. Jpn. Inst. Met.13(1972) 425 427.
84) S. V. Divinski, I. Stloukal, L. Kral and Chr. Herzig: Def. Diff. Forum 289292(2008) 377382.
85) K.-I. Hirano and Y. Iijima: Def. Diff. Forum6669(1989) 10391044. 86) K. Maier:Phys. Stat. Sol. A44(1977) 567576.
87) S. Fujikawa and K. I. Hirano: Proc. Yamada 5th Conf. on Point Defects and Defect Interactions in Metals, eds by J. I. Takamura, M. Doyama, M. Kiritani, (The University of Tokyo Press, Tokyo, 1982) p. 554. 88) G. Erdelyi, D. L. Beкe, F. J. Kedves and I. Godeny:Philos. Mag. B38
(1978) 445462.
89) H. Mehrer and M. Lübbehusen: Def. Diff. Forum6669(1989) 591 596.