Effect of Iron Content on Hot Tearing of High-Strength Al-Mg-Si Alloy
Hiromi Nagaumi
1, Satoru Suzuki
1, Toshimitsu Okane
2and Takateru Umeda
3;*1Nikkei Research & Development Center (NRDC), Nippon Light Metal Company Ltd., Shizuoka 421-3291, Japan
2Digital Manufacturing Research Center, National Institute of Advanced Industrial Science and Technology (AIST),
Tsukuba 305-8564, Japan
3Department of Metallurgical Engineering, Faculty of Engineering, Chulalongkorn University, Bangkok, Thailand
The effect of iron content on hot tearing of the high-strength Al-Mg-Si alloy was systematically investigated. The alloy with higher content of iron resulted in the severe occurrence of hot tearing during direct chill (DC) casting. Mechanical properties of this alloy in which iron content was changed were investigated during solidification using an electromagnetic induction heating tensile machine. Tensile strength and elongation were discussed in relation with solidification progress of which sequence of crystallization, crystallization temperature of formed phases and their crystallized amount were calculated by a thermodynamic calculation software Thermo-Calc. In order to confirm the calculation results of solidification path, a quenching test also was carried out. Furthermore, by comparing the fracture surfaces of the tensile testing sample and DC billet, the temperature range of crack initiation of the alloy was examined. Comparing the temperature range of crack initiation with the crystallization phase and its crystallization order, iron content influenced hot tearing significantly owing to the crystallization behavior of
(AlFeMn) in high-strength Al-Mg-Si alloy. [doi:10.2320/matertrans.47.2821]
(Received July 3, 2006; Accepted September 11, 2006; Published November 15, 2006)
Keywords: hot tearing, tensile strength, crack susceptibility, iron content, intermetallic compound, solidification path
1. Introduction
A major problem among aluminum alloy processing is hot tearing during casting because the crack is a serious factor which inhibits the productivity. Investigations on hot tearing
have been reported in many previous studies1–12) and it is
clear that the hot tearing is generated when stress prevents the contraction of the alloy at the temperature near the solidus. When the alloy has a wide solidification temperature range and a small amount of liquid, the hot tearing is easy to occur. Alloy composition is also important to the crack
susceptibil-ity. For example, Spittle and Cushway13) measured the hot
tearing susceptibilities of Al-Cu alloys (0–15%Cu), and found that the hot tearing susceptibility decreased with increasing copper content, because at higher copper compo-sition, a high volume fraction of eutectic liquid existed and resulted in ensuring interdendritic feeding and healing of
tears. Oyaet al.14)investigated hot tearing tendency of Al-(0–
33%) Cu and Al-(0–13%) Si alloys, and they also found the hot tearing tendency was decreased as the Cu and Si content
increased. Oya’s group15)also investigated the effect of third
element addition on hot tearing of binary Al-4.5%Cu alloy, and they found that Ti, Mg and Si improved the resistance to hot tearing, but Sn, Zn, Fe, and Ni had poor resistance. These studies mentioned above were, however, based on binary alloys, and very few studies based on commercial aluminum alloys were reported.
In this study, the effect of iron content on hot tearing of the newly commercially developed high-strength Al-Mg-Si alloy was systematically investigated. Higher iron content caused hot tearing easily. In order to understand the hot tearing of this alloy, mechanical properties during solidification, the solidification behavior and their relationship were investigated. The intermetallic compound including iron,
(AlFeMn) compound, was found to play a vitally important
role to hot tearing.
2. Experimental Methods 2.1 Casting experiment
The material used for this study was a high strength Al-Mg-Si alloy (called as HS65) which contained different content of iron. Billets of the high strength Al-Mg-Si alloys with the diameter of 325 mm were cast by the typical DC caster under following conditions: Casting temperature; 993 K, Casting speed; 55 mm/min, Metal level; 15 mm and Water supply; 150 l/min. Chemical compositions of cast billet are given in Table 1. In comparison with previously
reported alloy (HS60),11,16) Magnesium, silicon and copper
contents in this alloy were decreased from 1.12 to 0.83 mass%, from 1.23 to 1.0 mass% and from 0.79 to 0.40 mass%, respectively, to reduce the hot tearing. The samples for microstructure observation were taken from the billet after casting and the crystallized phases were investigated by X-ray diffraction method (XRD) and electron probe micro analysis (EPMA).
2.2 Thermodynamic calculation
Diffusion in solid for DC casting was so slow, in general, that the Gulliver-Scheil model which neglects diffusion in solid could be used for calculating solidification path, because the error was regarded as being little in a range of
cooling rate of usual casting.17)In this study, the commercial
[image:1.595.305.549.348.401.2]database software Thermo-Calc was used to calculate the solidification path under the non-equilibrium condition which was, however, supposed to be a local equilibrium at
Table 1 Chemical composition of high-strength Al-Mg-Si alloys.
Alloy Si Fe Cu Mg Mn Cr Ti
A 1.0 0.25 0.40 0.83 0.37 0.27 0.02
B 1.0 0.18 0.40 0.83 0.37 0.27 0.02
C 1.0 0.15 0.40 0.83 0.37 0.27 0.02
solid/liquid interface. The change of solidification path was simulated using the Gulliver-Scheil model owing to iron content from 0.1 to 0.3% (in mass%) based on the reference of B alloy as shown in Table 1.
2.3 Interrupted solidification
In order to confirm the calculation results of solidification path, an interrupted solidification technique was applied. Several temperatures in the alloy freezing range were selected to establish the phase formation of which phase was determined by EPMA and XRD. A sample with 7 mm in diameter and 5 mm in length was set up in furnace and then first heated up to 973 K and then kept for 10 min. Next, it was cooled at a rate of 1 K/s to the test temperature before quenching. When temperature was reached to the prescribed one, the sample was kept for 30 s and then dropped into the water bath for quenching. The temperature control was carried out by the thermocouple installed at the molten zone of the sample and the cooling rate was over 150 K/s during quenching. Quenched samples were mechanically polished, etched for microstructure observation and then supplied to EPMA analysis.
2.4 Semi-solid tensile test
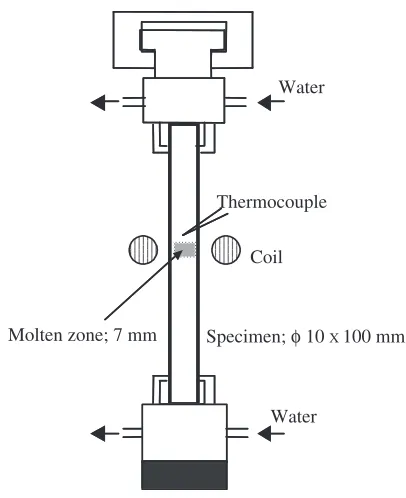
A remelting type of high temperature tensile test during solidification was carried out by using the high temperature tensile test equipment with induction heating. Schematic diagram of high temperature tensile testing machine is shown in Fig. 1. At first, the specimen was heated up to temperature above its liquidus temperature and then kept for a certain period of time. Next, it was cooled down to the test temperature at cooling rate 1 K/s. By this means, a solid-ification structure was obtained. Finally, tensile load was
applied at strain rate 102s1 and the load-displacement
relation was recorded. Test sample had diameter of 10 mm
and length of 100 mm. All the experiments were done under an argon atmosphere in the pressure of 0.1 MPa. Another experimental procedure, temperature measurement and its accuracy, evaluation of mechanical properties and etc. were
found in previous papers.11,12,18,19)
The fracture surfaces after tensile testing and the broken billets were observed by the secondary electron microscope (SEM).
3. Experimental Results
According to the casting results as shown in Table 2 the billet was found to be prone to crack in the descending order of composition A, composition B, and composition C. The composition A alloy showed the highest crack susceptibility because the crack was still generated even if the casting speed had changed to slower.
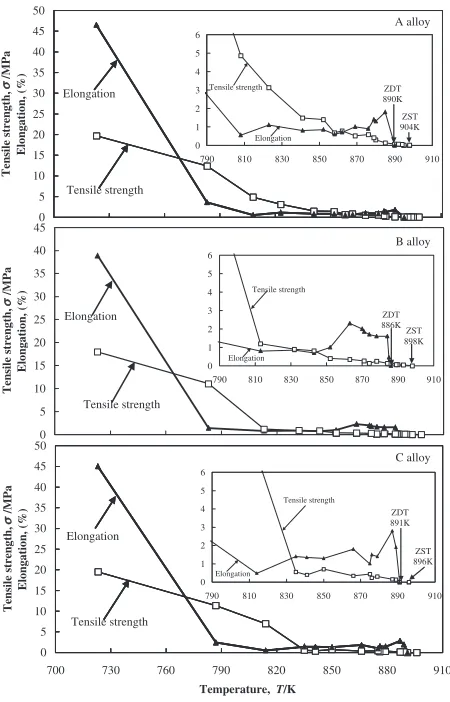
Figure 2 shows the relationship of tensile strength, elongation and temperature which was obtained by high temperature tensile test for A, B and C alloys. Zero Strength Temperature (ZST) is a minimum temperature above which shows no strength. ZST is 904, 898 and 896 K for A, B and C Alloys, respectively. Tensile strength of each alloy increases gradually from ZST with decreasing of temperature. Tensile strength, then, increases steeply from around 858 K for A alloy, 813 K for B alloy and 834 K for C alloy. The gradual increase rate of tensile strength with temperature from ZST to the temperature of steep increase is indeed small for each alloy, however, its value changes in proportion to iron content; A is highest, B medium and C lowest.
Zero Ductility Temperature (ZDT) is a minimum temper-ature above which shows no elongation. ZDT is 890, 886 and 891 K for A, B and C Alloys, respectively. As for the elongation each alloy shows a very small ductility from ZDT to 783 K so as the elongation is less 2%. Just lower than ZDT, at first, each alloy shows its small peak and then decreases with decreasing of temperature from its peak temperature and then increases sharply from about 783 K. The sharp increase temperature of elongation is lower than that of tensile strength.
ZST of each alloy is different from ZDT. They are 904 and 890 K for A alloy, 898 and 886 K for B alloy, 896 and 891 K for C alloy, respectively. Temperature difference between ZST and ZDT is 14, 12 and 5 K for A, B, and C alloys, respectively and alloy A is widest among the three alloys. Comparing with Table 2 it can be said that the crack susceptibility of this alloy corresponds to higher ZST, higher increase rate of tensile strength from ZST and wider temperature range between ZST and ZDT. The relation between mechanical properties and solidification progress will be discussed later.
Specimen; φ 10 X 100 mm
Water
Thermocouple
Coil
Molten zone; 7 mm
High resolution type of load cell; 5 kN Water
[image:2.595.65.268.68.317.2]Fig. 1 Schematic diagram of high temperature tensile testing machine.
Table 2 Casting results.
Casting speed (mm/min) A B C
70 crack crack crack
60 crack crack no crack
50 crack no crack no crack
[image:2.595.303.549.84.149.2]Figure 3 shows comparison of fracture surfaces between the broken billet and the tensile test at different temperatures of composition B alloy. The fracture surface of the broken billet as shown in a) has a rupture structure where intergranular fracture with remaining liquid around
interden-dritic regions was observed, namely the crack of this alloy occurs in the solid/liquid coexisting (mushy) state. The fracture surfaces of tensile testing at different temperature as shown in (b)–(f) show intergranular fracture with remaining liquid around interdendritic regions and there are many intermetallic compounds crystallized which are observed except the temperature of 885 K. As temperature decreases the fracture surface tends to flatten, the amount of interme-tallic compounds around grains increases. Comparing to the high temperature tensile test, the fracture surface of broken billet is well resembled with one after tensile test at temperature 868 K (see (c)) in Fig. 3, so it is considered that the crack of DC billet is generated around the temperature 868 K. The crack is easy to be generated around the temperature 868 K, because tensile strength and elongation of the alloy are very small around the temperature 868 K as show in Fig. 2.
SEM micrograph is shown in Fig. 4. The following
intermetallic constitutes are observed: (AlFeMn),
(AlFe-Si), Mg2Si, Si, Al5Cu2Mg8Si6and Al2Cu.(AlFeMn)
com-pound shows a needle shape morphology and (AlFeSi)
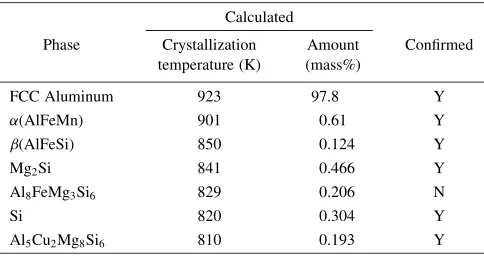
compound shows a needle and also Chinese script shapes. Figure 5 shows the calculated crystallization temperature of phases of B alloy by the Gulliver-Scheil model. Non-equilibrium solidification completion temperature and liq-uidus temperature are 783 and 923 K, respectively. As shown in Fig. 5, the phase formation sequence during solidification
is L!L + (Al)!L + (Al) +(AlFeMn)!L + (Al) +
(AlFeMn) + (AlFeSi) ! L + (Al) + (AlFeMn) +
(AlFeSi) + Mg2Si!L + (Al) +(AlFeMn) +(AlFeSi)
+ Mg2Si + Al8FeMg3Si6 ! L + (Al) + (AlFeMn) +
(AlFeSi) + Mg2Si + Al8FeMg3Si6 + Si ! L + (Al) +
(AlFeMn) +(AlFeSi) + Mg2Si + Al8FeMg3Si6 + Si +
Al5Cu2Mg8Si6 ! L + (Al) +(AlFeMn) +(AlFeSi) +
Mg2Si + Al8FeMg3Si6 + Si + Al5Cu2Mg8Si6 + Al2Cu.
Table 3 shows the crystallization temperature of phase
formed and its amount. The finally formed phase of Al2Cu
starts to crystallize at about 788 K and then the solidification
finishes at 783 K. (See also Al2Cu in Figs. 5 and 6.) By
0 5 10 15 20 25 30 35 40 45 50
A alloy
Tensile strength Elongation
0 5 10 15 20 25 30 35 40 45
Elongation, (%)
B alloy
C alloy Tensile strength
Elongation
0 1 2 3 4 5 6
790 810 830 850 870 890 910 Tensile strength
Elongation
ZST 904K ZDT 890K
0 1 2 3 4 5 6
790 810 830 850 870 890 910 Tensile strength
Elongation
ZDT 886K
ZST 898K
0 5 10 15 20 25 30 35 40 45 50
700 730 760 790 820 850 880 910
Temperature, T/K
Tensile strength,
Elongation, (%)
Tensile strength Elongation
0 1 2 3 4 5 6
790 810 830 850 870 890 910
Tensile strength
Elongation
ZST 896K ZDT 891K
σ/MPa
Tensile strength,
σ
/MPa
Elongation, (%)
Tensile strength,
σ
/MPa
Fig. 2 Relation of tensile strength, elongation and temperature of A, B, C alloys.
a) c)
d) e) f)
DC billet 868 K
843 K 810 K 783 K
200µµm
b) 885 K
[image:3.595.56.281.72.423.2] [image:3.595.71.529.552.758.2]comparing the solidification sequence between HS65 (pres-ent study) and HS60 (previous study), a small reduction of the content of magnesium, silicon and copper, resulted in the
crystallization of(AlFeSi) prior to Mg2Si.16)
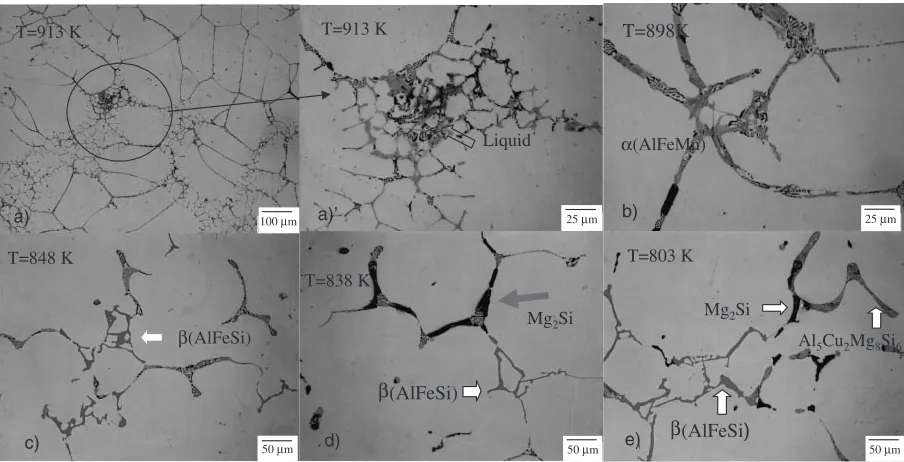
[image:4.595.99.496.72.245.2]In order to confirm the calculated results, several temper-atures were selected for the quenching test (quenched temperatures as indicated in Fig. 6) and the quenched samples were analyzed by XRD and EPMA. Microstructures obtained and the results of phase identification are shown in
Fig. 7. At temperature of 913 K (solid fraction 0.50), the liquid remains in a large area and no any phase appeared except the primary FCC solid-solution aluminum phase (FCC Al) is observed. When the temperature decreases to 898 K
(solid fraction 0.74), only the phase (AlFeMn) other than
FCC Al is observed. Furthermore, when the temperature is
down to 848 K (solid fraction 0.91),(AlFeSi) phase (usually
called as Chinese-script) is observed. When the temperature
is down to 838 K,(AlFeSi) and Mg2Si phases are observed.
When the temperature decreases to 803 K (solid fraction
0.99), all phases are observed except Al2Cu phase which is
formed in the final solidification stage as shown in Fig. 4(b). In comparison with above quenching experimental observa-tion results, with together Fig. 4(b), and calculated results by the Thermo-Calc, it can be said that the results of this calculation using the Gulliver-Scheil model are appropriate, because the experimental results (Fig. 7) are good well with the calculation results (Fig. 5.)
4. Discussion
4.1 Relation between mechanical properties and solid fraction
The relation between solid fraction and temperature of the three alloys was calculated for understanding and comparing the solidification progress of each alloy and is shown in
AlFe(Mn)Si
β
AlFeSi
Mg
2Si
10 µm
AlCuSiMg
Al
2Cu
5 µm
Fig. 4 Electron micrograph of B alloy.
0 0.1 0.2 0.3 0.4 0.5 0.6 0.7 0.8 0.9 1
780 800 820 840 860 880 900 920 940
Temperature, T/K
Mass phase fraction
Liquid FCC Al
0.000 0.001 0.002 0.003 0.004 0.005 0.006 0.007
780 800 820 840 860 880 900 920 α(AlFeMn)
β(AlFeSi) Mg2Si
Al8FeMg3Si6
Al5Cu2Mg8Si Si Al2Cu
b)
[image:4.595.313.542.286.426.2]Fig. 5 Phase fraction of the B alloy as a function of temperature under the Gulliver-Scheil’s condition; the insert shows an enlarged view for the temperature interval from 783 to 900 K.
Table 3 Solidification sequence of B alloy and mass percentage of each phase at complete solidification temperature.
Calculated
Phase Crystallization Amount Confirmed
temperature (K) (mass%)
FCC Aluminum 923 97.8 Y
(AlFeMn) 901 0.61 Y
(AlFeSi) 850 0.124 Y
Mg2Si 841 0.466 Y
Al8FeMg3Si6 829 0.206 N
Si 820 0.304 Y
Al5Cu2Mg8Si6 810 0.193 Y
Y: Confirmed by EPMA and EDX.
N: Not observed in solidification microstructure.
0.000 0.001 0.002 0.003 0.004 0.005 0.006 0.007
780 800 820 840 860 880 900 920
Temperature, T/K
Mass phase fraction
B alloy
α(AlFeMn)
β(AlFeSi)
Mg2Si
Al8FeMg3Si6
Al5Cu2Mg8Si6
Si
Al2Cu
913 K 898 K 848 K
838 K 803 K
[image:4.595.55.285.290.427.2] [image:4.595.48.290.514.642.2]Fig. 8. As the iron content increases, the liquids temperature decreases a little, around 20 K decrease per 1 mass% iron in this composition range, but the non-solidification completion temperature is same for the three alloys, that is, 783 K for
eutectic crystallization completion of Al2Cu. ZST of A, B
and C alloys, as previous mentioned, was 904, 898 and 896 K, respectively and the corresponding mass solid fraction is found to be 0.63, 0.74 and 0.79, respectively. The Zero Strength Solid Fraction (ZSSF) above which shows no strength is a clear parameter of the crack susceptibility of this alloy, which is same the order of ZSSF (See Table 2); an alloy with smaller solid fraction corresponding to ZST becomes sensible to hot tearing. Note that ZSSF of each alloy was considerably different though the iron content was not so different. By changing iron content from 0.25 only to 0.18 or 0.15 mass%, ZSSF changed from 0.63 to 0.74 or 0.79, respectively and seemed to change much; especially the big difference more than 0.1 of solid fraction happened between A and B alloys. Therefore it can be said the crack suscepti-bility is easily understood by comparing the ZSSF of each
alloy. In our previous study,12) we found that the crack
susceptibility among 6063, 6061, HS60, 7025 and 7075 became higher as the ZSSF of each alloy was lower.
Figure 9 shows the relation between tensile strength and solid fraction of each alloy in which tensile strength is very small when the solid fraction is below around 0.9. It can be seen that the tensile strength of each alloy increases with the solid fraction increase and the tensile strength steeply increases when the solid fraction is over 0.90–0.95; 0.89 (858 K) for A, 0.97 (813 K) for B and 0.95 (834 K) for C. This solid fraction of steep increase in strength seemed to be scattered, however, 0.90–0.95 if excluded with 0.97 for B alloy. This solid fraction seemed to correspond to the ‘‘coalesce’’ solid fraction at which solid bridging started to
form extensively between neighboring dendrites.20)
The corresponding solid fraction of ZDT, that is, ZDSF (Zero Ductility Solid Fraction), was evaluated as 0.78, 0.82 and 0.82 in accordance with 890, 886 and 891 K for A, B and C alloys, respectively. Solid fraction of steep increase in elongation (783 K) was unity for all experimental alloys. T=913 K
α(AlFeMn)
T=898K
T=913 K
Liquid
a) a)’ b)
100 µm 25 µm 25 µm
β(AlFeSi) T=848 K
c) 50 µm
T=838 K
β(AlFeSi)
Mg2Si
d) 50 µm
T=803 K
β(AlFeSi)
Al5Cu2Mg8Si6 Mg2Si
e)
50 µm
Fig. 7 Micrographs quenched from interrupted solidification temperatures of B alloy; quenched from (a) 913 K (solid fraction,fs, 0.50), (a)0magnified the circle part in (a), (b) 898 K (f
s, 0.74), (c) 848 K (fs, 0.91), (d) 838 K (fs, 0.93), (e) 803 K, (fs, 0.99).
0 0.1 0.2 0.3 0.4 0.5 0.6 0.7 0.8 0.9 1
760 780 800 820 840 860 880 900 920 940
Temperature, T/K
Mass solid fraction
A alloy
C alloy
B alloy
ZST;
CB A
ZSSF;
C B A
Fig. 8 Relation between mass solid fraction and temperature.
0 2 4 6 8 10 12 14
0.6 0.65 0.7 0.75 0.8 0.85 0.9 0.95 1
Mass solid fraction
Tensile strength,
A alloy B alloy C alloy
A; ZSSF fs=0.63
B; ZSSF fs=0.74
C; ZSSF fs=0.78
σ
/MPa
[image:5.595.72.524.72.303.2] [image:5.595.313.541.359.505.2] [image:5.595.57.282.359.506.2]ZDSF of this alloy was smaller than that of carbon steels,
which was almost unity18)and corresponded with the solid
fraction of steep increase in elongation of this aluminum alloy.
Temperature range or solid fraction range between ZST and ZDT was an important factor for hot tearing because the alloy showed strength but no ductility. Solid fraction range between ZSSF and ZDSF was 0.15, 0.08 and 0.03 for A, B and C alloys, respectively. The A alloy with highest crack susceptibility had a wider solid fraction range between ZSSF and ZDSF. Crack susceptibility was in proportion to the solid fraction range. On the other hand, from the comparison of the observation result of fracture surfaces, the temperature at which crack initiation in DC billet, it was fairly qualitative, was around 868 K, and the corresponding solid fraction calculated by Thermo-Calc. was 0.85 for the B alloy. Solidification progress from ZSSF or ZST to solid fraction or temperature of sharp increase in elongation was another measure, at least quantitatively, for hot tearing instead of the difference of solid fraction between ZSSF and ZDSF or the temperature difference between ZST and ZDT.
4.2 (AlFeMn) crystallization and crack susceptibility of Al-Mg-Si alloy
In order to investigate the effect of iron content on the crack susceptibility of the alloy, the change of crystallization temperature or solid fraction and crystallized amount of
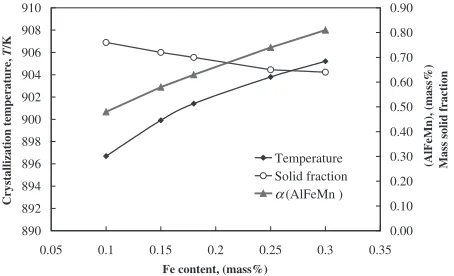
(AlFeMn) was calculated with the different content of iron.
Fig. 10 shows the effect of iron content on crystallization of
(AlFeMn); temperature or solid fraction of crystallization
start and its amount. The crystallization temperature of
(AlFeMn) increases with increasing iron content, but its
corresponding solid fraction decreases. As for crystallized
amount of (AlFeMn), it increases with increasing iron
content. It is interesting to note that ZST or ZSSF is
determined just or a little after(AlFeMn) crystallized, by
comparing Fig. 10 with Fig. 9.
(AlFeMn) intermetallic compound, mainly due to the
needle shape, could bridge a gap between primarily solidified dendrites, in particular, where the dendrite network for higher iron content alloy was not perfectly formed since the solid fraction was still low (around 0.63) when iron content increased over 0.25%. It resulted in higher ZST with a higher
iron content alloy since(AlFeMn) crystallized with higher
temperature in a higher iron alloy. That is, it was regarded that the grain boundary became fragile when the intermetallic
compound of (AlFeMn) was crystallized in needle shape
into grain boundary and the crack was easily generated in the casting. The details, especially on the bridging between
dendrites through (AlFeMn) compound and its relation to
mechanical properties will be discussed in the next paper.
5. Conclusions
To investigate hot tearing during DC billet, a tensile test in the mushy zone of the high strength Al-Mg-Si alloy was carried out. Solidification path was also calculated to relate between solidification sequence and mechanical properties in the mushy zone by using a thermodynamic calculation software Thermo-Calc. By comparing with temperature range of crack initiation, crystallization phase and crystal-lization order, the effect of the iron content on the crack susceptibility of the high strength Al-Mg-Si alloy was clarified. The main results obtained are shown below.
(1) Higher content of iron of high strength Al-Mg-Si alloy occurred hot tearing during casting. Crack susceptibil-ity of DC billet was in proportion to iron content. (2) Zero strength temperature (ZST) of A, B and C alloys
was 904, 898 and 896 K, respectively. Zero ductility temperature (ZDT) of A, B and C alloys was 890, 886 and 891 K, respectively.
(3) Solid fraction of ZST of A, B and C alloys was 0.63 to 0.74 or 0.79, respectively. Solid fraction of ZDT was 0.78, 0.82 and 0.82, respectively.
(4) The temperature in which the crack initiated was around 868 K, at which corresponding solid fraction was 0.85 for B alloy, and the alloy had very low strength and elongation around 868 K.
(5) The crack susceptibility of this alloy corresponded to higher ZST, higher increase rate of tensile strength from ZST and wider temperature range between ZST and ZDT. The crack susceptibility was most sensibly expressed as the zero strength solid fraction (ZSSF) above which no strength appeared.
(6) The casting crack of the high-strength Al-Mg-Si alloy was strongly influenced by the crystallization of
(AlFeMn) phase, which crystallized at higher
temper-ature with increase in the iron content. Needle shaped
(AlFeMn) could bridge a gap between primarily
solidified dendrites. It resulted in higher ZST with a higher iron content alloy. That is, it was regarded that the grain boundary became fragile when the
interme-tallic compound of (AlFeMn) was crystallized in
needle shape into grain boundary and the crack was easy to be generated in the casting.
REFERENCES
1) S. A. Metz and M. C. Flemings: AFS Trans.77(1969) 329–334. 2) M. Kubota and S. Kitaoka: AFS Trans.81(1973) 424–429. 3) T. W. Clyne and G. J. Davies: Brit. Foundryman.74(1981) 65–73. 4) W. Schneider and E. K. Jensen: Light Metals 1990, ed. by C. M.
Bickert, (TMS, Warrendale, 1990) pp. 931–936. 890
892 894 896 898 900 902 904 906 908 910
0.05 0.1 0.15 0.2 0.25 0.3 0.35
Fe content, (mass%)
Crystallization temperature,
T
/K
0.00 0.10 0.20 0.30 0.40 0.50 0.60 0.70 0.80 0.90
(AlFeMn), (mass%) Mass solid fraction
Temperature Solid fraction
[image:6.595.56.283.73.211.2]α(AlFeMn )
5) J. Campbell and T. W. Clyne: Cast Metals.3(1991) 224–230. 6) S. Upadhya, S. Cheng and U. Chandra:Light Metals 1995, ed. by J. W.
Evans, (TMS, Warrendale, 1995) pp. 961–967.
7) L. I. Novikov and O. E. Grushko: Mater. Sci. Techol.11(1995) 926– 932.
8) M. Rappaz, J. M. Drezet and M. Gremaud: Metall. Trans. A30A(1999) 449–455.
9) H. Nagaumi, K. Aoki, K. Komatsu and N. Hagisawa: Mater. Sci. Forum
331–337(2000) 173–177.
10) J.-M. Drezet and M. Rappaz:Light Metals 2001, ed. by J. Anjier, (TMS, Warrendale, 2001) pp. 887–893.
11) H. Nagaumi and T. Umeda: Journal of Light Metals2(2002) 161–167. 12) H. Nagaumi and T. Umeda: Mater. Sci. Forum426–432(2003) 65–70. 13) J. A. Spittle and A. A. Cushway: Metals Technology10(1983) 6–13. 14) S. Oya, T. Fujii, F. Kato and M. Ohtaki: J. Jpn. Inst. Light Met.33
(1983) 705–711.
15) S. Oya, T. Fujii, M. Ohtaki and S. Baba: J. Jpn. Inst. Light Met.34
(1983) 511–516.
16) H. Nagaumi, P. Suvanchai, T, Okane and T. Umeda; submitted to Mater. Trans.
17) For example, W. Kurz and D. J. Fisher:Fundamentals of Solidification, Fourth Revised Edition, (Trans Tech Publications Ltd, Uetikon-Zuerich, Switzerland, 1998) pp. 122–130.
18) G. Shin, T. Kajitani, T. Suzuki and T. Umeda: Tetsu to Hagane78
(1992) 587–593.
19) P. Suvanchai, T. Okane and T. Umeda: Proceedings of the 4th Decennial International Conference on Solidification Processing, Sheffield, July 1997, ed. by J. Beech and H. Jones, Department of Engineering Materials, University of Sheffield (1997) pp. 190–194. 20) M. Rappaz, A. Jacot and W. J. Boettinger: Metall. Mater. Trans. A34A