© 2019, IRJET | Impact Factor value: 7.211 | ISO 9001:2008 Certified Journal
| Page 4818
DEVELOPMENT OF A COMPUTER-AIDED SYSTEM FOR SWINE-FLU
PREDICTION USING COMPUTIONAL INTELLIGENCE
Er. Arwinder kaur
1, Dr. Gurmanik kaur
21
M.tech Scholar, Deptt. of Electronics and Communication Engineering,
Sant Baba Bhag Singh University, Khiala,
Distt: Jalandhar, Punjab, INDIA
2
A. P., Deptt. of Electrical Engineering, Sant Baba Bhag Singh University, Khiala, Distt: Jalandhar, Punjab, INDIA
---***---Abstract - Nowadays H1N1 is a developing contagious diseaseand universal medical issue, the large number of cases related to flu in whole world. The contamination is a form of fluctuation of flu. The tricky contagion was initially distinguished in Mexico in 2009 in America. H1N1 flu is also known as Swine flu, hoard flu, pig flu. A major challenge for health care system is to be providing a diagnostic product services at low costs and to diagnosing patients accurately. The other cheap clinical can contribute results are not accept [3]. In India the hospitals have advanced technologies but no software have which is used to predict these type of disease through different data mining techniques. As swine flu is one of highly common infection and it causes a thousands of people deaths per year[1]. Recently, advance data mining techniques, computational intelligence techniques, machine and network science techniques are use to develop computer aided design system for the accurate prediction of flu and will decrease its mortality rate. In this dissertation, data mining techniques are compared to design the computer aided model for the purpose of diagnostic and swine-flu prediction using computational intelligence techniques. These techniques have also been verified by using the various standard swine flu prediction data sets. The comparison has been drawn among and the existing technique based upon the various standard quality metrics of the data mining. The comparisons of techniques with the help of different parameters like RMSE, accuracy, execution time, error rate.
1.INTRODUCTION: Swine flu is a respiratory disease caused by influenza virus affecting the pigs, which, when infected show the symptoms like decreased appetite, increased nasal secretions, cough, and listlessness [1,4]. Thus the pigs are the reservoirs the virus. The causative virus of the swine influenza is the Influenza A with five subtypes namely: H1N1, H1N2, H2N3, H3N1, and H3N2. Out of these subtypes, the H1N1 Influenza A strain was isolated in the infected humans and the rest of the four subtypes were only exclusive in pigs [4]. The H1N1 virus is an enveloped RNA virus belonging to the family orthomyxoviridae, and name comes from the two surface antigens: H1 (Hemagglutinin type 1) and N1 (Neuraminidase type 1).People who work in close proximity with pigs, like farmers and pork processors, are at increased risk of catching swine flu from pigs through aerosol transmission [1,5]. The modes of transmission of H1N1 influenza virus in humans, from person to person, includes: inhalation of infected droplets (during sneezing, or
cough), direct contact with the infected patient and contact with fomites that are contaminated with respiratory or gastrointestinal secretions as thevirus can survive over the hard surfaces for about 24-48 hours and porous surface like cloth, tissue, paper for about 8-12 hours [3, 6]. Various researches have shown that the H1N1 swine influenza is a contagious disease and can spread among the household members of the infected person (8% to 19% of contacts likely to get infected) [4, 9]. The infected person may be infective to others from one day before the onset of symptoms and up to 7 or more days after becoming symptomatic.India is positioned third among the most influenced nations for cases and passings of swine influenza all around The main instance of Swine influenza was accounted for in May, 2009. After that it spread rapidly to all over of the nation. The most elevated number of swine influenza passings occurred in 2010 (1,763 out of 20604 cases), trailed by 2009 (981 out of 27236 cases), 2015 (774 out of 12963 cases) and 2013 (699 out of 5253 cases). The mortality diminished in 2011 (75 out of 603 cases), trailed by 2014 (218 out of 937 cases) and 2012 (405 out of 5044 cases). A sum of 72640 cases and 4915 passings had been accounted for by 2015. In India 7374 number of affirmed passings 225 Incidence Globally 2, 96,471 and passings all around 3,486 [2, 4].2015 Indian swine influenza flare-up alludes to an episode of the 2009 pandemic H1N1 infection in India, which is as yet progressing as of March 2015. The conditions of Gujarat and Rajasthan are the most exceedingly terrible influenced. India had revealed 937 cases and 218 passings from swine influenza in the year 2014. The aggregate number of research facility affirmed cases crossed 33000 imprints with the death of in excess of 2000 people [5, 8]. Swine influenza is uncommon in people. Be that as it may, these strains inconsistently flow between people as SIV once in a while transforms into a shape ready to pass effectively from human to human. Swine flu infection is basic all through pig populaces overall [6]. The 2009 H1N1 pandemic was not a zoonotic disease, but spread from human to human. Also, the virus does not spread by eating cooked pork. The incubation period of swine flu ranges from 1-7 days (likely 1-4 days) [4, 10].
© 2019, IRJET | Impact Factor value: 7.211 | ISO 9001:2008 Certified Journal
| Page 4819
Thakkar et al have developed prototype intelligence swine fluprediction software (ISWPS). They used naïve bayes classifiers for classifying the patients of swine-flu into three categories (least possible, probable or most probable). They have achieved an accuracy of nearly 63.33% [4].Shinde and pawar proposed the combination of computational epidemiology and modern data mining techniques with a comparative analysis for swine-flu prediction. The clustering algorithm K-mean was use to make a group or cluster of swine-flu suspects in a particular area. The decision tree algorithm and naïve bayes classifiers were applied on the same inputs to find out the actual count of suspects and predict the possible survallience of a swine-flu in a nearby area from suspected area. The naïve bayes classifiers performed better then decision tree algorithm in finding the accurate count of suspects [3]. Borkar and Deshmukh have proposed naïve bayes classifiers algorithm for diagnosing swineflu diease from its symptoms. The proposed approach showed promising results [1].Ravinkal Kaur1, Virat Rehani2 used Fuzzy logic for medical diagnosis of a large range of diseases. This work was proposed a methodology to capture the experience of expert physicians, can be used to fuzzy inference system techniques. The diagnosis of human expert specialists has been obtained in many experiments with different input symptoms by various researchers and Fuzzy logic was provides an alternative way to represent linguistic and individual attributes. It was ready to be applied control systems and other applications to improve the efficiency and simplicity of the design process [6].MR. KEDAR S. LADE*, DR. SANJAY D. SAWANT1, MRS. MEERA C. SINGH both are explains the benefit of the readers ‐What is swine flu virus, how it spreads, history ,transmission of H1N1 virus, Signs and symptoms , Diagnosis, prevention , precautions in public, dos and don’ts, care during travel, home remedies and it was also includes‐current status of swine flu in India and in the world[5].MUJORIYA RAJESH , DHAMANDE KISHORE, Dr. RAMESH BABU BODLA describe that Infection of H1N1 influenza virus can result in cruel illness and life- threatening complications. The symptoms of H1N1 flu are similar to the common flu ; scientists was discovered range of symptoms and how it is spread for healthy people, flu can be prevented by avoiding close contact with sick people and by washing your hands and you can help stop of this infectious disease by stay home while you are sick and by covering your mouth and nose as you cough or sneeze[7]
3.Methodology: 3.1 SUPPORT VECTOR MACHINE (SVM) - Support Vector Machine (SVM) is noticed as the first choice for classification problems. Support Vector Machines (SVMs) are nothing but machines constructed for classifying positive and negative classes. These are mainly depended on support vectors, which are decisive points for classifying data. The attractiveness of SVMs lies in its nice mathematical equations, pretty pictorial representations, excellent generalization abilities. They give optimal and global solutions, with low over fitting and overcomes curse of dimensionality problem. SVMs are designed based on
optimization methods and are the most significant tools for solving the problems of machine learning with finite training data. But, they have slower training times particularly with non-linear data and huge input data. SVMs are generally used as binary classifiers.The proposed SVM algorithm:
Input: Training set S;
Number of base classifiers N; Test instance x2
Training Process:
1. UseBootstrap technology on S to generate training subset ;
2. Train the ith SVM classifier ;
3. Call SVM-OTHR algorithm to adust the classificationhyperplane of to form SVM-OTHR,
into the classifier SVM-OTHRi to predict its class label End
Use majority voting to get the final class label
Output: y2 which is the predicted class label for test instance x2
3.2 ANFIS- ANFIS is data mining approach useful for solving elaborate and even highly nonlinear problems. The approach was launched by Jang. Simply because ANFIS offers at the same time ANN and even FIS, it really is capable of controlling elaborate and even nonlinear problem per framework. That ANFIS architecture along with a few advices and even 5 layer is shown with Fig.1. To explain the operation in ANFIS, it really is believed the fact that FIS below factor is comprised of 1 output (O) and 2 inputs (k, j). That Fuzzy rules could be ordinarily reported as follows:
© 2019, IRJET | Impact Factor value: 7.211 | ISO 9001:2008 Certified Journal
| Page 4820
where k and j can be considered as the inputs. ; ; ; ; ;are function parameters of output (O) or the consequent parameters. Also, ; ; ; are themembership functions for inputs (k and j). As shown in Fig. 3, an ANFIS with five layers, 2 inputs and 1 output can be explained in the following lines:
Layer 1 (fuzzifications layer): Each and Every node is measured as being an adaptive node.
n is normally the amount of fuzzy units each design input.
k and j are set as input nodes.
are the membership functions.
Z and U are the linguistic labels.
Layer 2 (product layer): Formula for the discharge strength..
The outcome node consists of these discharge sturdiness of the rule.
Layer 3 (normalized layer): In this particular layer, these rate about discharge strength for the as ith concept in the sum of discharge strengths off procedures is normally calculated.
Layer 4 (Defuzzification layer): Each individual node is normally an adjustable node together with the using node function:
In which is output of the 3rd layer or normalized discharge strength. Also, are parameters sets of the node.
Layer 5 (output layer): System output is generated through sum of the incoming signals.
The prosperous implementing ANFIS design in the field of mining and geotechnical technological innovation provides attended to in many studies.
3.3 ADABOOST ALGORITHM- AdaBoost algorithm is usually a representative to Boosting algorithm, there are numerous of algorithms derived from AdaBoost algorithm, the majority of them concentration on classification, and the competition of them are applied in the regression. Different from other Boosting algorithm, AdaBoost algorithm , a type of iterative
algorithm, which adjust the training pattern depending on the error returned by weak learners. An important reasoning behind Adaboost algorithm is combining weak learners generated in each iteration to set a deep learner, thus, tips on how to weight weak learners and combine them are very important.In the AdaBoost algorithm, weak classifiers are selected iteratively from plenty of candidate weak classifiers and therefore are combined linearly to form a strong classifier for classifying the network data. Let H = be the set of constructed weak classifiers. Let the set of training
sample data be , where
denotes the ith feature vector; is the label of the ith feature vector, denoting whether the feature vector represents a normal behaviour or not; and n is the size of the data set. Let be the sample weights that reflect the importance degrees of the samples and, in statistical terms, represent an estimation of the sample distribution. The AdaBoost-based algorithm is described as follows.
Step 1: Initialize weights satisfying; .
Step 2: Observe the following for .
Step 3: Let be the sum of the weighted classification errors for the weak classifier
Step 4: Where,
Step 5: Choose, from constructed weak classifiers, the weak classifier h(t) that minimizes the sum of the weighted classification errors
Step 6: Calculate the sum of the weighted classification errors ε(t) for the chosen weak classifier h(t).
Step 7: Assume,
Step 8: Update the weights by:
Step 9: where Z(t) is a normalization factor
Step 10:The strong classifier is defined by
© 2019, IRJET | Impact Factor value: 7.211 | ISO 9001:2008 Certified Journal
| Page 4821
developed through Bayesian networks that are vastly used inthe machine learning area. Usually, full n-gram models are not feasible to be implemented due to its complexity, because they require a joint probability table.. This model is mathematically represented in Equation (1), in which, the effect and the cause are represented by and respectively.Thus, using this model it is not necessary to build a joint probability table.
(1)
The normalization factor is calculated by the Equation (2), in which l represents the number of words learned in the train.
(2)
the Naive Bayes not considers all probabilities involved in inference in which is inversely weighted by
the Thereby, the value of are
normalized between themselves, and the equation energy is preserved.
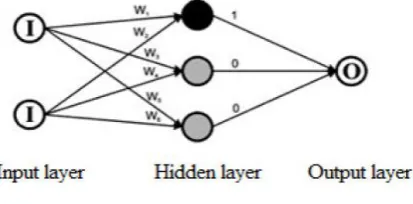
3.5 LVQ: LVQ is a supervised classification algorithm and its used for various research purposes such as image decompression, clustering, and data visualization. ). LVQ was developed by Teuvo Kohonen. An LVQ network has a first competitive layer ,second linear layer. The competitive layer learns to specify input vectors in the same way as the competitive
Fig: 2 Architecture of LVQ
layers of Self-Organizing Feature Maps. The linear layer transforms the competitive layer's classes into target classifications explain by the user. The classes learned by the competitive layer are converted to as subclasses and the classes of the linear layer. Both the competitive and linear layers have one neuron per (sub or target) class. The training algorithm involves an iterative gradient update of the winner unit. The winner unit mc is defined by
(1)
The direction of the gradient update depends on the effectiveness of the classification using a nearest rule in Euclidean space. If a data sample is correctly classified (the labels of the winner unit and the data sample are the same), the model vector closest to the data sample is attracted towards; if incorrectly classified, and then the data sample has a hideous effect on the model vector. The revise equation for the winner unit mc clear by the nearest-neighbor rule and a data sample x(t) are
(2)
Where the sign depends on whether the data sample is correctly classified (+), misclassified (−). The Learning rate α(t) ∈]0, 1[ must decrease monotonically in time. For different picks of data samples from our training set, this procedure is repeated iteratively until convergence. Kohonen also presents optimized Learning-rate LVQ, where the learning-rate is optimized for each codebook individually. For further variations.
4.RESULT AND DISCUSSION
This section covers the cross authentication between existing and proposed techniques. Some familiar algorithms parameters have been chosen to show that the performance of the proposed algorithm is superior to the existing techniques. The evaluation of proposed technique is done on the origin of following parameters such as Accuracy, Error Rate, Root Mean Square Error, and Execution Time. By comparing of existing results and proposed results of the proposed method i.e. sees Fig. 1-4. Also, quantitatively comparison between existing and proposed method are given in Table .1-.4.
[image:4.595.60.267.519.621.2]4.1 ACCURACY
[image:4.595.301.565.594.709.2]Table indicated about quantized research into the Accuracy. As Accuracy ought to be higher which implies algorithm is indicating the superior results when compared to access methods.
Table 1: Accuracy Evaluation Serial no. Algorithm Accuracy
1. Naive bayes 0.72858
2. ANFIS 0.73458
3. SVM 0.80847
4. Adaboost 0.74285
© 2019, IRJET | Impact Factor value: 7.211 | ISO 9001:2008 Certified Journal
| Page 4822
0 0.5 1
accuracy
Naïve bayes
ANFIS
SVM
Adaboost
[image:5.595.38.287.84.228.2]LVQ
[image:5.595.319.551.115.227.2]Figure 1: The graphical representation of Accuracy Figure.1: indicates about comparison of Naïve Bayes, SVM, ADABOOST and ANFIS method wherever x-axis indicates classifiers as well as y- axis indicates Values. In our case the Accuracy are comparatively better than existing one. 4.2 ERROR RATE
Table 2: Error Rate Evaluation Serial no. Algorithm Error rate
1. Naive bayes 0.27142
2. ANFIS 0.27142
3. SVM 0.24143
4. Adaboost 0.27143
5. LVQ 0.28100
Table 2 is indicated about quantized research into the Error Rate. As Error Rateought to be lower which implies proposed algorithm is indicating the superior results when compared to access methods
Figure.2: indicates about comparison of Naïve Bayes, SVM, Tree bagger (ADABOOST) and ANFIS method wherever x-axis indicates classifiers data as well as y- axis indicates values. In our case the Error rate are comparatively better than existing one.
0.2 0.25 0.3
Error rate
LVQ
ANFIS
Adaboost
Naïve bayes
Figure 2: The graphical representation of Error rate
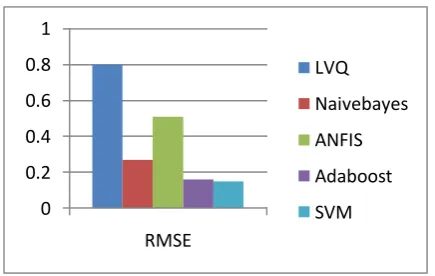
4.3RMSE (Root Mean Square Error) Serial no. Algorithm RMSE
1. Naive bayes 0.27142
2. ANFIS 0.51497
3. SVM 0.15712
4. Adaboost 0.16429
5. LVQ 0.8000
Table 3: Root-mean-square error Evaluation
0 0.2 0.4 0.6 0.8 1
RMSE
LVQ
Naivebayes
ANFIS
Adaboost
SVM
Figure 3: The graphical representation of Root-mean-square error
Table 3 is indicated about quantized research into the Root-mean-square error. As Root-Root-mean-square error ought to be lower which implies algorithm is indicating the superior results when compared to access methods. Figure3: indicates about comparison of Naïve Bayes, SVM, Tree bagger(ADABOOST) and ANFIS method wherever x-axis indicates Classifiers as well as y- axis indicates values. In our case the proposed Root-mean-square error are comparatively better than existing one.
4.4 EXECUTION TIME
Table 4 is indicated about quantized research into the Execution time. As Execution time ought to be lower which implies proposed algorithm is indicating the superior results when compared to access methods.
Table 4: Execution time Evaluation Serial no. Algorithm Execution time
1. Naive bayes 0.97832
2. ANFIS 1.68877
3. SVM 0.40832
4. Adaboost 535.3216
[image:5.595.326.544.263.401.2] [image:5.595.29.295.352.465.2]© 2019, IRJET | Impact Factor value: 7.211 | ISO 9001:2008 Certified Journal
| Page 4823
Figure.4: The graphical representation of Execution timeFigure.4: indicates about comparison of Naïve Bayes, SVM, Tree bagger and ANFIS method wherever x-axis indicates Classifiers as well as y- axis indicates value. In our case the Execution time are comparatively better than existing one V. CONCLUSION
The evaluation of technique is done on the origin of following parameters such as Accuracy, Error Rate, Root Mean Square Error, and Execution Time.In this thesis work previous method are evaluated and compared with a method. After doing the simulation &lification; evaluation of method following conclusions are drawn.
1. On the basis of Accuracy: A careful examination of the Accuracy values revealed that SVM method produces comparatively better accuracy values from the exciting method. As Accuracy ought to be higher which implies novel-proposed algorithm is indicating the superior results It is evaluated that percentage improvement in accuracy in case of novel-proposed method is 5% as compared to previous method.
2. On the basis of Error Rate: A careful examination of the Error Rate values revealed that SVM method produces comparatively better Error Rate values from the exciting method. As Error Rate ought to be lower which implies SVM algorithm is indicating the superior results it is evaluated that percentage improvement in Error Rate in case of method is 7% as compared to previous method.
3. On the basis of Root Mean Square Error: A careful examination of the Root Mean Square Error values revealed that SVM method produces comparatively better Root Mean Square Error values from the exciting method. As Root Mean Square Error ought to be lower which implies SVM algorithm is indicating the superior results it is evaluated that percentage improvement in Root Mean Square Error in case of method is 6% as compared to previous method.
4. On the basis of Execution Time: A careful examination of the Execution Time values revealed that method produces comparatively better Execution Time values from the exciting method. As Execution Time ought to be lower which implies SVM algorithm is indicating the superior results it is evaluated that percentage improvement in Execution Time in case of method is 2% as compared to previous method.
REFERENCES
[1] Ms. Ankita R. Borkar*, Dr. Prashant R. Deshmukh,”
Naïve Bayes Classifier for Prediction of Swine Flu Disease”, International Journal of Advanced Research in Computer Science and Software Engineering ,5, 4, 2015 ,pp.120-123.
[2] Amit Tate1, Ujwala Gavhane2, Jayanand Pawar3,
Bajrang Rajpurohit4 , Gopal B. Deshmukh5,” Prediction of Dengue, Diabetes and Swine Flu Using
Random Forest Classification Algorithm”, International
Research Journal of Engineering and Technology (IRJET) ,04 , 06 ,2017, pp.685-690.
[3] Mangesh J. Shinde1, S. S. Pawar2,” COMPARATIVE
STUDY OF DECISION TREE ALGORITHM AND NAIVE
BAYES CLASSIFIER FOR SWINE FLU PREDICTION”,
IJRET: International Journal of Research in Engineering and Technology ,04,06,2015,pp.45-50.
[4] Binal A. Thakkar, Mosin I. Hasan, Mansi A. Desai,”
HEALTH CARE DECISION SUPPORT SYSTEM FOR SWINE
FLU PREDICTION USING NAÏVE BAYES CLASSIFIER”,
2010 International Conference on Advances in Recent Technologies in Communication and Computing,pp.101-105.
[5] MR. KEDAR S. LADE*, DR. SANJAY D. SAWANT1, MRS.
MEERA C. SINGH2,” REVIEW ON INFLUENZA WITH
SPECIAL EMPHASIS ON SWINE FLU”, International
Journal of Current Pharmaceutical Research , 3, 1, 2011, pp.97-107.
[6] Ravinkal Kaur1, Virat Rehani2,” Recognition and Cure
Time Prediction of Swine Flu, Dengue and Chicken Pox
using Fuzzy Logic”, International Research Journal of
Engineering and Technology (IRJET),03, 06, 2016 ,pp.211-224.
[7] MUJORIYA RAJESH Z*1, DHAMANDE KISHORE2, Dr.
RAMESH BABU BODLA3,” A REVIEW ON STUDY OF SWINE FLU”, Indo-Global Research Journal of Pharmaceutical Sciences,1 , 2,2011,pp.47-51.
[8] Grover, S. and Aujla, G.S., “Prediction model for influenza
epidemic based onTwitter data”, International Journal of Advanced Research in Computer and Communication Engineering, 3,7, 2014,pp.7541-7545.
[9] Trifonov, V., Khiabanian, H., Greenbaum, B. and Rabadan,
R.,”The origin of the recent swine influenza A (H1N1)
virus infecting humans”,
Eurosurveillance,14,17,2009,pp.19193.
[10] George J, Issac YM.,” Swine Flu-A Pandemic
Outbreak”,VeterinaryWorld,2,12,2009,pp.472-4.
[11] D. Kornack and P. Rakic, “Cell Proliferation without
Neurogenesis in Adult Primate Neocortex,” Science, vol.
294, Dec. 2001, pp. 2127-2130,
doi:10.1126/science.1065467.
[12] M. Young, The Technical Writer’s Handbook. Mill Valley,
CA: University Science, 1989.
[13] R. Nicole, “Title of paper with only first word
© 2019, IRJET | Impact Factor value: 7.211 | ISO 9001:2008 Certified Journal
| Page 4824
[14] K. Elissa, “Title of paper if known,” unpublished.
BIOGRAPHIES