Parameter estimation for agenda-based user simulation
Simon Keizer, Milica Gaˇsi´c, Filip Jurˇc´ıˇcek, Franc¸ois Mairesse,
Blaise Thomson, Kai Yu, and Steve Young∗
University of Cambridge, Department of Engineering, Cambridge (UK) {sk561,mg436,fj228,farm2,brmt2,ky219,sjy}@cam.ac.uk
Abstract
This paper presents an agenda-based user simulator which has been extended to be trainable on real data with the aim of more closely modelling the complex rational be-haviour exhibited by real users. The train-able part is formed by a set of random de-cision points that may be encountered dur-ing the process of receivdur-ing a system act and responding with a user act. A sample-based method is presented for using real user data to estimate the parameters that control these decisions. Evaluation results are given both in terms of statistics of gen-erated user behaviour and the quality of policies trained with different simulators. Compared to a handcrafted simulator, the trained system provides a much better fit to corpus data and evaluations suggest that this better fit should result in improved di-alogue performance.
1 Introduction
In spoken dialogue systems research, modelling dialogue as a (Partially Observable) Markov Deci-sion Process ((PO)MDP) and using reinforcement learning techniques for optimising dialogue poli-cies has proven to be an effective method for de-veloping robust systems (Singh et al., 2000; Levin et al., 2000). However, since this kind of optimi-sation requires a simulated user to generate a suffi-ciently large number of interactions to learn from, this effectiveness depends largely on the quality of such a user simulator. An important require-ment for a simulator is for it to be realistic, i.e., it should generate behaviour that is similar to that of real users. Trained policies are then more likely to perform better on real users, and evaluation results on simulated data are more likely to predict results on real data more accurately.
∗This research was partly funded by the UK EPSRC
un-der grant agreement EP/F013930/1 and by the EU FP7 Pro-gramme under grant agreement 216594 (CLASSiC project: www.classic-project.org).
This is one of the reasons why learning user simulation models from data on real user be-haviour has become an important direction of re-search (Scheffler and Young, 2001; Cuay´ahuitl et al., 2005; Georgila et al., 2006). However, the data driven user models developed so far lack the com-plexity required for training high quality policies in task domains where user behaviour is relatively complex. Handcrafted models are still the most effective in those cases.
This paper presents an agenda-based user simu-lator which is handcrafted for a large part, but ad-ditionally can be trained with data from real users (Section 2). As a result, it generates behaviour that better reflects the statistics of real user behaviour, whilst preserving the complexity and rationality required to effectively train dialogue management policies. The trainable part is formed by a set of random decision points, which, depending on the context, may or may not be encountered during the process of receiving a system act and decid-ing on a response act. If such a point is encoun-tered, the simulator makes a random decision be-tween a number of options which may directly or indirectly influence the resulting output. The op-tions for each random decision point are reason-able in the context in which it is encountered, but a uniform distribution of outcomes might not re-flect real user behaviour.
We will describe a sample-based method for es-timating the parameters that define the probabili-ties for each possible decision, using data on real users from a corpus of human-machine dialogues (Section 3). Evaluation results will be presented both in terms of statistics on generated user be-haviour and the quality of dialogue policies trained with different user simulations (Section 4).
2 Agenda-based user simulation
in-formation application, but is sufficiently generic to accommodate slot-filling applications in any do-main.1 The user goal consists of the type of venue, for examplehotel,barorrestaurant, a list of constraints in the form of slot value pairs, such as food=Italianor area=east, and a list of slots the user wants to know the value of, such as the address (addr), phone number (phone), or price information (price) of the venue. The user goals for the simulator are randomly gener-ated from the domain ontology describing which combinations of venue types and constraints are allowed and what are the possible values for each slot. The agenda is a stack-like structure contain-ing planned user acts. When the simulator receives a system act, the status of the user goal is updated as well as the agenda, typically by pushing new acts onto it. In a separate step, the response user act is selected by popping one or more items off the agenda.
Although the agenda-based user simulator in-troduced by Schatzmann et al. (2007a) was en-tirely handcrafted, it was realistic enough to suc-cessfully test a prototype POMDP dialogue man-ager and train a dialogue policy that outperformed a handcrafted baseline (Young et al., 2009). A method to train an agenda-based user simula-tor from data was proposed by Schatzmann et al. (2007b). In this approach, operations on the agenda are controlled by probabilities learned from data using a variation of the EM algorithm. However, this approach does not readily scale to more complex interactions in which users can, for example, change their goal midway through a dia-logue.
2.1 Random decision parameters
Each time the user simulator receives a system act, a complex, two-fold process takes place involving several decisions, made on the basis of both the nature of the incoming system act and the infor-mation state of the user, i.e., the status of the user goal and agenda. The first phase can be seen as an information state update and involves actions like filling requested slots or checking whether the provided information is consistent with the user goal constraints. In the second phase, the user de-cides which response act to generate, based on the updated agenda. Many of the decisions involved are deterministic, allowing only one possible op-tion given the context. Other decisions allow for some degree of variation in the user behaviour and are governed by probability distributions over the
1We have to date also implemented systems in
appoint-ment scheduling and bus timetable inquiries.
options allowed in that context. For example, if the system has offered a venue that matches the user’s goal, the user can randomly decide to either change his goal or to accept the venue and ask for additional information such as the phone number.
The non-deterministic part of the simulator is formalised in terms of a set of random decision points (RDPs) embedded in the decision process. If an RDP is encountered (depending on the con-text), a random choice between the options de-fined for that point is made by sampling from a probability distribution. Most of the RDPs are controlled by a multinomial distribution, such as deciding whether or not to change the goal after a system offer. Some RDPs are controlled by a geometric distribution, like in the case where the user is planning to specify one of his constraints (with an inform act popped from the agenda) and then repeatedly adds an additional constraint to the act (by combining it with an additional inform act popped from the agenda) until it randomly decides not to add any more constraints (or runs out of constraints to specify). The parameter for this dis-tribution thus controls how cautious the user is in providing information to the system.
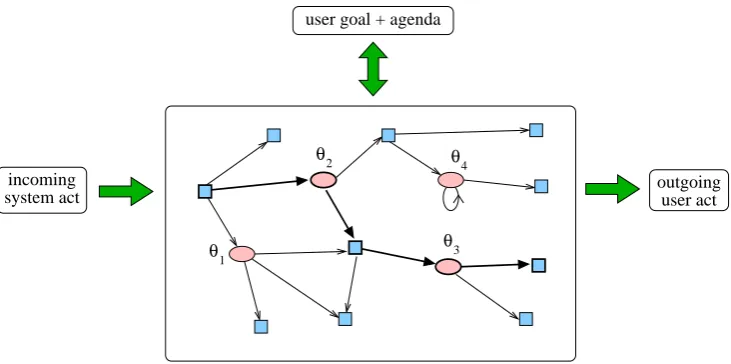
Hence, the user simulator can be viewed as a ‘decision network’, consisting of deterministic and random decision points. This is illustrated in Figure 1 for the simplified case of a network with only four RDPs; the actual simulator has 23 RDPs, with 27 associated parameters in total. Each time the simulator receives a system act, it follows a path through the network, which is partly deter-mined by that system act and the user goal and agenda, and partly by random decisions made ac-cording to the probability distributions for each random decision point i given by its parameters
θi.
3 Training the simulator from data
incoming
system act outgoinguser act
user goal + agenda
θ2
θ1 θ3
[image:3.595.117.483.60.242.2]θ4
Figure 1: User simulator viewed as a ‘decision network’: square nodes indicate deterministic decision points; round nodes indicate random decision points, and have associated parametersθi; the loop on one of the nodes indicates it has a geometric distribution associated with it.
3.1 Parameter estimation
Before starting the process of matching simulated acts with true acts and collecting counts for the RDPs, the parameters are initialised to values cor-responding to uniform distributions. Then, the simulator is run against all dialogues in the cor-pus in such a way that for each turn in a dialogue (consisting of a system act and a user act), the user simulator is provided with the system act and is run repeatedly to generate several simulated user response acts for that turn. For the first turn of a di-alogue, the simulator is initialised with the correct user state (see Section 3.2). For each response, the simulator may make different random decisions, generally leading to different user acts. The deci-sions that lead to a simulated act that matches the true act are recorded as successful. By generating a sufficiently large number of simulated acts, all possible combinations of decisions are explored to find a matching act. Given the high complexity of the simulator, this sampling approach is preferred over directly enumerating all decision combina-tions to identify the successful ones. If none of the combinations are successful, then either a) the processing of the dialogue is ended, or b) the cor-rect context is set for the next turn and processing is continued. Whereas the former approach aims at matching sequences of turns, the latter only aims at matching each user turn separately. In either case, after all data is processed, the parameters are estimated using the resulting counts of successful decisions for each of the RDPs.
For each RDPi, let DPi represent the decision taken, anddij the j’th possible decision. Then, for each decision pointithat is controlled by a
multi-nomial distribution, the corresponding parameter estimatesθij are obtained as follows from the de-cision frequenciesc(DPi =dij):
θij =
c(DPi =dij)
P
jc(DPi =dij)
(1)
Random decision points that are controlled by geometric distributions involve potentially multiple random decisions between two options (Bernoulli trials). The parameters for such RDPs are estimated as follows:
θi = 1
n
n
X
k=1
bik
!−1
(2)
where bik is the number of Bernoulli trials re-quired at the k’th time decision point i was en-countered. In terms of the decision network, this estimate is correlated with the average number of times the loop of the node was taken.
3.2 User goal inference
of the HIS dialogue manager is designed accord-ing to this same notion (Keizer et al., 2008). In this model, the probability of a user act in a certain dia-logue context (the last system act and a hypothesis regarding the user goal) is determined by checking the consistency of its preconditions with that con-text. This contributes to updating the system’s be-lief state on the basis of which it determines its re-sponse action. For the user goal inference model, the user act is given and therefore its precondi-tions can be used to directly infer the user goal. So, for example, in the case of observing the user act inform(area=central), the constraint (area=central)is added to the user goal.
In addition to using the inferred user goals, the agenda is corrected in cases where there is a mis-match between real and simulated user acts in the previous turn.
In using this offline goal inference model, our approach takes a position between (Schatzmann et al., 2007b), in which the user’s goal is treated as hidden, and (Georgila et al., 2006), in which the user’s goal is obtained directly from the corpus an-notation.
4 Evaluation
The parameter estimation technique for training the user simulator was evaluated in two differ-ent ways. The first evaluation involved compar-ing the statistics of simulated and real user be-haviour. The second evaluation involved compar-ing dialogue manager policies trained with differ-ent simulators.
4.1 Data
The task of the dialogue systems we are develop-ing is to provide tourist information to users, in-volving venues such as bars, restaurants and hotels that the user can search for and ask about. These venues are described in terms of features such as price range, area, type of food, phone number, address, and so on. The kind of dialogues with these systems are commonly called slot-filling di-alogues.
Within the range of slot-filling applications the domain is relatively complex due to its hierarchi-cal data structure and relatively large number of slots and their possible values. Scalability is in-deed one of the primary challenges to be addressed in statistical approaches to dialogue system devel-opment, including user simulation.
The dialogue corpus that was used for training and evaluating the simulator was obtained from the evaluation of a POMDP spoken dialogue sys-tem with real users. All user utterances in the
resulting corpus were transcribed and semanti-cally annotated in terms of dialogue acts. Dia-logue acts consist of a series of semantic items, including the type (describing the intention of the speaker, e.g., inform or request) and a list of slot value pairs (e.g., food=Chineseor area=south). An extensive analysis of the an-notations from three different people revealed a high level of inter-annotator agreement (ranging from 0.81 to 0.94, depending on which pair of an-notations are compared), and a voting scheme for selecting a single annotation for each turn ensured the reliability of the ‘true’ user acts used for train-ing the simulator.
4.2 Corpus statistics results
A first approach to evaluating user simulations is to look at the statistics of the user behaviour that is generated by a simulator and compare it with that of real users as observed in a dialogue cor-pus. Several metrics for such evaluations have been considered in the literature, all of which have both strong points and weaknesses. For the present evaluation, a selection of metrics believed to give a reasonable first indication of the quality of the user simulations was considered2.
4.2.1 Metrics
The first corpus-based evaluation metric is the Log Likelihood (LL) of the data, given the user simu-lation model. This is what is in fact maximised by the parameter estimation algorithm. The log like-lihood can be computed by summing the log prob-abilities of each user turnduin the corpus dataD:
ll(D|{θij},{θi}) =
X
u
logP(du|{θij},{θi})
(3)
The user turn probability is given by the prob-ability of the decision paths (directed paths in the decision network of maximal length, such as the one indicated in Figure 1 in bold) leading to a sim-ulated user act in that turn that matches the true user act. The probability of a decision path is ob-tained by multiplying the probabilities of the de-cisions made at each decision pointithat was en-countered, which are given by the parameters θij
2Note that not all selected metrics are metrics in the strict
andθi:
logP(du|{θij},{θi}) =
X
i∈Im(u)
log X j
θij ·δij(u)
+ (4)
X
i∈Ig(u)
log X k
(1−θi)k−1·θi·µik(u)
where Im(u) = {i ∈ Im|P
jδij(u) > 0} and
Ig(u) ={i∈Ig|P
kµik(u)>0}are the subsets of the multinomial (Im) and geometric (Ig) de-cision points respectively containing those points that were encountered in any combination of deci-sions resulting in the given user act:
δij(u) =
1 if decisionDPi=dij was taken in any of the matching combinations 0 otherwise
(5)
µik(u) =
1 if any of the matching combinations required
k >0trials 0 otherwise
(6)
It should be noted that the log likelihood only represents those turns in the corpus for which the simulated user can produce a matching simulated act with some probability. Hence, it is impor-tant to also take into account the corpus cover-age when considering the log likelihood in cor-pus based evaluation. Dividing by the number of matched turns provides a useful normalisation in this respect.
The expected Precision (PRE), Recall (RCL), and F-Score (FS) are obtained by comparing the simulated user acts with the true user acts in the same context (Georgila et al., 2006). These scores are obtained by pairwise comparison of the simu-lated and true user act for each turn in the corpus at the level of the semantic items:
P RE = #(matched items)
#(items in simulated act) (7)
RCL = #(matched items)
#(items in true act) (8)
F S = 2·P RE·RCL
P RE+RCL (9)
By sampling a sufficient number of simulated acts for each turn in the corpus and comparing them with the corresponding true acts, this results in an accurate measure on average.
The problem with precision and recall is that they are known to heavily penalise unseen data. Any attempt to generalise and therefore increase the variability of user behaviour results in lower scores.
Another way of evaluating the user simulator is to look at the global user act distributions it generates and compare them to the distributions found in the real user data. A common metric for comparing such distributions is the Kullback-Leibler (KL) distance. In (Cuay´ahuitl et al., 2005) this metric was used to evaluate an HMM-based user simulation approach. The KL dis-tance is computed by taking the average of the two KL divergences3DKL(simulated||true)and
DKL(true||simulated), where:
DKL(p||q) =
X
i
pi·log2(
pi
qi
) (10)
KL distances are computed for both full user act distributions (taking into account both the dia-logue act type and slot value pairs) and user act type distributions (only regarding the dialogue act type), denoted by KLF and KLT respectively.
4.2.2 Results
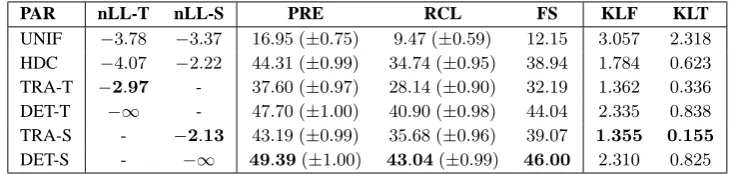
For the experiments, the corpus data was ran-domly split into a training set, consisting of 4479 user turns in 541 dialogues, used for estimat-ing the user simulator parameters, and a test set, consisting of 1457 user turns in 175 dialogues, used for evaluation only. In the evaluation, the following parameter settings were compared: 1) non-informative, uniform parameters (UNIF); 2) handcrafted parameters (HDC); 3) parameters es-timated from data (TRA); and 4) deterministic pa-rameters (DET), in which for each RDP the prob-ability of the most probable decision according to the estimated parameters is set to 1, i.e., at all times, the most likely decision according to the es-timated parameters is chosen.
For both trained and deterministic parameters, a distinction is made between the two approaches to matching user acts during parameter estimation. Recall that in the turn-based approach, in each turn, the simulator is run with the corrected con-text to find a matching simulated act, whereas in the sequence-based approach, the matching pro-cess for a dialogue is stopped in case a turn is encountered which cannot be matched by the simulator. This results in estimated parameters TRA-T and deterministic parameters DET-T for
3Before computing the distances, add-one smoothing was
PAR nLL-T nLL-S PRE RCL FS KLF KLT
UNIF −3
.78 −3.37 16.95 (±0.75) 9.47 (±0.59) 12.15 3.057 2.318
HDC −4
.07 −2.22 44.31 (±0.99) 34.74 (±0.95) 38.94 1.784 0.623 TRA-T −2
.97 - 37.60 (±0.97) 28.14 (±0.90) 32.19 1.362 0.336 DET-T −∞ - 47.70 (±1.00) 40.90 (±0.98) 44.04 2.335 0.838
TRA-S - −2
.13 43.19 (±0.99) 35.68 (±0.96) 39.07 1.355 0.155
DET-S - −∞ 49
[image:6.595.115.482.62.149.2].39(±1.00) 43.04(±0.99) 46.00 2.310 0.825
Table 1: Results of the sample-based user simulator evaluation on the Mar’09 training corpus (the corpus coverage was59%for the turn-based and33%for the sequence-based matching approach).
PAR nLL-T nLL-S PRE RCL FS KLF KLT
UNIF −3
.61 −3.28 16.59 (±1.29) 9.32 (±1.01) 11.93 2.951 2.180
HDC −3
.90 −2.19 45.35 (±1.72) 36.04 (±1.66) 40.16 1.780 0.561 TRA-T −2
.84 - 38.22 (±1.68) 28.74 (±1.57) 32.81 1.405 0.310 DET-T −∞ - 49.15 (±1.73) 42.17 (±1.71) 45.39 2.478 0.867
TRA-S - −2
.12 43.90 (±1.72) 36.52 (±1.67) 39.87 1.424 0.153
DET-S - −∞ 50
.73(±1.73) 44.41(±1.72) 47.36 2.407 0.841
Table 2: Results of the sample-based user simulator evaluation on the Mar’09 test corpus (corpus coverage59%for the turn-based, and36%for sequence-based matching).
the turn-based approach and analogously TRA-S and DET-S for the sequence-based approach. The corresponding normalised (see Section 4.2.1) log-likelihoods are indicated by nLL-T and nLL-S.
Tables 1 and 2 give the results on the training and test data respectively. The results show that in terms of log-likelihood and KL-distances, the es-timated parameters outperform the other settings, regardless of the matching method. In terms of precision/recall (given in percentages with 95% confidence intervals), the estimated parameters are worse than the handcrafted parameters for turn-based matching, but have similar scores for sequence-based matching.
The results for the deterministic parameters il-lustrate that much better precision/recall scores can be obtained, but at the expense of variability as well as the KL-distances. It will be easier to train a dialogue policy on such a deterministic simula-tor, but that policy is likely to perform significantly worse on the more varied behaviour generated by the trained simulator, as we will see in Section 4.3. Out of the two matching approaches, the sequence-based approach gives the best results: TRA-S outperforms TRA-T on all scores, except for the coverage which is much lower for the sequence-based approach (33%vs.59%).
4.3 Policy evaluation results
Although the corpus-based evaluation results give a useful indication of how realistic the behaviour generated by a simulator is, what really should be evaluated is the dialogue management policy that
is trained using that simulator. Therefore, differ-ent parameter sets for the simulator were used to train and evaluate different policies for the Hidden Information State (HIS) dialogue manager (Young et al., 2009). Four different policies were trained: one policy using handcrafted simulation param-eters (POL-HDC); two policies using simulation parameters estimated (using the sequence-based matching approach) from two data sets that were obtained by randomly splitting the data into two parts of 358 dialogues each (TRA1 and POL-TRA2); and finally, a policy using a determin-istic simulator (POL-DET) constructed from the trained parameters as discussed in Section 4.2.2. The policies were then each evaluated on the sim-ulator using the four parameter settings at different semantic error rates.
The performance of a policy is measured in terms of a reward that is given for each dialogue, i.e. a reward of 20 for a successful dialogue, mi-nus the number of turns. A dialogue is consid-ered successful if the system has offconsid-ered a venue matching the predefined user goal constraints and has given the correct values of all requested slots for this venue. During the policy optimisation, in which a reinforcement learning algorithm tries to optimise the expected long term reward, this dia-logue scoring regime was also used.
hand--2 0 2 4 6 8 10 12
0 0.1 0.2 0.3 0.4 0.5
Average reward
Error rate
[image:7.595.310.528.67.223.2]POL-HDC POL-TRA1 POL-TRA2 POL-DET
Figure 2: Average rewards for each policy when evaluated on UM-HDC.
-4 -2 0 2 4 6 8 10
0 0.1 0.2 0.3 0.4 0.5
Average reward
Error rate
[image:7.595.76.292.68.224.2]POL-HDC POL-TRA1 POL-TRA2 POL-DET
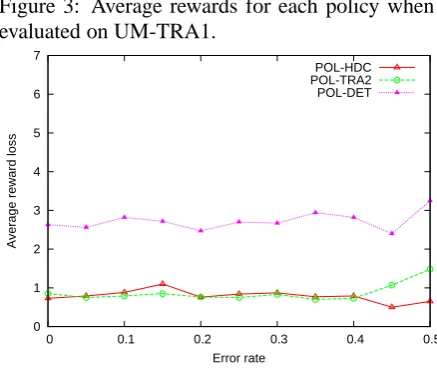
Figure 3: Average rewards for each policy when evaluated on UM-TRA1.
2 4 6 8 10 12 14 16
0 0.1 0.2 0.3 0.4 0.5
Average reward
Error rate
POL-HDC POL-TRA1 POL-TRA2 POL-DET
Figure 4: Average rewards for each policy when evaluated on UM-DET.
0 1 2 3 4 5 6 7
0 0.1 0.2 0.3 0.4 0.5
Average reward loss
Error rate
POL-HDC POL-TRA2 POL-DET
Figure 5: Average loss in reward for each policy, across three different simulators.
crafted error model that converts the user act gen-erated by the simulator into an n-best list of dia-logue act hypotheses.
The policy that was trained using the hand-crafted simulator (POL-HDC) outperforms the other policies when evaluated on that same sim-ulator (see Figure 2), and both policies trained us-ing the trained simulators (TRA1 and POL-TRA2) outperform the other policies when evalu-ated on either trained simulator (see Figure 3 for the evaluation on UM-TRA1; the evaluation on UM-TRA2 is very similar and therefore omitted). There is little difference in performance between policies POL-TRA1 and POL-TRA2, which can be explained by the fact that the two trained parameter settings are quite similar, in contrast to the handcrafted parameters. The policy that was trained on the deterministic parameters (POL-DET) is competitive with the other policies when evaluated on UM-DET (see Figure 4), but per-forms significantly worse on the other parameter settings which generate the variation in behaviour
that the dialogue manager did not encounter dur-ing traindur-ing of POL-DET.
In addition to comparing the policies when eval-uated on each simulator separately, another com-parison was made in terms of the average perfor-mance across all simulators. For each policy and each simulator, we first computed the difference between the policy’s performance and the ‘maxi-mum’ performance on that simulator as achieved by the policy that was also trained on that simu-lator, and then averaged over all simulators. To avoid biased results, only one of the trained simu-lators was included. The results in Figure 5 show that the POL-TRA2 policy is more robust than DET, and has similar robustness as POL-HDC. Similar results are obtained when including UM-TRA1 only.
[image:7.595.308.527.241.425.2] [image:7.595.73.291.260.424.2]other policies, it seems likely that policies trained using the trained user simulator will show im-proved performance when evaluated on real users. However, this claim can only be properly demonstrated in a real user evaluation of the di-alogue system containing different didi-alogue man-agement policies. Such a user trial would also be able to confirm whether the results from evalua-tions on the trained simulator can more accurately predict the actual performance expected with real users.
5 Conclusion
In this paper, we presented an agenda-based user simulator extended to be trainable on real user data whilst preserving the necessary rationality and complexity for effective training and evalu-ation of dialogue manager policies. The exten-sion involved the incorporation of random deci-sion points in the process of receiving and re-sponding to a system act in each turn. The deci-sions made at these points are controlled by prob-ability distributions defined by a set of parameters. A sample-based maximum likelihood approach to estimating these parameters from real user data in a corpus of human-machine dialogues was dis-cussed, and two kinds of evaluations were pre-sented. When comparing the statistics of real ver-sus simulated user behaviour in terms of a selec-tion of different metrics, overall, the estimated pa-rameters were shown to give better results than the handcrafted baselines. When evaluating dia-logue management policies trained on the simula-tor with different parameter settings, it was shown that: 1) policies trained on a particular parame-ter setting outperform other policies when evalu-ated on the same parameters, and in particular, 2) a policy trained on the trained simulator outper-forms other policies on a trained simulator. With the general goal of obtaining a dialogue manager that performs better in practice, these results are encouraging, but need to be confirmed by an eval-uation of the policies on real users.
Additionally, there is still room for improving the quality of the simulator itself. For example, the variation in user behaviour can be improved by adding more random decision points, in order to achieve better corpus coverage. In addition, since there is no clear consensus on what is the best ric for evaluating user simulations, additional met-rics will be explored in order to get a more bal-anced indication of the quality of the user simu-lator and how the various metrics are affected by modifications to the simulator. Perplexity (related to the log likelihood, see (Georgila et al., 2005)),
accuracy (related to precision/recall, see (Zuker-man and Albrecht, 2001; Georgila et al., 2006)), and Cram´er-von Mises divergence (comparing di-alogue score distributions, see (Williams, 2008)) are some of the metrics worth considering.
References
H. Cuay´ahuitl, S. Renals, O. Lemon, and H.
Shi-modaira. 2005. Human-computer dialogue
sim-ulation using hidden markov models. In Proc.
ASRU’05, pages 290–295.
K. Georgila, J. Henderson, and O. Lemon. 2005.
Learning user simulations for information state up-date dialogue systems. In Proc. Interspeech ’05.
K. Georgila, J. Henderson, and O. Lemon. 2006. User simulation for spoken dialogue systems: Learning and evaluation. In Proc. Interspeech/ICSLP.
S. Keizer, M. Gaˇsi´c, F. Mairesse, B. Thomson, K. Yu, and S. Young. 2008. Modelling user behaviour in the HIS-POMDP dialogue manager. In Proc. SLT, Goa, India.
E. Levin, R. Pieraccini, and W. Eckert. 2000. A
stochastic model of human-machine interaction for learning dialogue strategies. IEEE Transactions on
Speech and Audio Processing, 8(1).
J. Schatzmann, B. Thomson, K. Weilhammer, H. Ye, and S. Young. 2007a. Agenda-based user simula-tion for bootstrapping a POMDP dialogue system. In Proceedings HLT/NAACL, Rochester, NY.
J. Schatzmann, B. Thomson, and S. Young. 2007b. Statistical user simulation with a hidden agenda. In
Proc. SIGDIAL’07, pages 273–282, Antwerp,
Bel-gium.
K. Scheffler and S. Young. 2001. Corpus-based dia-logue simulation for automatic strategy learning and evaluation. In Proceedings NAACL Workshop on
Adaptation in Dialogue.
S. Singh, M. Kearns, D. Litman, and M. Walker. 2000. Reinforcement learning for spoken dialogue sys-tems. In S. Solla, T. Leen, and K. M¨uller, editors,
Advances in Neural Information Processing Systems (NIPS). MIT Press.
J. Williams. 2008. Evaluating user simulations with the Cram´er-von Mises divergence. Speech
Commu-nication, 50:829–846.
S. Young, M. Gaˇsi´c, S. Keizer, F. Mairesse, B. Thom-son, and K. Yu. 2009. The Hidden Information State model: a practical framework for POMDP
based spoken dialogue management. Computer
Speech and Language, 24(2):150–174.
I. Zukerman and D. Albrecht. 2001. Predictive statis-tical models for user modeling. User Modeling and