'
.
~.
·J - --~-· - - - ~~~._..,.,..,.., ... , "'"_.,__,__,, _,..._, J.~v. _,, '-'\.II.VUVl, J 17-J"'-~
Precise shape grading of coarse aggregate
L. J. O'Flannery* and M. M. O'Mahonyt
Lee MCullough and Partners; Trinity College Dublin
The objective of the research described here was to derive dimensional parameters to provide a unique descriptive fingerprint for any sample of coarse-aggregate particles. The practical component of the work focused on devising a quick and accurate field test capable of yielding values for the descriptive parameters to enable a coarse
-aggregate sample to be quantitatively appraised. The aim of the paper is to propose this test as a means of ensuring quality control of coarse-aggregate shape. The parameters used were derived from first principles and applied to realistic particle shapes using simple mathematical models. Standard specifications were analysed to identifY finite limits of acceptance for specific applications. These limits were then converted into precise terms of reference for the parameters. Extensive laboratory tests were performed on coarse-aggregate samples using the innovative test regime. The results show that such a system can be useful in providing information about an aggregate.
KEYWORDS: coarse aggregate; shape; grading
Notation
Ic cubicity index I r roundness index
I5 sphericity index
Ry ratio of Y dimension to X dimension
R= ratio of Z dimension to X dimension tolerance
Va volume of aggregate Ve volume of ellipsoid V0 volume of obloid
Wa mass of aggregate in saturated surface-dry
(SSD) condition
y specific gravity
Introduction
Coarse aggregates are a fundamental component in many fields of construction throughout the world, for
t Lecturer, Department of Civil, Structural and Environmental Engi-neering, Trinity College Dublin, Ireland.
* Engineer, Lee, MCullough and Partners, formerly student, Trinity
College, Dublin, Ireland.
(MCR 723) Paper received 7 September 1998; last revised 5 January
1999; accepted 3 March 1999.
example concrete (mass and reinforced), roadworks,
backfill, drainage and sewage treatment. There are sev-eral key factors that influence the ultimate suitability of
an aggregate for a particular application, of which com-pressive strength, shape and texture are the most impor-tant. The objective of the proposed work is precisely to classify the shape of any coarse aggregate by means of three new indices. The cubicity index Ic will be used to describe the overall shape of the particle, and the
spheri-city index Is and the roundness index Ir will be used to
indicate the effective surface curvature of the particle.
The shape requirements, on a macroscopic scale, for
aggregates for use in concrete, are essentially such that the particles produce a dense, interlocked mass. If the resultant mass is of less than optimum density, the
finished concrete will rely too heavily on the sand/
cement matrix for load transfer and will be accordingly weaker than a concrete that transmits imposed loads
I
through the coarse-aggregate structure. John found that perfectly rounded particles may compact with a
porosity of approximately 48% when ordered in
open-pack formation, whereas De Wiest2 found more angular particles, similarly ordered, will tend to exhibit a poros-ity of up to 60%. Other tests' found porosity values of 26% for perfectly rounded particles of varying dia-meters in close-pack formation, whereas De Wiest2 measured porosity values of 0% for angular particles
such as cubes. In tests with pentahedra and tetrahedra,
319
0 'Flannery and U 'Mahony
it has been determined that the porosity may decrease
below the 26% value mentioned above by virtue of
interdigitation, i.e. impinging angular comers occupy-ing interstitial space at an increasoccupy-ingly efficient rate.
The theoretical minimum porosity of 0% occurs when
perfectly regular obloidal particles are arranged in an
ideal formation. The minimum value is essentially ideal
because it takes into account neither the possibility of
non-obloidal shapes, nor the possibility of irregularity of shape or the random element of particle arrangement.
The theoretical maximum porosity is slightly more
com-plex since it must take into account the various possible
particle shapes and arrangements. De Wiest2 quotes a
value of 60%, although he does not indicate the means
by which this was found. However, a reasonable
approx-imation may be derived from first principles.
In general, the requirements for aggregate shape are
largely dependent on whether the resultant concrete
ele-ment is required to withstand high or low stresses. ln the
former case the particles must be densely compacted and well interlocked. The particles must therefore be angular enough to compact well through interdigitation,
but not too angular so as to produce excessive voids or
risk breakage of the sharp comers. On the other hand, a
concrete element expected to resist low levels of stress
may be composed of either subangular, subrounded or
rounded coarse-aggregate particles.
Th
e
o
re
t
ic
al
s
h
ape requirements
Lees3 states that the shape characteristics of
aggre-gates can have marked effects on the properties of both fresh and hardened concrete. These effects tend to be
beneficial where the predominant particle shape is
gen-erally equidimensional, and detrimental where it is
flaky and/or elongated.4-6 A certain amount of
flaki-ness and elongation is generally tolerated, although it
would seem more meaningful to convert the specified
percentage of cubical and non-cubical shapes into a
single measure of shape with which the average shape
of the particles could be compared. Such a method is
proposed below.
Let the longest, middle and shortest dimensions of a
particle be termed X, Y and Z, respectively. Let each
dimension be represented as a proportion of the longest
dimension by dividing each by X, and let the
propor-tions of Y to X and Z to X be termed R y and R=,
respectively. This method serves to simplify the
de-scription of the aggregate particle's shape in broad
terms, by describing proportions of a bounding obloid.
Employing this method to a particle which has
dimen-sions 20 mm, 15 mm and 10 mm, yields, for example,
the descriptive parameters Rv = 0·75 and R= = 0·5.
Typical standards for concrete suggest that the
descrip-tive parameters Ry and Rz must lie within the range 0·6
to 1·00. Therefore one could consider that a typical
cubical particle would have parameters of Ry = 0·8 and
320
R= = 0·8. The differences from the extremes of the
range are ±0·2, giving a tolerance of ±25%. A typical
non-cubical particle may be similarly expressed by
Rv = 0·3 and R= = 0·3, with a tolerance of±IOO% .
. ASTM C33 7 does not place a limit on the percentage
of non-cubical particles allowed but other standards do.
For example, the Irish Standard IS 58 suggests that the
maximum percentage of non-cubical particles permitted
in structural concrete is 40%. Using 40% and the pre-viously derived descriptive parameters as an example, it would be valid to derive a description of the desired
mean particle as 60% cubical and 40% non-cubical,
where Ry = 0·6 X 0·8
+
0-4 X 0·3 = 0·6 and where,similarly, R= = 0·6. The tolerance may be calculated in a similar manner as t = 0·6 X 25
+
0-4 X 100 =55%. Applying the tolerance to the desired mean yields amaximum value of R, and
R:
of 0·6 X (1·00+
0·55) = 0·93. Similarly, the minimum value of R, and
R- can be calculated to be 0·27.
-Compliance with the IS 58 standard is achieved when
the mean values for Ry and Rz are not less than 0·6 and
individual values for Ry and Rz are not less than 0·27.
Applying these constraints to a nominal 20 mm particle
with an X dimension equal to 20 mm, the mean Y and
Z values for the sample must not be less than 12·0 and
the minimum value for any individual Y or Z value is
5-4 mm. Since the assumed accuracy of compliance with
the standard tests (BS 8129) is 95% confidence, it would
seem reasonable to consider the mean Rv and R= values
of 0·6 X 0·95 = 0·57 as borderline but acceptable, i.e.
the mean Y or Z value of 12·0 mm could decrease to
II A mm and still satisfy the specified requirements.
Aggregate production
Holmes10 proposed two general properties common
to all types of rock that provide the basis for strength
and durability, namely crystalline interlock and
crystal-line bonding. Crystalline interlock is defined as the
tendency of the individual particles to impinge on each
other because of their interwoven orientation, also
known on a macroscale as interdigitation. Crystalline
bonding is defined as the chemical binding forces that
induce the crystals to adhere to one another through the
cementing action of a pervading matrix. Robinson 11
stated that igneous rocks possess a strongly defined
crystalline structure with relatively large crystals which
rely solely on immensely powerful crystalline interlock
for strength. The influence of interlock in sedimentary rocks is far less apparent because the rounded,
ce-mented particles lack crystalline angularity, with a
re-sultant decrease in strength. Metamorphic rocks are generally the most dense, being formed under greater
10
forces than the other two types. These rocks possess
strength due to crystalline interlock but also planes of weakness from degraded crystalline bonding because of
mechanical and chemical alteration.
Magazine of Concrete Research, 1999, 51, No. 5
~
.
Coarse-aggregate particles are commonly formed by natural and/or induced breakage of the parent rock into polyhedral shapes, which may then be further modified by rounding. The original polyhedral shape is largely dictated by the type and condition of the parent rock and the method of breakage. There are three distinct polyhedral types for the purposes of engineering: tetra-hedra, having four faces; pentahedra, five faces; and hexahedra, six faces. For practical purposes, particles with more than six faces may be considered to be hexahedral with rounding.
There are two broad categories of coarse aggregates,
which generally reflect both their origin and their
over-all shape, i.e. crushed and uncrushed. Crushed
aggre-gates are formed by passing large pieces of rock
through a configuration of crushers, which invariably
results in producing aggregate with a high degree of
angularity. Uncrushed aggregates are naturally occur
-ring pebbles found in coastal areas, along river beds
and in glacial moraines.
Indices
It is mathematically convenient to consider, as a
general case, an aggregate particle that is a slightly
rounded, regular hexahedron proportioned somewhere
between an obloid (three-dimensional oblong) and an
ellipsoid (three-dimensional ellipse). As a convention,
the longest dimension of the particle will be termed X
in the x direction, the vertical dimension will be termed
Y in the y direction and the third dimension will be termed Z in the z direction.
The first property for consideration is form. Consider
a particle as a perfect obloid of dimensions X, Y and Z.
This obloid may be said to be the bounding obloid of the
true particle since it shares the same overall dimensions.
The concept of cubicity is now introduced. Let the
cubicity index (!c) be defined as the volume of the obloid expressed as a percentage of a bounding cube. The cube will possess equal X, Y and Z dimensions:
lOOXYZ
lc = ----=--X3 (1)
The cubicity index provides immediate indications of the likely degree of potential compaction and therefore the probable porosity, subject to the particle's ability to integrate with neighbouring particles by interdigitation and rounding.
When dealing with a more realistic case of a particle shaped as a slightly rounded regular hexahedron, the true volume of the particle will normally lie between the volume of the bounding obloid and the volume of the ellipsoid of identical principal dimensions. The volume of the obloid is given as
Vo
=
XYZ (2)and the volume of the ellipsoid is
Magazine of Concrete Research, 1999, 51, No. 5
.)nape graazng oj coarse aggregate
v
_
nXYZe -
-6 (3)
The concept of sphericity is now introduced, where the sphericity index Us) is the volume of the aggregate expressed as a percentage of the bounding obloid. It may be described as
100Va
Is=
--v;;-
(4)where Va is the volume of the aggregate. For the purposes of the paper the indices will be expressed as dimensionless integers.
Particle shape
Particles with an lc value between 60 and 100 may be classed as cubic, whereas Ic values between 30 and 60 indicate flakiness and values below 30 suggest elon-gation. There is a broad distinction between hexahedra, with Is values between 50 and 100, and both penta-hedra and tetrahedra, with Is values between 17 and 50, where tetrahedra have values close to the former and pentahedra to the latter. The accurate quantification of angularity and roundness is more appropriately de-scribed by the value of the roundness index I,, where particles with I, values between 84 and 100 may be classed as angular, while particles with I, values be-tween 52 and 68 may be classed as rounded. It is apparent from this method of description that terms such as subrounded and subangular may now be desig-nated precise numerical values for determination by an objective and universal test.
In the case of a hexahedron, I, = Is. For a penta-hedron, I,
=
2Is and in the case of a tetrahedron, I,=
6Is. The I, values seldom falls below 50 unless the aggregate is prone to conchoidal or concave fracture. Relating porosity to these shape indices, it has been found that (100-Is) may be regarded as the maximum porosity of the aggregate since it represents the porosity associated with an ideal square packing arrangement.The strongest advantage of describing an aggregate particle in terms of the index values mentioned above is that the definition is both precise and universally reproducible, regardless of rock type, condition or geo-logic origin. The second advantage is that it enables the aggregate shape to be assessed relatively quickly by means of a short and simple test which may be carried out in the field.
Test for measurement of indices
The principal objective of the test was to accurately measure and record physical dimensional data of sam-ples of coarse-aggregate particles. The data was su bse-quently employed in calculations to provide values for
u r tannery una v LVJanuny
Ic, Is and I,, which form a definitive and reliable
means of describing the particle shape. Two samples,
each containing 100 particles, were subdivided from a
larger sample by random selection. Each particle in each sample was measured for X, Y and Z dimensions using a vernier caliper. The dimensions were recorded to the nearest millimetre and the particles were weighed
to the nearest 0·1 g. From these dimensions the values
of Rx, Ry, Rz, V0 and Ic were found. The Is value was
calculated using a measurement of the volume of the aggregate by means of the BS 81212 test or a field test version of the test using volumetric displacement. The latter tends to yield results within 3% of the former and
takes 0·5 h to execute, compared with the BS test, which takes two days.
Having determined the specific gravity (y) for the
saturated, surface-dried (SSD) sample, the actual vo
-lume ( Va) was calculated using the expression
Va = Wa
y (5)
where Wa is the mass of the aggregate in an SSD condition. Is was then calculated in accordance with
equation (4).
As the analysis of the results assumes random values
constrained by an S distribution, according to Francis 13
it was necessary for the sample size to exceed 30 in number as a prerequisite for probabilistic validity. The nominal aggregate sizes under consideration were
14 mm, 20 mm and 40 mm. It was found to be
conve-nient to use 100 particles of the 14 mm and 20 mm aggregates and 50 particles of the 40 mm aggregate.
Initially two samples of each aggregate were tested, but as the results proved consistent a single sample was
used thereafter.
At the same time as the principal dimensions of each
particle were being measured and recorded, the shape
of the particle was examined and recorded as an
ap-proximation of either a hexahedron, a pentahedron or a
tetrahedron. In the event that a definite form was not obvious, the approximation of hexahedral was awarded
by default.
The maximum and probable errors associated with
the test will now be considered. The first phase of the test was the determination of the dimensions. The error in this phase is associated with the rounding up of each particle dimension to the nearest millimetre, giving a resultant error of ±0·5 mm and a probable error of
±0·25 mm. It is useful to express the maximum
possi-ble error in terms of a percentage of the total volume
of the bounding obloid, which in turn is a function of
both the nominal particle size and the dimensional regularity. If the error is expressed as a percentage of
the I c value the maximum error for a 20 mm nominal particle, for example, will be ±7·5%.
After the shape parameters of the aggregate were established, the porosity of the bulk aggregate was
322
measured using a test similar to the voids measurement
test in BS 812.12
Test results
Four types of aggregate, described as follows, were
tested using the proposed regime:
• type A: 14 mm, 20 mm and 40 mm nominal sizes of
crushed basaltic andesite
• type B: 14 mm, 20 mm and 40 mm nominal sizes of
crushed siliceous limestone
• type C: 14 mm and 20 mm nominal sizes of crushed greywacke
• type D: 14 mm, 20 mm and 40 mm nominal sizes of
partially crushed limestone gravel.
Each test sample was coded to indicate the parent
source, nominal particle size and identity. For example,
the two test samples of 14 mm greywacke were coded
CIA and CIB, where 'C' means type C, 'l' is for
14 mm nominal size and 'A' and 'B' refer to the sample
number.
The specific gravity of the aggregates on an SSD
basis ranged from 2·57 to 2·74 and the water absorption
values on an oven-dried basis were 2·5-2·7%. As
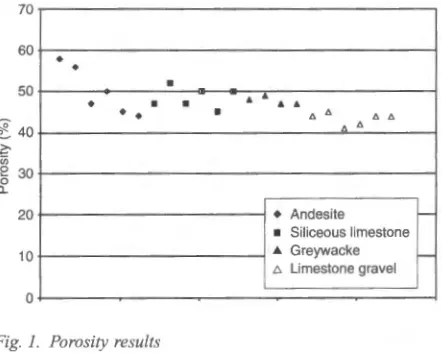
ex-pected, the results were quite consistent. Fig. 1 shows
the porosity test results, where it can be seen that they fall within the range 41-5 8%.
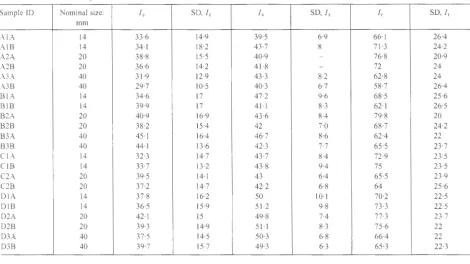
In Fig. 2 the field test results for Ic can be seen. In
almost all cases the Ic values are between 30 and 60,
indicating a degree of flakiness in all samples. The
standard deviations are presented in Table I. In
sum-mary, they are relatively large, reflecting the natural
variation of the material.
Figure 2 also shows the field test results for Is,
where it can be seen that the results are below 52,
indicating for the most part that the particles show
characteristics normally associated with pentahedra.
The I, results are also presented in Fig. 2. When these results are examined in detail (Table I) it can be seen
70
60
50
~ 40 z:.
·u;
e 3o
0 o._
20
10
0
•
•
•
• •
•
Fig. 1. Porosity results
•
•
..
..
.....
•
"' "'
"'
"'
A 6
• Andesite
f-• Siliceous limestone • Greywacke f-"' Limestone gravel
[image:4.612.335.556.533.711.2]•
60
50
• •
-40
~
,.
•
•
•
Q)
:::J
~ 30
•• •
X
•
Q)
"0
• ••
.!: 20
•
10
0
Andesite
.
•
•
•
•
••
•
_.
..
•
•
•
• • •
•
Siliceous Limestone
Fig. 2. Indices of samples
•
•••
·.
•
•
•
•
••
Greywacke
•
&•
••
.·
• •••••
.
-• lr
• lc
"'Is
Limestone
Gravel
r---1
that the smaller particle sizes, i.e. 14 mrn and 20 mrn, of the basaltic andesite and partially crushed limestone
gravel are angular, whereas the 40 mrn particles are
rounded. This may be due to the higher levels of
crush-ing required for smaller particle sizes. The crushed
siliceous limestone follows this trend in part but the
conclusion is not as convincing in this case. The
20 mrn crushed greywacke particles indicate rounding,
whereas the 14 mrn particles are angular.
Figure 3 shows the test results for the shape profiles
of the samples, expressed in percentages of tetrahedral, pentahedral and hexahedral particles. There is good
correlation between profiles for pairs of samples,
de-spite the relatively small sample size and the variability
of the material.
When comparing the results with the standards for
concrete, it can be observed that ten out of 22 samples
Table 1. Measurements of indices
Sample JD Nominal size: I, SD, I,
mm
AlA 14 33-6 14·9
AlB 14 34·1 18·2
A2A 20 38·8 IS·S
A2B 20 36·6 14·2
A3A 40 31·9 12·9
A3B 40 29·7 IO·S
BIA 14 34·6 17
BIB 14 39·9 17
B2A 20 40·9 16·9
B2B 20 38·2 15-4
B3A 40 4S·I 16-4
B3B 40 44·1 13·6
CIA 14 32·3 14·7
CIB 14 33·7 13·2
C2A 20 39·S 14·1
C2B 20 37·2 14·7
OIA 14 37-8 16·2
OIB 14 36·S IS·9
02A 20 42·1 IS
02B 20 39·3 14·9
D3A 40 37·S 14·S
03B 40 39·7 IS·7
Magazine of Concrete Research, 1999, 51, No. 5
"-''"'lA<_}/.._. 6 ' W.IA<Hf.6 VJ 1..-VW.I ..JC.. W.55 1 C. OUt-C..
90
80
70
• Tetrahedral
I
I
• Pentahedral
"' Hexahedral f---,---,--~
•
• •
•
60~50
•
• • •
•
•
•
Q)
§- 40
.<::: (J)
•
• •
•
•
30
•
•
• •
20
• ••
•
I•
•
•
.
•
•
.
•
•
-10 •
•
0
+---~----~---Andesite Siliceous Greywacke Limestone
Limestone Gravel
Fig. 3. Results for shape profiles
(45%) fail to provide 95% confidence in the smallest
dimension and may be judged flaky by BS 8129 for concrete production. Having a means of identifying
such an issue may help concrete designers in their
choice or combination of materials.
Classification
b
y
test parameters
The test yields values for three parameters that are unique to the sample and may be used as a description
or 'fingerprint' for the coarse-aggregate particles. It
was originally envisaged that simple mathematical modelling would be able to entirely replace the present empirical method of visual inspection and classification into the categories of round, irregular and angular. However, it has been found that while an expression
I, SO, I, I,
so
,
I,39·S 6·9 66·1 26-4
43·7 8 71·3 24·2
40·9 - 76·8 20·9
41·8 - 72 24
43·3 8·2 62·8 24
40·3 6·7 S8·7 26-4
47·2 9·6 68·S 2S·6
41·1 8·3 62·1 26·S
43·6 8-4 79·8 20
42 7·0 68·7 24·2
46·7 8·6 62·4 22
42·3 7-7 6S·S 23·7
43·7 8-4 72·9 23·S
43-8 9-4 7S 23·S
43 6-4 6S·S 23·9
42·2 6·8 64 2S·6
so
10·1 70·2 22·SSl·2 9·8 73·3 22·S
49·8 7-4 77-3 23·7
SI·I 8·3 7S·6 22
S0·3 6·8 66-4 22
49·3 6·3 6S·3 22·3
[image:5.612.55.278.15.185.2] [image:5.612.304.521.20.175.2] [image:5.612.56.526.449.713.2]V 1' J,Uflflt:f y UHU V lYlUHUHY
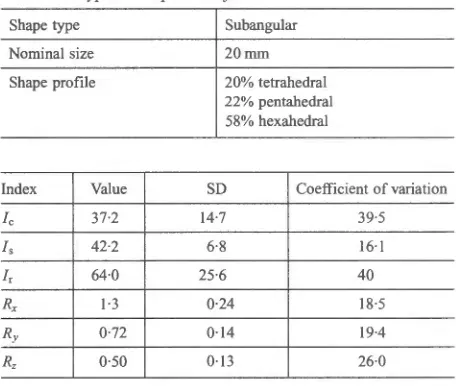
Table 2. A typical shape classification
Shape type
Nominal size
Shape profile
Subangular
20mm
20% tetrahedral
22% pentahedral
58% hexahedral
Index Value SD Coefficient of variation
I, 37·2 14·7 39·5
I, 42·2 6·8 16·1
I, 64·0 25·6 40
Rx 1·3 0·24 18·5
Ry 0·72 0·14 19-4
R= 0·50 0·13 26·0
may be formulated to describe the proximity of a parti-cle to an ideally rounded or angular model, it cannot discern whether the loss of protruding comers has resulted in angular or rounded surfaces. While the test is able to provide precise and accurate quantification of
the particle shape, it is unable to make the fundamental distinction between the true roundness of a well-worn
beach pebble and the effective roundness of a severely
angular polyhedron of the same gross shape and
vo-lume. Consequently, it should be the role of the shape test to supplement rather than supplant the visual test. From the foregoing, it is apparent that a typical shape classification for a sample of coarse-aggregate particles would be similar to that presented in Table 2.
Conclusions
The objective of the research was to devise a means of providing a precise, quantified description of a
sam-ple of coarse-aggregate particles. The method proposed
324
was by the use of a set of shape indices. The paper
defines a set of descriptive parameters for coarse
ag-gregates and describes a test for finding them. It also
discusses the results of the test on several
coarse-aggre-gate samples and comments on its usefulness but also
on its shortcomings. The method proposed in the paper
is more quantifiable than other, more subjective method
of describing particle shape. It effectively enables the
determination of a 'fingerprint' for any coarse-aggre-gate sample.
References
I. JOHN V B. Introduction to Engineering Materials. MacMillan.
London, 1978.
2. DE WIEST R. J. M. Geohydrology. Wiley, London, 1965. 3. LEES G. The measurement of particle shape and its influence in
engineering materials. Journal of the British Granite and
Whin-stone Federation, 1964, 4, No. 2.
4. KAPLAN M. F. The effects of the properties of coarse aggregates on the workability of concrete. Magazine of Concrete Research, 1958,10, No. 29,63-74.
5. KAPLAN M. F. Flexural and compressive strength of concrete as
affected by the properties of coarse aggregates. Journal of the
American Concrete Institution, 1959, 55, 1193-1208.
6. NEVILLE A. M. Properties of Concrete, 3rd edn. Pitman, London,
1981.
7. AMERICAN SOCIETY FOR TESTING AND MATERIALS. Standard Specification for Concrete Aggregates. ASTM, Philadelphia,
1997, C33-97.
8. Aggregates for Concrete. Institution for Industrial Research and Standards, Dublin, 1974.
9. BRITISH STANDARDS INSTITUTION. Methods for Determination of Particle Shape. BSI, Milton Keynes, 1989, BS 812: Part I 05.
10. HOLMES A. Principles of Physical Geology. Nelson,
Walton-on-Thames, 1978.
II. ROBINSON E. S. Basic Physical Geology. Wiley, New York, 1982.
12. BRITISH STANDARDS INSTITUTION. Testing Aggregates. BS!,
Milton Keynes, 1995, BS 812: Part 2.
13. fRANCIS A. Business Mathematics and Statistics. DP Publica-tions, London, 1988.
Discussion contributions on this paper should reach the editor by
31 March 2000
Magazine of Concrete Research, 1999, 51, No. 5