Munich Personal RePEc Archive
Economic Implications of Business
Dynamics for KE-Associated Economic
Growth and Inclusive Development in
African Countries
Asongu, Simplice and Amavilah, Voxi and Andrés, Antonio
R.
6 December 2014
Online at
https://mpra.ub.uni-muenchen.de/63793/
1
AFRICAN GOVERNANCE AND DEVELOPMENT
INSTITUTE
A G D I Working Paper
WP/14/023
Economic Implications of Business Dynamics for KE-Associated
Economic Growth and Inclusive Development in African Countries
Simplice A. Asongu
African Governance and Development Institute, Yaoundé, Cameroon.
E-mail: [email protected]
Voxi Amavilah Glendale College, Economics,
PO Box 38061 Phoenix AZ 85069-8061 USA E-mail: [email protected]
Antonio R. Andrés
Universidad Camilo Jose CelaFacultad de CC. Jurídicas y Económicas C/
Castillo de Alarcón, 49 – Urb. Villafranca del Castillo 28692 – Villanueva de la Cañada (Madrid).
2 © 2014 African Governance and Development Institute WP/14/023
AGDI Working Paper
Research Department
Economic Implications of Business Dynamics for KE-Associated Economic
Growth and Inclussive Development in African Countries
Simplice A. Asongu, Voxi Amavilah & Antonio R. Andrés
December 2014
Abstract
This paper develops an empirically-relevant framework (a) to examine whether or not the African business environment hinders or promotes the knowledge economy (KE), (b) to determine how the KE which emerges from such an environment affects economic growth, and (c) how growth in turn relates to the‘inclusive development’ of 53 African countries during the 1996-2010 time period. The framework provides a modest guide to policymaking about, and further research into, such relationships. We implement the framework by building a three-stage model and rationalizing it as five interrelated hypotheses. To allow greater concentration on the issues that are themselves already complex, our model is very simple, but clear. For example, we make neither an attempt to evaluate causality nor to test for it, even though we suspect the links to be multi-directional – opportunity costs are everywhere. Instead we focus on fundamental relationships between the dynamics of starting business and doing business as expressed in the state of KE, and through it to the inclusive development via the economic growth of those countries. Estimation results indicate that the dynamics of starting and doing business explain strongly a large part of variations in KE. The link between KE and economic growth exists, but it is weak, and we provide plausible reasons for such a result. Despite the weak association between KE and economic growth, KE-influenced growth plays a very important role in inclusive development. In fact, growth of this kind has stronger effects on inclusive development and by implication on poverty reduction, than some of conventional controls in this study such as FDI, foreign aid, and even private investment. There is clearly room for further research to improve the results, but just as clearly practical policy is best served by not neglecting the relationships examined in this paper.
JEL Code: L59; O10; O30; O20; O55
3
1. Introduction
The objective of this paper is three-fold: (a) to examine whether or not the African business
environment hinders or promotes the knowledge economy (KE), (b) to determine how the KE
which emerges from such an environment affects economic growth, and (c) how growth in turn
relates to the‘inclusive development’ of 53 African countries during the 1996-2010 time period.
By the national business environment we mean conditions surrounding starting business and
doing business. More specifically, we refer to such conditions as business dynamics, and they
include: (a) dynamics of starting business, and (b) dynamics of doing (operating) business. Even
though we will be talking only of “doing business”, technically the dynamics of doing business
include (i) trade, (ii) technology exports and/or imports, (iii) property rights and, (iv) closing
business1.
The examination is important for a number of reasons including the following four. First, at the
microeconomic level business dynamics influence the value of the firm, and in a world
increasingly driven by technologies of all sort, the value of the firm affects the long-term
development, sustainability, and performance of the KE (Ernst & Young, 2013; Leke et al.,
2010; Anyanwu et al., 2012; Kuada, 2009). This first contribution is in line with the Sustainable
Development Goals (UN, 2013, pp. 7-13).
Second, the performance of KE ultimately affects the competitiveness of nations, which in turn
has measurable implications for economic growth and inclusive development. We deliberately
utilize the notion of inclusive development to suggest that our analysis goes beyond assessing the
growth-development nexus of the conventional variety to inclusive development, because
‘output may be growing, and yet the mass of the people may be becoming poorer’ (Lewis, 1955, emphasis added). This Lewisian thesis has been recently rediscovered by Piketty’s (2014)
‘Capital in the 21st Century’ in developed countries along with a growing stream of literature on developing nations (Kalwij & Verschoor, 2007; Thorbecke, 2013; Fosu, 2009, 2014; Singh,
2014).
1
4 Third, there is continued effort aimed at enhancing understanding of the factors and forces
determining the KE in African countries to which this paper seeks to contribute. The contribution
extends recent African literature on institutional determinants of innovation (Oluwatobi et al.,
2014), business research (Sigue, 2011), and entrepreneurship (Brixiova et al., 2015) needed for
the continent to emerge from poverty (Kuada, 2011). Studies closest to the current exposition in
the literature include Tchamyou (2014ab). Tchamyou (2014a) has investigated the role of KE in
African business while Tchamyou (2014b) has assessed the reverse relationship, i.e., the impact
of entrepreneurship on KE in Africa. The latter study informs the first-stage of empirical analysis
of the current study. We build on it by incorporating economic growth in the second stage, and
inclusive human development in the third stage. While business dynamics might obviously
influence KE, we go two steps further in investigating how the nexuses are growth-enhancing on
the one hand, and on the other hand, how ‘the positive externalities of the growth-enhancing KE
from business dynamics’ might seep through onto inclusive development.
Finally, and as far as we know, extant theoretical and empirical work ignores, and/or pays
insufficient attention to, the essential links between African business dynamics, KE, economic
growth, and inclusive development.
We approach the issues in a stylized three-stage fashion (model) in which business dynamics
affect KE, KE affects economic growth, and growth affects inclusive development. The model is
estimated and tested as five interrelated hypotheses. In doing so we find that starting and doing
business do indeed explain a large part of variations in KE observed in African countries, and
that KE has affected growth, and through growth inclusive development. The magnitudes of the
effects are low at all three stages, but they are reasonably signed and statistically and/or
economically significant. We conclude that the three stages are critical to the future progress of
African countries, and call policy and further research attention to them.
The rest of the paper is organized as follows. Section 2 reviews the relevant literature, and is
followed by the methodology in Section 3. Section 4 presents the empirical results, while Section
5
2. Literature
This section is divided into four sub-sections, each with a specific theme that forms the basis for
the structure of the hypotheses and the estimation technique deployed in subsequent parts of the
paper. While stylized, the approach is simple, clear, and easy both to implement and follow.
2.1 Business Dynamics and Business Performance
The general literature on the effects of the business environment (climate) on the performance of
firms is huge and very old. Michael E. Porter (1990, 1998) traces the literature back to Adam
Smith’s concepts of division of labor, comparative advantage, and specialization across
economies as illustrated by the example of the safety pin factory (Smith, 1937[1776], cf. Stigler,
1957).2 Influenced by Smith regional economists (like Krugman) and other regional scientists
(mainly economic geographers) have long insisted that the optimal location of an economic
activity is a function of the basic business costs as well as location-specific costs (Richardson,
1969). The determinants of such costs (and benefits) include the availability of primary factors of
production (land, labor, capital, and entrepreneurship), availability of, and accessibility to, local
and global product and money markets, availability of good transport and physical infrastructure
systems, and opportunities for agglomeration and other external economies made possible by the
availability of amenities like libraries, schools/colleges/universities, social networks, and so on.
Porter (1998) has depicted all these in a simple but clarifying diagram with four interactive
vortexes, representing the “firm strategy, structure, and rivalry” in one vortex, “related and
supporting industries” in the second vortex, the “factor conditions” (supply) in the third vortex,
and in the fourth vortex “demand conditions” – all subject to random chance and non-random
government policy (see Porter’s Figure 1, 1990, p. 127, or 1998, p. 9). David Neven and
Cornelia Droge (2001) have dubbed Porter’s scheme the “Porter’s diamond model.”
Despite Porter’s brilliant effort, the general theory of the business climate is a lot more complex
than the optimal location theory of the firm (business). Experts know from observations that
businesses do not always set up in their lowest cost and/or highest profit locations. However, old
2
We assume that the economist reader already knows that the concept of comparative advantage is due David
6 ideas hardly die; they only find new applications, and African countries are no exceptions to this
rule. Let’s take a quick look.
According to N’da (2012) the cost of doing business in Sub-Saharan African countries (SSACs),
as assessed by the World Bank in its annual Doing Business reports, depends on nine main
indicators of the quality of business environment. They are: the ease of setting up a business,
obtaining construction permits, enforcing and transferring property rights, securing loans,
protecting investors, paying taxes and fees, cross border trade and other transactions, fulfilling
contractual obligations, and resolving insolvency, and other shut-down conditions. Together
these indicators suggest further that the transparency of the business dynamics are important to
trade and foreign direct investment (FDI), and hence to the KE. Furthermore, the recent
co-publication of the World Bank (WB) and the International Finance Corporation (IFC) on Doing
Business in the East African Community (2013) revealed that only 10 SSACs rank among the top
100 of 185 countries in which it is easy to do business. The next small group fall somewhere
between 109 and 134 places, and the majority of SSACs rank below the 169th place (cf. other
regions http://www.doingbusiness.org). More importantly, while the report is recent, the issues it
raises about the business environment are not new, at least not to the experts in the area. For
example, Eifert, Gelb, and Ramachandan (2005) pulled together microeconomic and
macroeconomic evidence on the competitiveness of African manufacturing sectors. They found
that it is determined by the business climate, which affects the relative advantages and external
economies of those sectors. They concluded that “Africa is high-cost relative to its income and
productivity,” and they recommended reforming business attitudes and practices there.
Spring, Rolfe, and Odera (2013) studied the SSA business environment by major regions. They
found improving economic factors and forces including economic growth, trade, infrastructure,
and FDI. Political dimensions of the business climate are a toss with some regions and countries
being more unstable than others. Health, cultural and social aspects of the business dynamics
remain somewhat negative. Consequently the authors surmised that the business environment
remains challenging in SSACs where regulatory, contract enforcement, difficulty of starting
7 Although the business environment and its effects on business activity have origins in standard
economic theory, recent traditional economic literature on the topic is not as voluminous as the
literature coming from business economists and economic journalists. A rare exception is that the
Journal of African Economies devoted space in one of its 2001 issues to the African business
environment with special reference to investment. Fosu, Mlambo, and Oshikoya led the
discussion with an overview and they concluded that “despite more than a decade of reform in
many African countries, investment and growth rates are still far below the levels required for
sustainable development” (p.1). In particular, Mlambo and Oshikoya examined macroenomic
factors and forces affecting investment in Africa and discovered that the business climate,
represented by fiscal, financial and monetary policy, as well as macroeconomic uncertainty and
trade-related issues have had enormous influence on private investment. They concluded that the
political setting, more precisely political (in)stability as a proxy for the business climate,
“matters for investment,” and external shocks resulting from the volatility of the narrow export base and unfavorable terms of trade “have had a negative impact on private investment recovery”
(ib.).
Also in the same issue Jan W. Gunning and Taye Mengistae (2001) surveyed microeconomic
evidence on manufacturing investment in Africa during the 1990s. They uncovered that the
market processes have selected the survival of efficient firms in African countries as strongly as
they did elsewhere, so that while macroeconomic literature show that low returns of investment
in Africa explain poor economic growth there, microeconomic evidence suggest high returns.
Thus, the low real rates of investment are more likely due to the politically risky business
environment than anything else. Devarajan, Easterly and Pack (2001) appear to disagree with
Gunning and Mengistae’s assessment, because their cross-country data and micro data from
Tanzania indicate that investment in Africa is not too low. In fact the low marginal impacts of
investment on growth suggest too much, not too little, investment.
Marcel Fafchamps’s (2001) very interesting and unique article focused on network and other
externalities of business dynamics. He reasoned that network and external transaction costs have
a tendency to lock market participants into inefficient and unequal long-term relationships.
8
particularly peculiar. We concur that a methodological approach like Fafchamps’s which does
not seem to assume a negative business climate a priori is attractive to us as it allows for
exceptions to the rule. Variations in the business environment across countries, regions and
industries even within the same country clearly show that exceptions do exist. For instance, with
respect to revenue in the mobile technologies sectors in Africa higher operators’ tariffs may be
attributable to less than conducive business dynamics surrounding mobile technologies in Africa
compared to other regions in the world. However, over the 2003-2008 years, measured by the
Herfindahl index, African mobile markets have become more competitive than before and
market penetration rate has increased. Consequently variable network cost/traffic minute for 14
African mobile operators have fallen – implying considerable economies of scale along with
network effects (Gutierrez, Lee and Virto, 2009; Gille, Noumba Um, Rudel, and Simon, 2002;
Esselaar, Gilwald, and Stork, 2007; Gilwald and Stork, 2008). All these cannot be explained by a
negative business climate, perhaps not even by a positive one alone.
2.2 From Business Dynamics to KE
A KE is a shortcut for a knowledge-based economy. According to the WB a KE has four pillars,
and their corresponding indicators. Therefore any business environment that affects the creation,
transfer, and spread of knowledge essentially affects the very foundation of the KE. Changes in
any of the four pillars, or indicators, of the KE are changes in the KE itself, with all potential to
lower, or raise countries’ performance and ranking on the knowledge economy index (KEI).
Again as indicated in the introduction above,we are unaware of any study that specifically links
business dynamics, or their indicators, to the KE. This study attempts to fill that gap in
understanding.
The attempt is not starting from scratch in the literal sense. It is commonsensical that since KE is
a function of investment in the four pillars or their indicators, any business climate that interferes
with the investment in the four pillars, also interferes with the KE. We know, for instance, from
Erik Stan and Elizabeth Garnsey (2006) that knowledge facilitates entrepreneurship and the latter
leads to knowledge growth which stimulates the KE in turn (cf. Tchanyou, 2014ab). Zakic,
Jovanovic, and Stamatovic (2008) discuss nine external and internal factors that determine
9 industries compete with the help of product innovations comparing with mature industries
dominated by process innovations” (p. 26)3
Even though there is no one-on-one mapping of the business dynamics to the KE, or its
indicators, there are two studies relevant to this current effort. First, Andres, Asongu and
Amavilah (2014) estimated the impact on KE in African and MENA countries of formal
institutions through governance. They found that formal institutions are necessary, but not strong
enough, determinants of KE. Second, Amavilah, Asongu, and Andres (2014) extended the
previous study, by considering the effects on KE of globalization-related peace and stability
acting through governance. It turned out that governance affects KE differently depending on the
kind of globalization, the peace and stability it induces, and the type of governance through
which it influences the KE. In general the peace and stability induced by trade-related
globalization have stronger effects on governance, and hence on KE, than peace and stability
resulting from FDI-related stability associated with globalization represented as financial flows.
2.3 From KE to Economic Growth
The importance of the relationship between the KE and the general economy depends on the
intensity of the knowledge underlying the KE itself. At the early stages of progress KE acts like
technology and each general economy has some KE just as it has some knowledge. Think of an
x-dimensional plane with a tiny dot in it. As the economy grows, the dot (KE) also gets bigger
and bigger. How big KE is at any point in time depends on the relative difference between the
rates of growth of the KE and the general economy. If KE grows faster than the general
economy, then KE essentially becomes a factor of production that encompasses human capital
itself. In highly knowledge-intensive economies, KE and the general economy are the same
things. Thus, the special nature of the KE is that it can be both an input and an output.
Now, KE viewed as technology, changes in it would lead to changes in both production and
consumption possibilities, depending on whether they affect the demand or supply side.
Economists would recognize that sustained expansion of production possibilities is economic
3In the authors’ own words and order, the nine external and internal factors are: industry maturity; customer n
10 growth, and improvement in consumption possibilities is a sign of economic well-being, which
when sustained makes for inclusive development. We return to the preceding statement in the
next sub-section, and later.
If KE is taken to be a factor of production, that is an index of a kind of aggregate human capital,
then it would have institutional effects on other factors of production as well as on national
innovation systems. This is the perspective implicit in Andres, Asongu, and Amavilah’s (2014)
study on the impact of formal institutions on KE, which was recently extended by Amavilah,
Asongu, and Andres’s (2014) examination of the effects of globalization-induced peace and
stability on KE via governance. The literature which guided both papers above is relevant to this
one as well, and we strongly encourage the interested reader to go to that literature for further
elucidation. Suffice to say that the literature illustrates clearly the importance of the links
between the KE and the growth of the general economy. What we do in this paper is quantify
that link in a way that acknowledges the surrounding business context – and that, as far as we
know, has never been done for developing countries, and most certainly not for African
countries.
2.4 From Economic Growth to Economic Development
Economic growth improves production possibilities, but possibilities do not always mean equal
benefits. A number of UN reports are full of recent examples of growth that is accompanied by
inequality, poverty, or both. Indeed, inspired by Kuznets’s (1955, 1971) work, not long ago
many development economists accepted an inverted-U relationship between inequality and
growth as an unavoidable aspect of economic development. In the years 1990-2010 economic
growth coincided with both inequality and poverty in SSACs, although both Alwyn Young
(2012) and Maxim Pinkivskiy and Xavier Sala-i-Martin (2014) show that African countries on
average have done well in terms of consumption growth and poverty reduction. Over the same
time period OECD, MENA, and South Asian countries have seen inequality rise with some
growth, while Latin American and South East Asian countries with high growth and inequality in
the 1980-2000 time period, have experienced significant reductions in inequality along with slow
growth. Perhaps J. Bhagwati (1958) was correct after all that there is such a thing as
11
“equalizing slow or no growth”.
According to the UN, growth is inclusive if it (a) creates decent employment for all; (b) provides
opportunities to all social segments of the economy; (c) promotes equality of money and
non-money gains from growth; (d) improves human capital (education, skills, health, longevity
(life-expectancy), mobility) for at least the poorest; and (e) makes attainable social justice, individual
liberty, and other forms of freedom. Thus, inclusive growth contrasts with sustained growth
which is simply the shifting out rightwards of the production possibilities due to changes in the
technical capability of the economy resulting from technological change (productivity shift)
and/or changes in the quantity or quality of resources or improvements in efficiency (free
lunches). In fact, sustained growth plus inclusive growth is sustainable growth, which is the
objective dimension of sustainable development.
Kjoller-Hansen and Sperling (2013) quantify inclusive growth “by setting up five distinct criteria
for inclusive growth in relation to productive employment”, and they used household data to
evaluate the experiences of Albenia, Burkina Faso, Egypt, Romania, and Tajikistan. They found
that countries’ experiences differed given their “timespan, history, income level, culture, political
structure, religious orientation, etc.” (p. 10). For example, “more diversified economies at a
higher income level seem to perform better against the five criteria of inclusive growth” (p. 15) –
suggesting further that “… growth in GDP per capita is not enough for development to be
inclusive, [and that] more moderate growth rates, coupled with structural changes, can be as
inclusive as high growth rates without” (p. 15). This is consistent with our statements above.
Finally, Ianchovichina and Lundstrom’s (2009) framework and its application to Zambia are
both very well done and we rely on their paper to benchmark ours. Clearly growth is meaningful
only if it reduces poverty and inequality, and if it does so in a sustained and sustainable manner.
To be sustainable it has to be “broad-based.” To be sustained inclusive growth needs a viable
technology and be able to remove micro- and macro-economic constraints imposed by business
dynamics, and the conventional factors and forces of production. In the case of Zambia the
constraints included: (a) the employability of the poor themselves, (b) the cost of physical
12 (f) human capital, (g) government failures with respect to the macroeconomic environment and
taxation, (h) governance, and (i) pure market failures due to public goods/services, common
resources, externalities, and/or asymmetric information costs (uncertainty and risks).
Both Ianchovichina and Lundstrom, and Kjoller-Hansen and Spirling provide practical formulas
for characterizing income from employment of resources which individual persons or countries
need to meet the requirement, the Euler or Keynes-Ramsey, conditions for inclusiveness which
captures the welfare effects of inclusive growth.
We use innovate around the Ianchovichina and Lundstrom (2009) insight to argue that since
sustainable growth is sustained inclusive growth, it is a good enough proxy for inclusive
development. This means that we take Sen’s (1983, 1999) definition of development as the
capability that allows for freedom. In other words, the object of such development is national
well-being. Thus, the human development index (HDI) is a better measure of well-being
(standard of living) than per capita GDP (Sen, 1997, Anand and Sen, 1994). In addition, instead
of focusing on the HDI, we rely on the inequality-adjusted human development index (IHDI).
As described in various Human Development Reports (HDRs) the IHDI accounts for HDI Less
the “loss of human development due to inequality.” The larger the distance between the HDI and
the IHDI, the greater inequality, and the coefficient of human development inequality measure
the intensity of such inequality, i.e.,
or the
“loss in HDI due to inequality” (HDR, 2014, p. 4). Various HDRs reveal that SSACs have the
highest IHDI in health, South Asia and the Arab States have the highest IHDI in education, while
Latin American and the Caribbean have the highest IHDI in income. A more appropriate
measure to use, but for which data is currently incomplete for SSACs, would be the
poverty-adjusted HDI, technically called the “multidimensional poverty index” (MPI). Thus, we
understand that using IHDI is admission on our part that any statement we ultimately make about
poverty reduction or increase is an inference from the assumption that inequality and poverty are
13
3. Methodology
Our methodology has a number of stylized components. First, we describe the theoretical model
we assume. Second, we construct testable hypotheses that would allow us to implement our
model. Third, we outline key variables of interest, and corresponding data and data sources, and
subject the data to the principal component analysis to deal with the usual statistical problems.
Finally, we characterize our estimation technique and put it to work.
3.1Model
At the empirical level we solve the problem in parts for reasons discussed later. This section
summarizes the relationships described above concisely. We begin the description with an
assumption that all SSACs in our sample have two coexisting theoretical economies: the KE, ,
and the general economy, (cf. Lucas and Moll, 2013). depends on micro- and
macro-economic determinants among them our business dynamics which we designate as as well as
controls ( ), where all countries are identified and the variables are time-indexed, but for
simplicity country and time subscripts are ignored. Then
Normalizing (1) by dividing through with some specific we get
where the lowercase letters are logarithmic data and uppercase are raw data.
If we suppose that the link between ( ) and the general economy ( ) is either very weak
or non-existent, so that the latter depends only on its own factors ( ) and forces ( ), then it
would be determined as However, we know that every economy has its own
( ), that the difference across economies is of the size and sophistication of (Y1, y1), not its
existence. Hence, ( ) affects ( ) either as a productivity shifter (technological constant)
acting through , or as a factor of production and in that case it is an element of . There is a
lot and interesting things that can be done and said here, but for simplicity we let , such
14
To be able to associate with growth, we divide (3) by either population to get per capita
income (real GDP) or by labor to obtain per labor (worker) income (output). After taking the
natural logs, (3) becomes,
which represents the growth equation and its Euler or Keynes-Ramsey conditions discussed in
the papers we cite in the preceding section.
Eqs. (3) and (4) put us right in the middle of the neoclassical growth debate, whether in its Solow
(1956, 1957) and Swan (1956, 2002) exogenous version, or its new endogenous version
according to Lucas (1988, 1993), Rome (1990), Aghion and Howitt (1992), Mankiw, Romer, and
Weil (1992), Barro (1991), and many others. We welcome the debate, but resist the itch and
temptation to pursue that route for now. Instead, we restate that the principal goal of all
economic activities is to enhance human development in a sustainable way. We then accept
Sen’s modified capabilities model that inequality, by implication poverty, adjusted human
development index (IHDI) is a reasonable measure of the welfare effect of growth, that is, the
national well-being or national standard of living. For this reason, let , and note
that as described and calculated in the Human Development Reports, is determined by the (a)
longevity and health of the population, measured by life-expectancy at birth, (b) the knowledge
available to the economy, measured by education and training, and (c) a “decent standard of
living”, represented by per capita income. All three dimensions are adjusted by their respective
inequalities.
Put in a language familiar to growth economists, we designate the sum of the inequality adjusted
longevity and health, and knowledge as human capital, H, i.e., Then
per capita H,
, and one can show, at least theoretically, that
15 4
Taken together, it is clear that Equations 1 to 5 face the usual statistical culprits such as
heteroskedasticity and multicollinearity, which in turn would compromise the technical
efficiency of the estimates and thereby complicate their economic significance and relevance. To
alleviate those problems we apply the principal component analysis to the relationships to
minimize the risks posed by overparameterization and multiple correlations. First things, first.
3.2 Testable Hypotheses
We claim that in the first stage the dynamics of starting and doing business affect KE in African
countries. In the second stage we propose that as determined by business dynamics, KE is
important to economic growth in African countries. In other words, (i) growth from starting
business is related KE, and (ii) growth from doing business related KE. The third-stage of the
estimation process is the most critical one and it deals with the effect on inclusive development
of growth-ehancing KE from business dynamics.5 Consequently, the entire estimation process
reduces to the following fiver testable hypotheses:
Hypothesis 1: Education (Edutex) from starting and doing business is associated with growth
which influences the quality of development (IHDI).
Hypothesis 2:ICT from starting and doing business is associated with growth which influences
the quality of inclusive development (IHDI).
Hypothesis 3: Innovation (Innovx = STJA) from starting and doing business is associated with
growth which influences the quality of development (IHDI).
Hypothesis 4: Economic incentives (Creditex) from starting and doing business are associated
4
Prior to 2010 Human Development Reports estimated
parts of human capital, and
From 2010, components of the HDI were not longer equally weighted; they are computed as 3
3 2 1* *
HDI (see UNDP, HDR Technical Notes, 2014; Majerova, 2012), and adjusted the whole series.
16 with growth which influences the quality of development (IHDI).
Hypothesis 5:Institutional regime (Instireg) from starting and doing business is associated with
growth which influences the quality of development (IHDI).
3.3 Variables and Data and Principal Component (PCA)
In this part of the methodology we describe briefly key variables, their corresponding data and
data sources. As often is the case in developing countries, available data is both limited and
inaccurate. However, instead of filling in existing gaps with data from different sources, we
chose to use World Bank (WDI) data primarily. Such a choice comes with a trade-off between
consistency and small-size sample.
3.3.1 Variables and Data
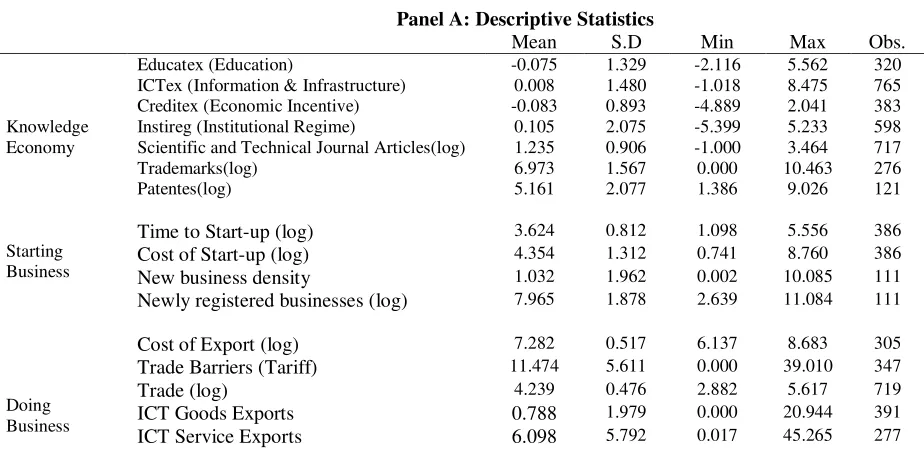
Table 1 characterizes the variables of particular interest to this study. Panel A displays the five
representations of KE. Panel B lists threeindicators of what we refer to throughout this paper as
‘business dynamics”, but our empirical focus is only on two – starting and doing business
dynamics.6 Our primary interest is in how these dynamics affect KE in the African countries
presented in Table 2, Panel B. Panel C of Table 1 outlines control and other variables. Most data
used in this study are standard; they do not need special treatment. They allow us to extend the
links the business dynamics and KE to economic growth and inclusive development. Last, but
equally important, Table 2, Panel A, presents descriptive statistics. The definitions of variables
are broadly consistent with Tchamyou (2014ab).
Table 1: Variables: signs, definitions, and data sources
Variables Signs Variable definitions Sources
Panel A: Dimensions in Knowledge Economy (KE)
A1: Education
Primary School Enrolment PSE School enrolment, primary (% of gross) World Bank (WDI) Secondary School Enrolment SSE School enrolment, secondary (% of gross) World Bank (WDI) Tertiary School Enrolment TSE School enrolment, tertiary (% of gross) World Bank (WDI)
Education in KE Educatex First PC of PSE, SSE & TSE PCA
6
17
A2: Information & Infrastructure
Internet Users Internet Internet users (per 100 people) World Bank (WDI) Mobile Cellular Subscriptions Mobile Mobile subscriptions (per 100 people) World Bank (WDI) Telephone lines Tel Telephone lines (per 100 people) World Bank (WDI)
Information & Communication Technology (ICT) in KE
ICTex First PC of Internet, Mobile & Tel PCA
A3: Economic Incentive & Institutional Regime
Financial Activity (Credit) Pcrbof Private domestic credit from banks and other financial institutions
World Bank (FDSD)
Interest Rate Spreads IRS Lending rate minus deposit rate (%) World Bank (WDI)
Economic Incentive in KE Creditex First PC of Pcrbof and IRS PCA
Corruption-Control CC “Control of Corruption (estimate): Captures perceptions of the extent to which public power is exercised for private gain, including both petty and grand forms
of corruption, as well as ‘capture’ of the
state by elites and private interests”.
World Bank (WDI)
Rule of Law RL “Rule of Law (estimate): Captures perceptions of the extent to which agents have confidence in and abide by the rules of society and in particular the quality of contract enforcement, property rights, the police, the courts, as well as the likelihood of crime and violence”.
World Bank (WDI)
Regulation Quality RQ “Regulation Quality (estimate): Measured as the ability of the government to formulate and implement sound policies and regulations that permit and promote private sector development”.
World Bank (WDI)
Political Stability/ No violence PS “Political Stability/ No Violence (estimate): Measured as the perceptions of the likelihood that the government will be destabilized or overthrown by unconstitutional and violent means, including domestic violence and terrorism”.
World Bank (WDI)
Government Effectiveness GE “Government Effectiveness (estimate): Measures the quality of public services, the quality and degree of independence from political pressures of the civil service, the quality of policy formulation and implementation, and the credibility of governments commitments to such policies”.
World Bank (WDI)
Voice & Accountability VA “Voice and Accountability (estimate):
Measures the extent to which a country’s
citizens are able to participate in selecting their government and to enjoy freedom of
18
expression, freedom of association, and a free media”.
Institutional Regime in KE Instireg First PC of CC, RL, RQ, PS, GE & VA PCA
A4: Innovation
Scientific & Technical Publications STJA Number of Scientific & Technical Journal Articles
World Bank (WDI)
Trademark Applications Trademark Total Trademark Applications World Bank (WDI) Patent Applications Patent Total Residents + Nonresident Patent
Applications
World Bank (WDI)
Innovation in KE Innovex First PC of Trademarks and Patents World Bank (WDI)
Panel B: Business Indicators
B1: Starting Business
Time to Start-up Timestart Log of Time required to start a business (days)
World Bank (WDI)
Cost of Start-up Coststart Log of Cost of business start-up procedures (% of GNI per capita)
World Bank (WDI)
New business density Newbisden New business density (new registrations per 1,000 people ages 15-64)
World Bank (WDI)
Newly registered businesses Newbisreg Log of New businesses registered (number)
World Bank (WDI)
B2: Doing Business
B2a: Trade
Cost of Export Costexp. Log of Cost to export (US$ per container) World Bank (WDI) Trade Barriers Tariff Tariff rate, applied, weighted mean, all
products (%)
World Bank (WDI)
Trade Openness Trade Export plus Import of Commodities (% of GDP)
World Bank (WDI)
B2b: Technology Exports
ICT Goods Exports ICTgoods: ICT goods exports (% of total goods exports)
World Bank (WDI)
ICT Service Exports ICTser ICT service exports (% of service exports, BoP)
World Bank (WDI)
High-Technology Exports Hightecexp High-technology exports (% of manufactured exports)
World Bank (WDI)
B2c: Property Rights
Contract Enforcement Contenfor Log of Time required to enforce a contract (days)
World Bank (WDI)
Registration of Property Regprop Log of Time required to register property (days)
World Bank (WDI)
Investor Protection Bisdiclos
Business extent of disclosure index (0=less disclosure to 10=more disclosure). It
19
protected through disclosure of ownership information
B3: Closing Business
Insolvency Resolution7
Insolv
Time to resolve insolvency (years). The number of years from the filling of insolvency in court until the resolution of
distressed assets. World Bank (WDI)
Panel C: Control & Other Variables
Inclusive Human Development IHDI Inequality Adjusted Human Development Index
World Bank (WDI)
Economic Prosperity GDPg GDP Growth Rate (annual %) World Bank (WDI) Foreign Aid NODA Net Official Development Assistance (%
of GDP)
World Bank (WDI)
Inflation Infl. Consumer Price Index (annual %) World Bank (WDI) Foreign Investment FDI Gross Foreign Direct Investment (% of
GDP)
World Bank (WDI)
Public Investment Pub Ivt. Gross Public Investment (% of GDP) World Bank (WDI) Private Investment Priv. Ivt. Gross Private Investment (% of GDP) World Bank (WDI)
[image:20.612.69.531.452.689.2]WDI: World Bank Development Indicators. GNI: Gross National Income. BoP: Balance of Payment. GDP: Gross Domestic Product. PC: Principal Component. PCA: Principal Component Analysis. Log: logarithm. Educatex is the first principal component of primary, secondary and tertiary school enrolments. ICTex: first principal component of mobile, telephone and internet subscriptions. Creditex: First PC of Private domestic credit and interest rate spread. P.C: Principal Component. VA: Voice & Accountability. RL: Rule of Law. R.Q: Regulation Quality. GE: Government Effectiveness. PS: Political Stability. CC: Control of Corruption. Instireg (Institutional regime): First PC of VA, PS, RQ, GE, RL & CC.
Table 2: Summary statistics and presentation of countries
Panel A: Descriptive Statistics
Mean S.D Min Max Obs.
Knowledge Economy
Educatex (Education) -0.075 1.329 -2.116 5.562 320 ICTex (Information & Infrastructure) 0.008 1.480 -1.018 8.475 765 Creditex (Economic Incentive) -0.083 0.893 -4.889 2.041 383 Instireg (Institutional Regime) 0.105 2.075 -5.399 5.233 598 Scientific and Technical Journal Articles(log) 1.235 0.906 -1.000 3.464 717 Trademarks(log) 6.973 1.567 0.000 10.463 276 Patentes(log) 5.161 2.077 1.386 9.026 121
Starting Business
Time to Start-up (log) 3.624 0.812 1.098 5.556 386
Cost of Start-up (log) 4.354 1.312 0.741 8.760 386
New business density 1.032 1.962 0.002 10.085 111
Newly registered businesses (log) 7.965 1.878 2.639 11.084 111
Doing Business
Cost of Export (log) 7.282 0.517 6.137 8.683 305
Trade Barriers (Tariff) 11.474 5.611 0.000 39.010 347
Trade (log) 4.239 0.476 2.882 5.617 719
ICT Goods Exports 0.788 1.979 0.000 20.944 391
ICT Service Exports 6.098 5.792 0.017 45.265 277
7
20
High-Technology Exports 4.640 7.192 0.000 83.640 455
Contract Enforcement (log) 6.434 0.383 5.438 7.447 383
Registration of Property (log) 4.175 0.756 2.197 5.983 346
Investor Protection: Disclosure 4.774 1.976 0.000 8.000 293
Control & Other variables
Growth 4.763 7.293 -31.300 106.28 759 Inclusive Human Development 1.351 6.341 0.127 47.486 551 Net Official Development Assistance(NODA) 10.811 12.774 -0.251 148.30 704 Inflation 57.556 955.55 -100.00 24411 673 Trade 77.853 39.698 17.859 275.23 719 Private Investment 12.979 9.400 -2.437 112.35 658 Public Investment 7.449 4.500 0.000 39.984 655 Foreign Direct Investment 4.221 8.451 -8.629 145.20 557
Panel B: Presentation of Countries (53)
Algeria, Angola, Benin, Botswana, Burkina Faso, Burundi, Cameroon, Cape Verde, Chad, Central African
Republic, Comoros, Congo Democratic Republic, Congo Republic, Côte d’Ivoire, Djibouti, Egypt, Equatorial
Guinea, Eritrea, Ethiopia, Gabon, The Gambia, Ghana, Guinea, Guinea-Bissau, Kenya, Lesotho, Liberia, Libya, Madagascar, Malawi, Mali, Mauritania, Mauritius, Morocco, Mozambique, Namibia, Niger, Nigeria, Senegal, Sierra Leone, Somalia, Sudan, Rwanda, Sao Tomé & Principe, Seychelles, South Africa, Swaziland, Tanzania, Togo, Tunisia, Uganda, Zambia, Zimbabwe.
S.D: Standard Deviation. Min: Minimum. Max: Maximum. Obs: Observations.
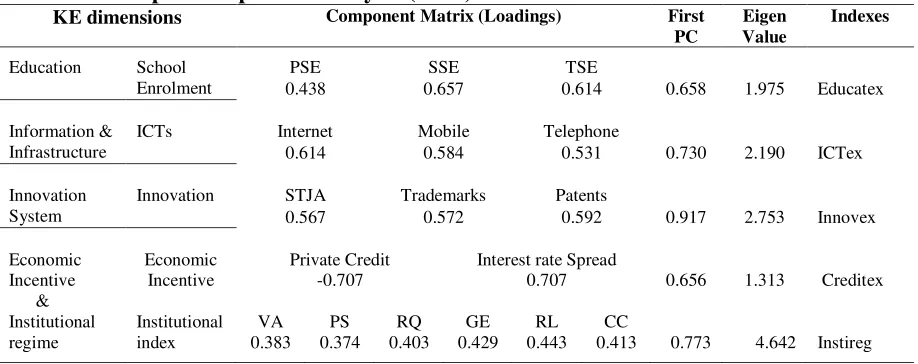
3.3.2 KE Indicators and Principal Component Analysis (PCA)
Even without formal diagnostics, it is clear from Table 1 that there are bound to be significant
correlations among the indicators of KE, and between KE indications and business dynamics.
Since Jolliffe’s (1986) seminal work, research has shown that the PCA can be utilized to reduce
highly correlated variables into a smaller set of uncorrelated indicators called principal
components (PCs) that retain a substantial portion of information in the initial dataset, see, e.g.,
Kaiser (1974; Fomby, Hill, and Johnson, 1984; Jolliffe, 2002). The research recommends the
retention of PCs with an eigenvalue that is greater than the mean, or greater than one. In the
present case eigenvalues range from 1.31 for the Economic Incentive (Creditex) variable to as
high as 4.64 for the Institutional Regime (Instireg) variable. We use logSTJA to proxy for
Innovation (Innovex = logSTJA) because of limited degrees of freedom in the other components.8
Again, the importance of eigenvalues is that they denote eigenvectors that have a significant
proportion of the initial information or total variability. As Table 3 reveals the first PCs for
education (Educatex), information and communication technology (ICTex), Innovex,Creditex,
and Instireg correspond consistently to eigenvalues that are greater than one – meaning the
8
21 vectors retain between 66% and 77% of overall information.
Table 3: Principal Component Analysis (PCA) for KE Indicators
KE dimensions Component Matrix (Loadings) First
PC
Eigen Value
Indexes
Education School Enrolment
PSE SSE TSE
0.438 0.657 0.614 0.658 1.975 Educatex
Information & Infrastructure
ICTs Internet Mobile Telephone
0.614 0.584 0.531 0.730 2.190 ICTex
Innovation System
Innovation STJA Trademarks Patents
0.567 0.572 0.592 0.917 2.753 Innovex
Economic Incentive & Institutional regime Economic Incentive
Private Credit Interest rate Spread
-0.707 0.707 0.656 1.313 Creditex
Institutional index
VA PS RQ GE RL CC
0.383 0.374 0.403 0.429 0.443 0.413 0.773 4.642 Instireg
“P.C: Principal Component. PSE: Primary School Enrolment. SSE: Secondary School Enrolment. TSE: Tertiary School Enrolment. PC: Principal Component. ICTs: Information and Communication Technologies. Educatex is the first principal component of primary, secondary and tertiary school enrolments. ICTex: first principal component of mobile, telephone and internet subscriptions. STJA: Scientific and Technical Journal Articles. Innovex: first principal component of STJA, trademarks and patents (resident plus nonresident). VA: Voice & Accountability. RL: Rule of Law. R.Q: Regulation Quality. GE: Government Effectiveness. PS: Political Stability. CC: Control of Corruption. Instireg (Institutional regime): First PC of VA, PS, RQ, GE, RL & CC. Creditex: first principal component of private domestic credit and interest rate spread”.
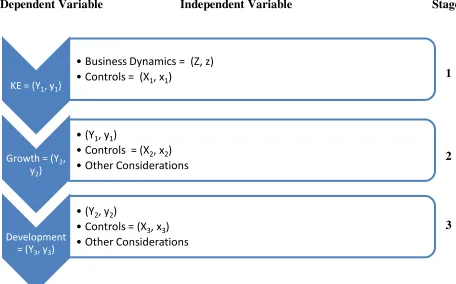
3.4 Estimation Technique
We estimate the model in three stages we describe next below.
Stage 1: KE in Africa, designated by (Y1, y1) depends on the dynamics of starting business
(Table 1, Panel A), dynamics of doing business (Table 1, Panel B); globalization, governance,
controls, and some random error.9 This first-stage builds upon Tchamyou’s (2014b) notion of
‘the effect of entrepreneurship on KE’. It includes two sets of equations: KE from starting
business, and KE from “doing business” (actually operating business). It is essentially Equations
1 and 2. Hence,
Stage 2: Economic growth (Y2, y2) is a function of KE estimated in Stage 1, controls and other
relevant variables, and random chances. This stage entails two sets of equations: Growth related
to KE from starting business, and Growth emanating from doing business. This stage is anchored
in Equations 3 and 4, implying
9
22
Stage 3: Inclusive development measured as inequality adjusted HDI = (Y3, y3) is related to
estimated growth from Stage 2 in addition to other variables and controls. This stage involves
two sets of equations also, i.e., inclusive development that is influenced by the KE from starting
business, and inclusive development from growth associated with KE from doing business. The
[image:23.612.72.528.262.546.2]theoretical basis of this stage is Equation 5 for which
Figure 1 summarizes the essential parts of the approach utilized.
Dependent Variable Independent Variable Stage
1
2
3
Figure 1 - Business Dynamics, Growth, and Inclusive Development in African countries.
The figure suggests the following reduced form estimation specifications:
(6)
,
Where is estimated y from the preceding stage, and are error terms of an unknown structure a
KE = (Y1, y1)
•Business Dynamics = (Z, z)
•Controls = (X1, x1)
Growth = (Y2, y2)
•(Y1, y1)
•Controls = (X2, x2)
•Other Considerations
Development = (Y3, y3)
•(Y2, y2)
•Controls = (X3, x3)
23 priori, but assumed to be random. Thus, in (6)
as opposed to the alternatives.
4. Results
Tables 4-8 present estimation results by stage, and it is to those we turn next.
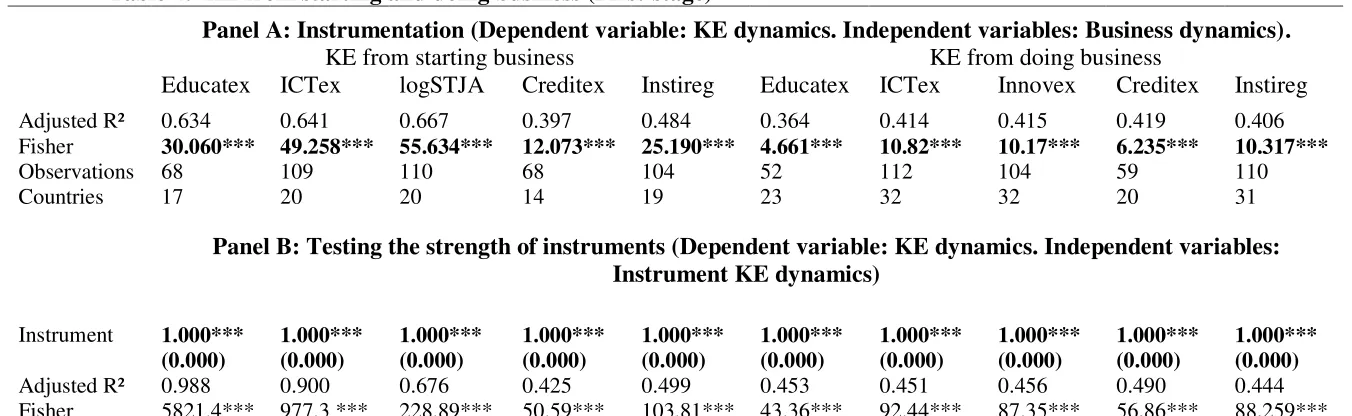
4.1First-stage KE-Business dynamics Nexus
Table 4A reveals that overall the dynamics of starting business explains 40% to 67% of all
variations in KE. However, the dynamics of starting business in these countries differ across KE
dimensions, being lowest for the Creditex variable, and highest for the logSTJA = Innovex
variable. Moreover, the dynamics of doing (operating) business explains 36% to 42% of changes
in KE (the five KE indicators). Among these, doing business dynamics explain the Educatex
dimension of KE the least.
How strong are the instruments for starting and doing business as determinants of KE? The
answer is in Table 4B, and it differs across the KE dimensions and the dynamics of starting and
doing business themselves. The results show that starting business explains between 43% and
99% of the variations in KE. On average doing business is responsible for only about 46% of
variations in KE dimensions. Respectively, starting business dynamics are first, second, and third
strongest explainers of Educatex, ICTex, and logSTJA indicators of KE, and weakest for
Creditex. By contrast, the strengths of doing business on KE indicators are nearly uniform at
24
Table 4: KE from starting and doing business (First-stage)
Panel A: Instrumentation (Dependent variable: KE dynamics. Independent variables: Business dynamics).
KE from starting business KE from doing business
Educatex ICTex logSTJA Creditex Instireg Educatex ICTex Innovex Creditex Instireg
Adjusted R² 0.634 0.641 0.667 0.397 0.484 0.364 0.414 0.415 0.419 0.406
Fisher 30.060*** 49.258*** 55.634*** 12.073*** 25.190*** 4.661*** 10.82*** 10.17*** 6.235*** 10.317***
Observations 68 109 110 68 104 52 112 104 59 110
Countries 17 20 20 14 19 23 32 32 20 31
Panel B: Testing the strength of instruments (Dependent variable: KE dynamics. Independent variables: Instrument KE dynamics)
Instrument 1.000*** 1.000*** 1.000*** 1.000*** 1.000*** 1.000*** 1.000*** 1.000*** 1.000*** 1.000***
(0.000) (0.000) (0.000) (0.000) (0.000) (0.000) (0.000) (0.000) (0.000) (0.000)
Adjusted R² 0.988 0.900 0.676 0.425 0.499 0.453 0.451 0.456 0.490 0.444
Fisher 5821.4*** 977.3 *** 228.89*** 50.59*** 103.81*** 43.36*** 92.44*** 87.35*** 56,86*** 88,259***
Observations 68 109 110 68 104 52 112 104 59 110
Countries 17 20 20 14 19 23 32 32 20 31
25
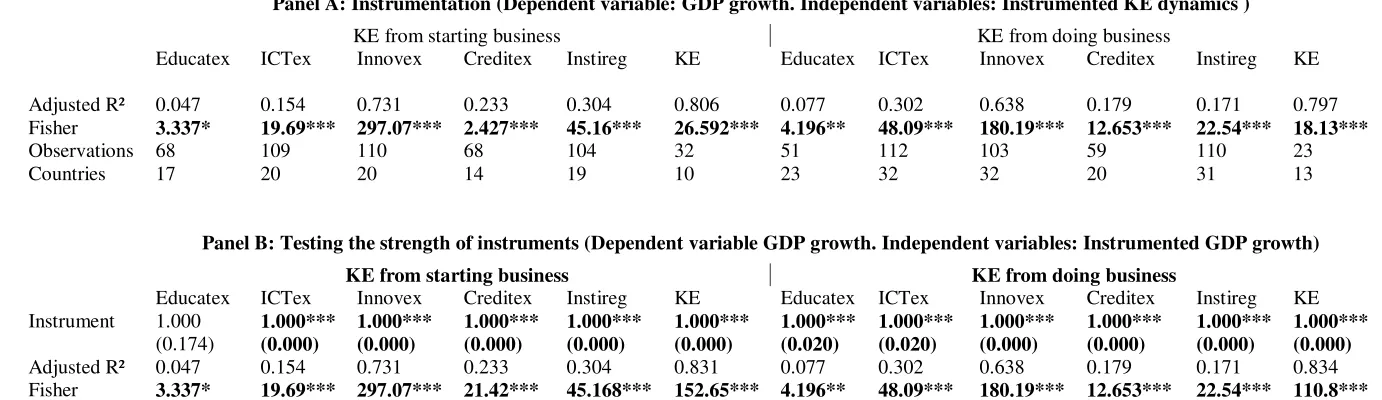
4.2 Second-stage Growth-KE Nexus
Table 5 reports the results of the estimation (Panel A) and the testing of the strength (Panel B)
results of KE as determined by the dynamics of starting and doing business, and how these relate
to economic growth. Average KE from starting business and average KE from doing business
account for 81% and 80% of all fluctuations in economic growth, respectively. In this case,
however, specific KE from starting and doing business are high only for the Innovex = logSTJA
dimension of KE. For others adjusted R-squares and Fisher statistics are low. Although the
explanatory power of the regressions are low, we know for certain that the results do not mean
that there is no relationship; there is one because average KE is responsible for up to 83% of
variations in economic growth. We offer plausible explanation in the section on the concluding
implications of the study.
Table 6 shows the correlations among control and other variables and KE from starting business
(Panel A) and doing business (Panel B), while Table 7 displays descriptive statistics. An
important note from these matrices is that there are considerable positive and negative
correlations between starting business dynamics and control variables (Panel A). High
correlations between doing business dynamics and control variables are few (Panel B). We
26
Table 5: Growth related to KE from starting and doing business (Second-stage)
Panel A: Instrumentation (Dependent variable: GDP growth. Independent variables: Instrumented KE dynamics )
KE from starting business KE from doing business
Educatex ICTex Innovex Creditex Instireg KE Educatex ICTex Innovex Creditex Instireg KE Adjusted R² 0.047 0.154 0.731 0.233 0.304 0.806 0.077 0.302 0.638 0.179 0.171 0.797 Fisher 3.337* 19.69*** 297.07*** 2.427*** 45.16*** 26.592*** 4.196** 48.09*** 180.19*** 12.653*** 22.54*** 18.13***
Observations 68 109 110 68 104 32 51 112 103 59 110 23 Countries 17 20 20 14 19 10 23 32 32 20 31 13
Panel B: Testing the strength of instruments (Dependent variable GDP growth. Independent variables: Instrumented GDP growth)
KE from starting business KE from doing business
Educatex ICTex Innovex Creditex Instireg KE Educatex ICTex Innovex Creditex Instireg KE Instrument 1.000 1.000*** 1.000*** 1.000*** 1.000*** 1.000*** 1.000*** 1.000*** 1.000*** 1.000*** 1.000*** 1.000***
(0.174) (0.000) (0.000) (0.000) (0.000) (0.000) (0.020) (0.020) (0.000) (0.000) (0.000) (0.000)
Adjusted R² 0.047 0.154 0.731 0.233 0.304 0.831 0.077 0.302 0.638 0.179 0.171 0.834 Fisher 3.337* 19.69*** 297.07*** 21.42*** 45.168*** 152.65*** 4.196** 48.09*** 180.19*** 12.653*** 22.54*** 110.8***
Observations 68 109 110 68 104 32 51 112 103 59 110 23 Countries 17 20 20 14 19 10 23 32 32 20 31 13
27
Table 6: Correlation matrix of Growth related to KE from business dynamics Panel A: Growth related to KE from Starting Business
Control Variables Starting Business IHDI
NODA Inflation FDI Priv Invt. Pub. Invt IVGrEduSB IVGrICTSB IVGrSTJASB IVGrCredSB IVGrInstSB IVGrKESB
1.000 -0.004 0.165 -0.222 0.195 -0.749 -0.633 -0.457 0.835 -0.612 0.852 -0.072 NODA
1.000 0.011 -0.042 -0.072 -0.017 -0.046 0.105 0.290 -0.049 0.226 -0.009 Inflation
1.000 0.635 0.074 0.183 0.074 0.154 0.164 0.060 0.294 -0.042 FDI
1.000 -0.037 0.443 0.350 0.132 -0.302 0.336 -0.453 0.025 Priv. Invt.
1.000 -0.125 -0.162 0.041 0.263 -0.198 0.190 -0.151 Pub. Invt.
1.000 0.913 0.583 -0.972 0.859 -0.930 0.880 IVGrEduSB
1.000 0.331 -0.801 0.986 -0.703 0.784 IVGrICTSB
1.000 -0.447 0.228 -0.168 0.400 IVGrSTJASB
1.000 -0.735 0.864 -0.721 IVGrCredSB
1.000 -0.622 0.757 IVGrInstSB
1.000 -0.743 IVGrKESB
1.000 IHDI
Panel A: Growth related to KE from Doing Business
Control Variables Doing Business IHDI
NODA Inflation FDI Priv Invt. Pub. Invt IVGrEduDB IVGrICTDB IVGrSTJADB IVGrCredDB IVGrInstDB IVGrKEDB
1.000 -0.004 0.165 -0.222 0.195 -0.525 -0.450 -0.218 -0.340 -0.485 0.608 -0.072 NODA
1.000 0.011 -0.042 -0.072 -0.089 -0.208 0.042 -0.124 -0.006 0.325 -0.009 Inflation
1.000 0.635 0.074 0.146 0.399 -0.260 -0.106 0.100 -0.166 -0.042 FDI
1.000 -0.037 0.329 0.421 0.073 0.180 0.266 -0.086 0.025 Priv. Invt.
1.000 -0.301 -0.174 0.024 -0.105 -0.108 0.230 -0.151 Pub. Invt.
1.000 0.0737 0.143 0.545 0.817 -0.651 0.778 IVGrEduDB
1.000 0.086 0.506 0.764 -0.694 0.600 IVGrICTDB
1.000 0.596 0.409 0.146 0.286 IVGrSTJADB
1.000 0.780 -0.327 0.536 IVGrCredDB
1.000 -0.736 0.637 IVGrInstDB
1.000 -0.652 IVGrKEDB
28
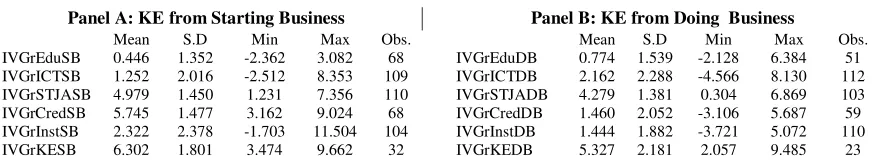
Table 7: Descriptive statistics of instrumented variables (Growth related to KE from business dynamics)
Panel A: KE from Starting Business Panel B: KE from Doing Business
Mean S.D Min Max Obs. Mean S.D Min Max Obs. IVGrEduSB 0.446 1.352 -2.362 3.082 68 IVGrEduDB 0.774 1.539 -2.128 6.384 51 IVGrICTSB 1.252 2.016 -2.512 8.353 109 IVGrICTDB 2.162 2.288 -4.566 8.130 112 IVGrSTJASB 4.979 1.450 1.231 7.356 110 IVGrSTJADB 4.279 1.381 0.304 6.869 103 IVGrCredSB 5.745 1.477 3.162 9.024 68 IVGrCredDB 1.460 2.052 -3.106 5.687 59 IVGrInstSB 2.322 2.378 -1.703 11.504 104 IVGrInstDB 1.444 1.882 -3.721 5.072 110 IVGrKESB 6.302 1.801 3.474 9.662 32 IVGrKEDB 5.327 2.181 2.057 9.485 23 IVGrEduSB: Growth related to Education from Starting Business. IVGrICTSB: Growth related to ICT from Starting Business.
IVGrSJTASB: Growth related to STJA from Starting Business. IVGrCredSB: Growth related to Economic Incentives from Starting Business. IVGrInstSB: Growth related to Institutional regime from Starting Business. IVGrKESB: Growth related to KE from Starting Business. IVGrEduDB: Growth related to Education from Doing Business. IVGrICTDB: Growth related to ICT from Doing Business. IVGrSJTADB: Growth related to STJA from Doing Business. IVGrCredDB: Growth related to Economic Incentives from Doing Business. IVGrInstDB: Growth related to Institutional regime from Doing Business. IVGrKEDB: Growth related to KE from Doing Business. S.D: Standard Deviation. Min: Minimum. Max: Maximum. Obs: Observations.
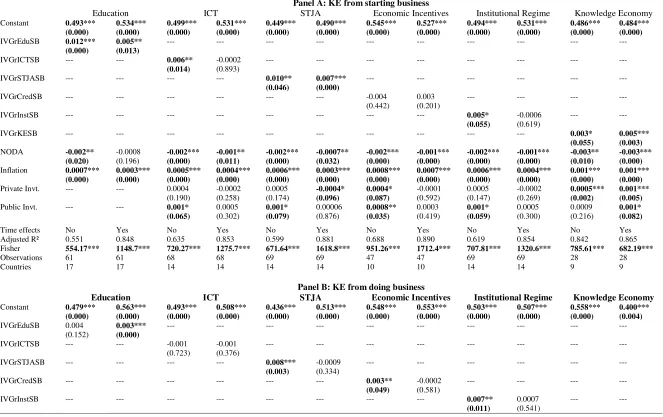
4.3Third-stage: Development-Growth Nexus -- Panel Fixed Effects regression
The results from the third-stage estimation are in Table 8. They associate economic growth as
determined by KE with inclusive development measured by the IHDI. The effects on IHDI of
growth based on KE from starting business without and with time effects (Panel A) are positive,
except in the cases of ICTex, Creditex, and Instireg, which are negative when time effects are
included, albeit not significant. The included variables explain up to 70% of variations when
time effects are not considered and up to 89% when time effects are considered. Comparatively
such effects are more important than the effects of foreign aid (NODA) which are negative
across the board. They also compare favorably to the effects of private investment. More on this
later.
In Panel B of Table 8 the effects on inclusive development of growth associated with KE from
doing business without and with time effects are less impressive, and in fact negative for ICT
without and with time effects, negative for Creditex and Innovex = STJA, and average KE with
time effects. Excluding time effects, growth that is influenced by KE from doing business
explains 26% - 96%. In summary, without the time effects a one percent increase in growth
enhanced by KE from starting business improves inclusive development by 1.3%, and only by
half a percent when the time effects are included. Inclusive development increases by 1.1% for
every one percent increase in growth related to KE from doing business.
[image:29.612.71.517.101.184.2]29 African literature on inclusive growth, low and stable inflation is pro-poor. His results are
consistent with the findings of Albanesi (2007) on the disequalizing income-distribution effect of
high inflation on the one hand and the results of Bulir (1998) and Lopez (2004) on the equalizing
income distribution effect of low inflation, on the other hand10. The negative effect of foreign
direct investment on inclusive development is consistent with a recent study on quality of growth
in developing countries (Mlachila et al., 2014) or IHDI in African countries (Asongu, 2014a).
The positive effect of investment (public and private) on IHDI is consistent with intuition and the
predictions of economic theory. Interestingly, moreover, also public investment appear to exert a
stronger effect on inclusive development than private investment.
10
30
Table 8: Inclusive development from Growth related to KE from starting and doing business (Third stage): Dependent variable: Inequality adjusted Human Development Index (IHDI)
Panel A: KE from starting business
Education ICT STJA Economic Incentives Institutional Regime Knowledge Economy
Constant 0.493*** 0.534*** 0.499*** 0.531*** 0.449*** 0.490*** 0.545*** 0.527*** 0.494*** 0.531*** 0.486*** 0.484*** (0.000) (0.000) (0.000) (0.000) (0.000) (0.000) (0.000) (0.000) (0.000) (0.000) (0.000) (0.000)
IVGrEduSB 0.012*** 0.005** --- --- --- --- --- --- --- --- --- ---
(0.000) (0.013)
IVGrICTSB --- --- 0.006** -0.0002 --- --- --- --- --- --- --- ---
(0.014) (0.893)
IVGrSTJASB --- --- --- --- 0.010** 0.007*** --- --- --- --- --- ---
(0.046) (0.000)
IVGrCredSB --- --- --- --- --- --- -0.004 0.003 --- --- --- --- (0.442) (0.201)
IVGrInstSB --- --- --- --- --- --- --- --- 0.005* -0.0006 --- ---
(0.055) (0.619)
IVGrKESB --- --- --- --- --- --- --- --- --- --- 0.003* 0.005***
(0.055) (0.003)
NODA -0.002** -0.0008 -0.002*** -0.001** -0.002*** -0.0007** -0.002*** -0.001*** -0.002*** -0.001*** -0.003** -0.003*** (0.020) (0.196) (0.000) (0.011) (0.000) (0.032) (0.000) (0.000) (0.000) (0.000) (0.010) (0.000)
Inflation 0.0007*** 0.0003*** 0.0005*** 0.0004*** 0.0006*** 0.0003*** 0.0008*** 0.0007*** 0.0006*** 0.0004*** 0.001*** 0.001*** (0.000) (0.000) (0.000) (0.000) (0.000) (0.000) (0.000) (0.000) (0.000) (0.000) (0.000) (0.000)
Private Invt. --- --- 0.0004 -0.0002 0.0005 -0.0004* 0.0004* -0.0001 0.0005 -0.0002 0.0005*** 0.001***
(0.190) (0.258) (0.174) (0.096) (0.087) (0.592) (0.147) (0.269) (0.002) (0.005)
Public Invt. --- --- 0.001* 0.0005 0.001* 0.00006 0.0008** 0.0003 0.001* 0.0005 0.0009 0.001* (0.065) (0.302) (0.079) (0.876) (0.035) (0.419) (0.059) (0.300) (0.216) (0.082)
Time effects No Yes No Yes No Yes No Yes No Yes No Yes
Adjusted R² 0.551 0.848 0.635 0.853 0.599 0.881 0.688 0.890 0.619 0.854 0.842 0.865 Fisher 554.17*** 1148.7*** 720.27*** 1275.7*** 671.64*** 1618.8*** 951.26*** 1712.4*** 707.81*** 1320.6*** 785.61*** 682.19***
Observations 61 61 68 68 69 69 47 47 69 69 28 28
Countries 17 17 14 14 14 14 10 10 14 14 9 9
Panel B: KE from doing business
Education ICT STJA Economic Incentives Institutional Regime Knowledge Economy
Constant 0.479*** 0.563*** 0.493*** 0.508*** 0.436*** 0.513*** 0.548*** 0.553*** 0.503*** 0.507*** 0.558*** 0.400*** (0.000) (0.000) (0.000) (0.000) (0.000) (0.000) (0.000) (0.000) (0.000) (0.000) (0.000) (0.004)
IVGrEduSB 0.004 0.003*** --- --- --- --- --- --- --- --- --- --- (0.152) (0.000)
IVGrICTSB --- --- -0.001 -0.001 --- --- --- --- --- --- --- --- (0.723) (0.376)
IVGrSTJASB --- --- --- --- 0.008*** -0.0009 --- --- --- --- --- ---
(0.003) (0.334)
IVGrCredSB --- --- --- --- --- --- 0.003** -0.0002 --- --- --- ---
(0.049) (0.581)
IVGrInstSB --- --- --- --- --- --- --- --- 0.007** 0.0007 --- ---