ISSN Online: 2331-4249 ISSN Print: 2331-4222
DOI: 10.4236/wjet.2017.53B015 Aug. 25, 2017 135 World Journal of Engineering and Technology
Effects of Impact Loads on Mechanical
Performance for Truss Structure
Zongwei Zheng, Yin Bai
School of Transportation Science and Engineering, Beihang University, Beijing, China
Abstract
In this paper, ANSYS/LS-DYNA dynamic analysis software was used to estab-lish finite element truss models with six trusses. The models with impact loads aimed to simulate the scenarios that structures were crashed by heavy truck. By changing the crashed position, the impact load intensity and structure height-span ratio, the models could give out the structural performance, in-cluding the stress, strain and other impacts in different scenarios. Besides, considering the component failure, this paper analyzed the possibility of structural progressive collapse. Results for the load cases from below indicate that it will be more destructive if impact load is arranged on 3rd side pillar and progressive collapse will occur if pillar fails after crashed.
Keywords
Truss Structure, Impact Loads, Progressive Collapse, Height-Span Ratio
1. Introduction
Truss structure, which is one of the most widely used architectural structures, is generally used in gymnasiums, museums, theaters and terminals, and other public buildings [1]. Numbers of links in truss structure result in complex distributions of natural vibration, which increase the difficulty of analyzing [2]. With the increas-ing number of automobiles, the possibility of vehicle impact rises [3]. Xincreas-ingguo Wang and Youpo Su studied the performance of reinforced concrete frame under impact [4]. Yan Xiao and Lin Chen did some researches on truss protection effect under the vehicle impact [5]. Hui Qu and Jingsi Huo verified the truss perfor-mance discipline by experiments on dynamic plastic loading of frames [6]. Hyun-goo Kang and Jinkoo Kim analyzed the possibility of progressive collapse of steel moment frames subjected to vehicle impact [7]. Currently, most of the researches
How to cite this paper: Zheng, Z.W. and Bai, Y. (2017) Effects of Impact Loads on Mechanical Performance for Truss Struc-ture. World Journal of Engineering and Technology, 5, 135-140.
https://doi.org/10.4236/wjet.2017.53B015
DOI: 10.4236/wjet.2017.53B015 136 World Journal of Engineering and Technology about vehicle impact mainly focus on bridges. Researches about the performance of truss under impact are limited but meaningful. This paper analyzed the effect of impact loads on mechanical performance for truss structure by finite element truss models built with ANSYS/LS-DYNA dynamic analysis software.
2. Truss Structure Model
The models were established by ANSYS/LS-DYNA dynamic analysis software. The parameter of model is shown in following Table 1, Table 2 and Figure 1.
3. Loads Position Effects Exploration
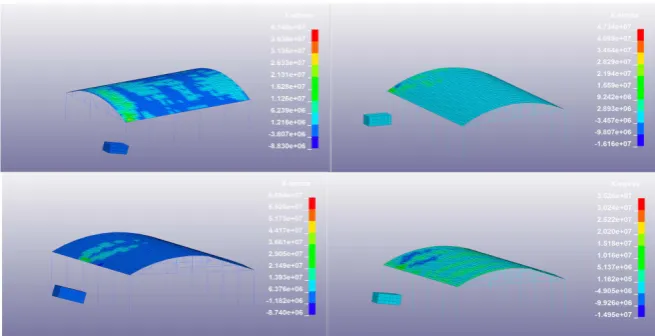
Assuming the truck density is 148 kg/m3 (weight is 8 t), then the impact load in-tensity is 8 × 10⁴ kg∙m/s (8 t × 10 m/s). Considering the symmetry of the struc-ture, Table 3 and Figure 2 show the performance of structure under impact loads on four positons.
The results indicate that loads on the 3rd side pillar will result in maximum stress in the structure, which is most destructive.
4. Bearable Maximum Impact Load Exploration
[image:2.595.206.540.425.504.2]Through assuming different density of impactors and constant size and velocity, different impact loads could be arranged on truss. Table 4 shows the performance of structure under different intensity of impact loads and Figure 3 shows the
Table 1. Parameters of basic truss model.
Element Truss Structure Truck
Unit Link160 Beam161 Shell163 Solid164
Size diameter: 0.048 m span: 28 m truss number: 6
Inner diameter: 0.20 m outer diameter: 0.14 m
height: 9 m
thickness: 0.03 m
[image:2.595.205.540.536.700.2]length: 6 m width: 3 m height: 2.5 m velocity: 10 m/s
Table 2. Parameters of structural material.
Density EX Failure strain Yield stress NUXY Tangent module 7850 kg/m3 2.06 × 10¹¹ 5% 3.45 × 10⁸ Pa 0.3 6.1 × 10⁹
DOI: 10.4236/wjet.2017.53B015 137 World Journal of Engineering and Technology performance of truss under No. 7 load.
Table 4 and Figure 3 indicate that the bearable maximum impact load inten-sity truss is about 1.8 × 10⁵ kg∙m/s (18 t × 10 m/s). With 2 × 10⁵ kg∙m/s (20 t × 10 m/s) loads, the maximum stress in structure will be yield stress (3.45 × 10⁸ Pa) and the relative deformation in some components will exceed 5%, which could result in structure failure.
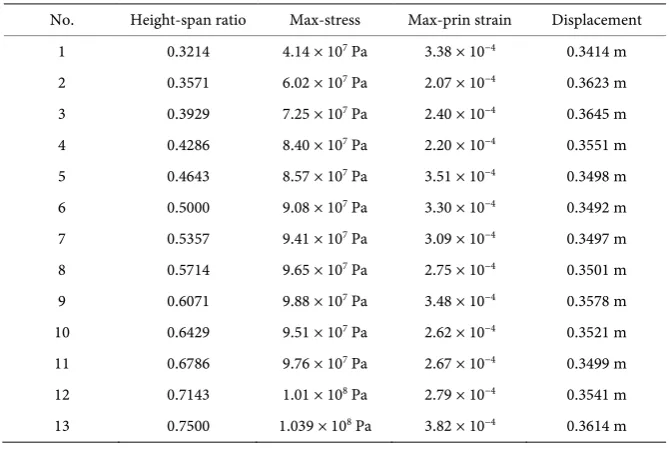
5. Height-Span Ratio Effects Exploration
[image:3.595.209.537.249.417.2]8 × 10⁴ kg∙m/s (8 t × 10 m/s) impact load was arranged on 3rd side pillar in struc-tures with different height-span ratio, and structural performances show in Table 5. The relationship between stress and height/span ratio is displayed in Figure 4.
[image:3.595.204.541.470.556.2]Figure 2. Structure performance plots under impact load on different positions.
Table 3. Different load positions analysis.
No. Load position Max-stress Max-prin strain Displacement 1 Front-1st 4.14 × 10⁷ Pa 3.38 × 10⁻⁴ 0.3414 m
2 Side-1st 4.73 × 10⁷ Pa 3.22 × 10⁻⁴ 0.3302 m
3 Side-2nd 5.15 × 10⁷ Pa 3.05 × 10⁻⁴ 0.3267 m
[image:3.595.193.539.588.734.2]4 Side-3rd 6.68 × 10⁷ Pa 2.50 × 10⁻⁴ 0.3258 m
Table 4. Impact loads intensity analysis.
No. Load Intensity Max Stress Max-prin Strain Displacement Notes 1 8 t × 10 m/s 4.14 × 10⁷ Pa 3.38 × 10⁻⁴ 0.3414 m
2 10 t × 10 m/s 5.73 × 10⁷ Pa 3.92 × 10⁻⁴ 0.3302 m
3 12 t × 10 m/s 7.14 × 10⁷ Pa 4.45 × 10⁻⁴ 0.3267 m
4 14 t × 10 m/s 8.67 × 10⁷ Pa 5.51 × 10⁻⁴ 0.3258 m
5 16 t × 10 m/s 1.043 × 10⁸ Pa 6.77 × 10⁻⁴ 0.5914 m
6 18 t × 10 m/s 1.246 × 10⁸ Pa 8.08 × 10⁻⁴ 0.6511 m
DOI: 10.4236/wjet.2017.53B015 138 World Journal of Engineering and Technology Figure 3. Structure performance plots under No. 7 load.
Figure 4. Plot of stress and height/span ratio.
Table 5. Height-span ratio impact analysis.
No. Height-span ratio Max-stress Max-prin strain Displacement 1 0.3214 4.14 × 10⁷ Pa 3.38 × 10⁻⁴ 0.3414 m
2 0.3571 6.02 × 10⁷ Pa 2.07 × 10⁻⁴ 0.3623 m
3 0.3929 7.25 × 10⁷ Pa 2.40 × 10⁻⁴ 0.3645 m
4 0.4286 8.40 × 10⁷ Pa 2.20 × 10⁻⁴ 0.3551 m
5 0.4643 8.57 × 10⁷ Pa 3.51 × 10⁻⁴ 0.3498 m
6 0.5000 9.08 × 10⁷ Pa 3.30 × 10⁻⁴ 0.3492 m
7 0.5357 9.41 × 10⁷ Pa 3.09 × 10⁻⁴ 0.3497 m
8 0.5714 9.65 × 10⁷ Pa 2.75 × 10⁻⁴ 0.3501 m
9 0.6071 9.88 × 10⁷ Pa 3.48 × 10⁻⁴ 0.3578 m
10 0.6429 9.51 × 10⁷ Pa 2.62 × 10⁻⁴ 0.3521 m
11 0.6786 9.76 × 10⁷ Pa 2.67 × 10⁻⁴ 0.3499 m
12 0.7143 1.01 × 10⁸ Pa 2.79 × 10⁻⁴ 0.3541 m
[image:4.595.205.540.500.733.2]DOI: 10.4236/wjet.2017.53B015 139 World Journal of Engineering and Technology
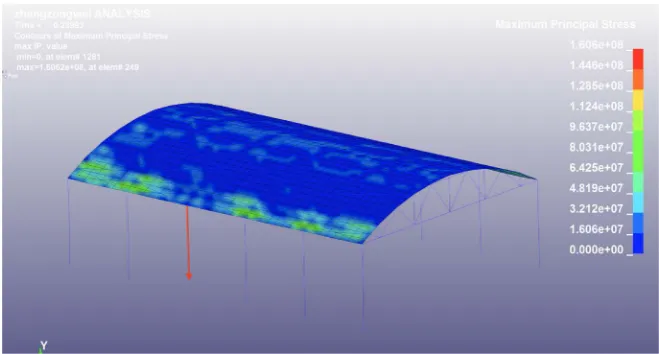
6. The Possibility of Progressive Collapse Analysis
The axial load in the 3rd side pillar was about 20 kN. For analyzing the possibil-ity of progressive collapse, the failure part (3rd pillar) was removed and the in-verse axial load was arranged on the same position, which was demonstrated in Figure 5. Besides the slack load, showed in Table 6 was arranged on the truss.
[image:5.595.208.538.193.370.2] [image:5.595.208.536.400.567.2]As it was showed in Figure 6, components will progressively fail and truss will collapse finally if the 3rd side pillar fails due to impact.
Figure 5. Inverse axial load on failed pillar position.
[image:5.595.207.537.616.722.2]Figure 6. Results of progressive collapse analysis.
Table 6. Time groups and loads groups.
Group 1 2 3
T 0 s 1 s
Q −20 kN −20 kN
F 1000 kN 1000 kN
T1 0 s 0.033 s 1 s
DOI: 10.4236/wjet.2017.53B015 140 World Journal of Engineering and Technology
7. Conclusions
In this paper, the finite element truss model with six trusses was established with ANSYS/LS-DYNA dynamic analysis software. It simulated the situations that structures were crashed by heavy truck. Through changing variables, such as the crash positions, the impact load intensity and structural height-span ratio, this paper concluded their effects to the stress and strain in truss structure. Besides, considering the component failure, this paper analyzed the possibility of struc-tural progressive collapse. Conclusions are shown as below:
1) Impact load on the 3rd side pillar will result in maximum stress in the structure, which is most destructive. The bearable maximum impact load inten-sity truss is about 1.8 × 10⁵ kg∙m/s (18 t × 10 m/s).
2) The stress will be stronger in truss with greater height-span ratio. When the ratio is less than 0.6, the maximum stress in structure will increase by 1 × 10⁷ Pa with ratio increasing by 0.05. When the ratio is more than 0.6, is has not signifi-cant effect to the stress.
3) If the 3rd side pillar fails due to impact, components will progressively fail and the truss structure will collapse even though the impact load intensity is less than 1.8 × 10⁵ kg∙m/s (18 t × 10 m/s).
References
[1] Sun, L.L. (2016) Application Prospect of Large-Span Spatial Steel Tube Truss Structure. Shanxi Architecture, No. 6, 56-57.
[2] Liu, F. and Lv, X.L. (2008) Nonlinear Dynamic Response of Truss Structure under Impact Loading. Journal of Vibration Engineering, 21, 107-114.
[3] Yu, M. and Cha, X.X. (2011) Performance of Concrete-Filled Steel Tubular Hollow Columns under Vehicle Impact. Progress in Steel Building Structures, 13, 57-64. [4] Wang, X.G. and Su, Y.P. (2011) Performances of Mechanics of Reinforced Concrete
Frame under Lateral Impact. Journal of Guangxi University (Natural Science Edi-tion), 36, 15-20.
[5] Xiao, Y. and Chen, L. (2013) Effect of Protective Bollard in Real Automobile Colli-sion. Journal of Vibration and Shock, 32, 1-6.
[6] Qu, H. and Huo, J.S. (2017) Experimental Study on Impact Behaviour of Steel Plane Tubular Frames. Thin-Walled Structures, 111, 210-223.
https://doi.org/10.1016/j.tws.2016.11.023
Submit or recommend next manuscript to SCIRP and we will provide best service for you:
Accepting pre-submission inquiries through Email, Facebook, LinkedIn, Twitter, etc. A wide selection of journals (inclusive of 9 subjects, more than 200 journals)
Providing 24-hour high-quality service User-friendly online submission system Fair and swift peer-review system
Efficient typesetting and proofreading procedure
Display of the result of downloads and visits, as well as the number of cited articles Maximum dissemination of your research work
Submit your manuscript at: http://papersubmission.scirp.org/