Query classification via Topic Models for an art image archive
Dieu-Thu Le
DISI, University of Trento
Raffaella Bernardi
DISI, University of Trento
Edwin Vald
Bridgeman Art Library
Abstract
In recent years, there has been an increas-ing amount of literature on query classi-fication. Click-through information has been shown to be a useful source for im-proving this task. However, far too little attention has been paid to queries in very specific domains such as art, culture and history. We propose an approach that ex-ploits topic models built from a domain specific corpus as a mean to enrich both the query and the categories against which the query need to be classified. We take an Art Library as the case study and show that topic model enrichment improves over the enrichment via click-through consider-ably.
1 Introduction
In Information Science, transaction log analyses have been carried out since its early stages (Pe-ters, 1993). Within this tradition, lately, Query Classification (QC) to detect user web search in-tent has obtained interesting results (Shen et al., 2006a; Shen et al., 2006b; Li et al., 2008; Cao et al., 2009). A QC system is required to auto-matically label a large propotion of user queries to a given target taxonomy. Successfully mapping a user query to target categories brings improve-ments in general web search and online advertis-ing. Recently, most studies have focused on the mapping of user queries to a general target tax-onomy. However, little has been discussed about learning to classify queries in a specific domain. In this paper, we focus on QC for queries in transac-tion logs of an image archive; we take the Bridge-man Art Library (BAL)1, one of the world’s top image libraries for art, culture and history, as our
1http://www.bridgemanart.com/
case study. Learning to classify queries in this do-main is particularly challenging due to the specific vocabulary and the small amount of textual infor-mation associated with the images. Examples of user queries taken from BAL logs and categories from BAL taxonomy are:
Queries monster woman; messe; ribera crucifix-ion; woman perfume, etc.
Categories Religion and Belief; People and Sci-ence; etc.
Clearly, classifying these queries against these domain specific categories is a hard challenge and standard text classification techniques need to be tailored for the specific problem in hands.
Following the literature on web search classifi-cation (Cao et al., 2009), we enrich the queries by exploiting the click-through information, which provides us with titles of the images as well as key-words assigned by domain experts to the clicked images. Furthermore, we employ unsupervised Topic Models (Blei et al., 2003) to detect the top-ics of the queries as well as to enrich the target taxonomy. The novelty of our work is on the use of Topic Models for a domain specific application and in particular the proposal of using the meta-data itself as a source to train the model.
We confirm the impact of the click-through in-formation, which increased the number of cor-rect categories found by 120%, and show that for closed domain image archive, Topic Models (TM) bring a valuable contribution when built out of a very domain specific data-set. In particular, we compare the results obtained by TM enrichment when the model is built out of (a) Wikipedia pages and (b) the Bridgeman Catalogue itself. The latter increased the number of correct categories found by 117% and resulted in a raise of 18% in F1-measure with respect to the classifier based on click-through information.
2 Bridgeman Art Library (BAL)
Taxonomy In Bridgeman Art Library, images are classified with sub-categories from a two-level taxonomy. We use “top-category” and “sub-category” to refer to the first and second level, respectively. The taxonomy contains 289 top-categories and 1,148 sub-top-categories, with an aver-age of ≈ 4 sub-categories for top-category. The top-categories can be divided into three main groups “topic”, “object” and “material”, we will come back to this with more details in Section 4. A sample of the taxonomy is given in Figure 1.
Figure 1: Taxonomy
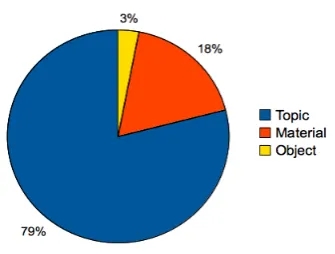
Catalogue The Catalogue contains 324,232 im-ages. Their distribution by group of category is as following: “Topic” 79%, “Material” 18% and “Object” 3% (Figure 2). For each image the meta-data contains the title, a description, keywords and a sub-category from the taxonomy above, besides other information we are not going to consider in this paper. The keyword field is for free-text terms (no controlled vocabulary is used), the terms pro-vides physical description, aspects of the image, like the color, shape or the object described, dates, conceptual terms, etc. An example is given in Ta-ble 1.
[image:2.595.332.500.67.194.2]Query Logs Query logs contain information about the queries (usually 1 to max. 5 words each)
Figure 2: Distribution of images in the Bridgeman metadata among the three groups: topic, material, object
and the corresponding clicked images (i.e., the image that the user clicked after submitting the query). Via this clicked image, queries can be mapped to the information about the image pro-vided in the metadata.
3 Data enrichment via Topic Models
Since a query can express different information needs and hence can be associated to different cat-egories, we choose multiple classification and aim to classify a query by assigning to it three top-categories out of the BAL taxonomy.
To overcome the distance in the vocabulary be-tween the queries and the categories, we enrich the query with the words from the title, description and keywords associated with the corresponding clicked image, and enrich the top-category with its sub-categories. We represent the enriched queries and enriched categories as vectors built using oc-currence counts as values for these words. Still this enrichment does not cover the gap between the query and the top-categories, hence we ex-ploit topic models (TMs) to reduce the distance and capture their semantic similarity. The full en-richment process is sketched in Figure 3.
Hidden Topic Models A topic model (Blei et al., 2003; Griffiths and Steyvers, 2004; Blei and Lafferty, 2007) is a semantic representation of text that discovers the abstract topics occurring in a collection of documents. Latent Dirichlet Alloca-tion (LDA), first introduced by (Blei et al., 2003), is a type of topic model that performs the so-called latent semantic analysis (LSA). By analyzing sim-ilar patterns of documents and word use, LDA al-lows representing text on alatent semantic level,
Title A Section of the Passaic Class Single-Turret Ironclad Monitor (engraving)
Keywords design, battleship, weapon, armoured, boat, submarine, warship, naval, cannon, ship;
Description Transverse section of pilot-house and turret;
The Passaic class, single- turret monitors of the U.S. Navy were enlarged versions of the original Monitor ships; the first Passaic was commissioned 5 November 1863;
[image:3.595.71.294.162.276.2]Sub-category Sea Battles
Table 1: Meta-data: An example
Figure 3: Enriching queries and categories: (1) Learning a TM from the universal data-set; (2) En-riching queries and categories with their topics
rather than by lexical occurrence. It has been used in many applications such as dimensionality reduction (Blei et al., 2003), text categorization, clustering, collaborative filtering and other tasks for textual documents as well as other kinds of dis-crete data.
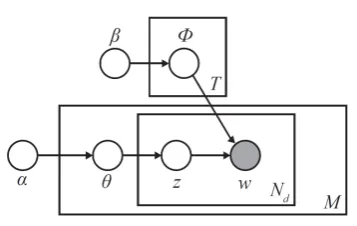
The underlying idea of LDA is based upon a probabilistic procedure of generating new docu-ments: First, each document d in the corpus is generated by sampling a distribution θ over top-ics from a Dirichlet distribution (Dir(α)). After that, the topic assignment for each observed word wis performed by sampling a topiczfrom a multi-nomial distribution (M ult(θ)). This process is re-peated until allT topics have been generated for the whole corpus.
Introduction Latent Dirichlet Allocation Gibbs Sampling Short Text Enrichment with Topic Models
LDA: Graphical Model
�
α
,
β
: Dirichlet prior
�M
: number of doc
�
N
d: number of words in
d
�
z
: latent topic
�w
: observed word
�
θ
: distribution of topic in
doc
�
φ
: distribution of words
generated from topic
z
Using plate notation:
�
Sampling of distribution over topics for each document d
�Sampling of word distributions for each topic z until T topics
Figure 4: Latent Dirichlet Allocation• α,β: Dirichlet prior
• M: number of documents
• Nd: number of words in documentd
• z: latent topic • w: observed word
• θ: distribution of topic in documents
• φ: distribution of words generated from topicz
Conversely, given a set of documents, we can discover a set of topics that are responsible for generating a document, and the distribution of words that belong to a topic. Estimating these pa-rameters for LDA is intractable. Different solu-tions for approximating estimation such as Varia-tional Methods (Blei et al., 2003) and Gibbs Sam-pling (Griffiths and Steyvers, 2004) can be used. Gibbs Sampling is an example of a Markov chain Monte Carlo with relatively simple algorithm for approximate inference in high dimensional mod-els, with the first use for LDA reported in (Griffiths and Steyvers, 2004).
In our experiment, we have estimated the multinomial observations by unsupervised learn-ing with GibbsLDA++ toolkit.2 Following the data enrichment approach in (Phan et al., 2010), we have enriched the query and category with hid-den topic. In particular, given a probabilityϑm,k
of document m over topic k, the corresponding weight wtopick,m was determined by discretizing ϑm,kusing two parameterscut-offandscale:
wtopick,m=
round(scale×ϑm,k),if ϑm,k ≥cut-off
0,ifϑm,k <cut-off
(1) We chose cut-off = 0.01, scale = 20 as to ensure that the number of topics assigned to a query/category does not exceed the number of original terms of that query/category, i.e., to keep a balance weight between topics enriched and orig-inal terms.
To discover the set of topics and the distribution of words per topic, we need to choose a universal data set. Since we are interested in topics within
[image:3.595.87.266.585.698.2]a rather specific domain, we need to choose a data set that provides an appropriate vocabulary. We have tried two options, a Topic Model built out of selected pages of Wikipedia and a Topic Model built out of BAL Catalogue.
Wikipedia Topic Model Wikipedia is a rich source of data that has been widely exploited to extract knowledge in many different domains. We have used a version of it, viz. WaCKypedia (Ba-roni et al., 2009),3 that contains around 3 million articles from Wikipedia segmented, normalized, POS-tagged and parsed. In order to extract those pages that could provide a better model for our specific domain, we selected those pages that con-tain at least one content word of the BAL browse categories listed below.
The Arts and Entertainment, Ancient and World Cultures, Architecture, Business and Industry, Crafts and Design, Places, Science and Medicine History, Religion and Belief, Sport, People and Society, Travel and Transport, Plants and Animals Land and Sea, Emotions and Ideas
For our vocabulary, we considered only words in the selected WaCKypedia pages that are either Nouns (N.*) or Verbs (VV.*) or Adjectives (J.*) after being lemmatized. We obtain ≈14K docu-ments, with a vocabulary of ≈ 200K words, out of which we computed 100 topics. Examples of random topics are illustrated in Figure 5.
Figure 5: Hidden topics derived from WaCKype-dia
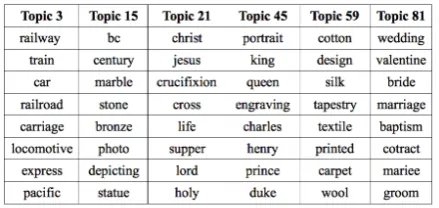
Bridgeman catalogue Topic Model The most straightforward way of choosing a close domain corpus is to use the Bridgeman catalogue itself. We group together images that share the same categories and consider each group of sub-category as a document. We have 732 documents and ≈ 136K words, out of which we computed 100 topics. Examples of topics estimated from this dataset are given in Figure 6.
3WaCkypedia (http://wacky.sslmit.unibo.
[image:4.595.307.527.63.167.2]it/doku.php)
Figure 6: Hidden topics derived from the Bridge-man catalogue
4 Data Sets
[image:4.595.74.292.464.570.2]Categories From a BAL six month log, we extracted all the top category connected to the queries via the click-through information and ob-tained the list of 55 categories given by group in Table 2.
Queries From the six month log we have ex-tracted a sample of 1,049 queries by preserving the distribution of queries per top-category obtained via the click-through information and the taxon-omy. We selected only queries with at least one clicked image. Not all image metadata contains title, keywords and a description: for around 60% of images the meta-data provides only the title and sub-category. For each query, we kept only one clicked image randomly selected. We leave for fu-ture study the impact the full set of clicked images per query could have on our query classifier.
Gold-standard: annotation by domain experts
The 1,049 queries have been annotated by a do-main expert who was asked to assign up to three categories per query out of the 55 categories in Table 2 and to mark the query as “unknown” if no category in the list was considered to be ap-propriate. The domain expert looked at the click-through information and the corresponding image to assign the categories to the query. The distri-bution of queries per group of categories obtained by this manual annotation is as following: 1395, 268, 87 queries have been annotated with a cat-egory out of the “topic”, “object” and “material” group, respectively.
Out of this sample, 100 queries have been anno-tated by three annotators, BAL cataloguers, twice: (a) by looking at the click-through information and the image, and (b) by looking only at the query. The agreement between the annotators in both cases is moderate (kappa in average 0.60 for
Topics Land and Sea; Places; Religion and Belief; Ancient and World Cultures; Mythology Mythological Myth; Allegory/Allegorical; People and Society; Sports and Leisure; History; Travel and Transport;
Personalities; Business and Industry; Costume & Fashion; Plants and Animals; Botanical; Animals; The Arts and Entertainment; Emotions and Ideas; Science and Medicine; Science; Medicine; Architecture; Photography.
Materials Metalwork; Silver, Gold & Silver Gilt; Lacquer & Japanning; Enamels; Semi-precious Stones; Bone, Ivory & Shellwork; Glass; Stained Glass; Textiles; Ceramics.
Objects Crafts and Design; Manuscripts; Maps; Ephemera; Posters; Magazines; Choir Books; Cards & Postcards; Sculpture; Clocks, Watches, Barometers & Sundials; Oriental Miniatures; Furniture;
[image:5.595.346.483.461.525.2]Arms, Armour & Miltaria; Objects de Vertu; Trade Emblems, City Crests, Coats of Arms; Coins & Medals; Icons; Mosaics; Inventions; Jewellery; Juvenilia/Children’s Toys & Games; Lighting;
Table 2: Categories used by the annotators
the annotation without click-through information and 0.64 for the annotation done using the click-through information), the agreement is higher for the categories within the “topic” group. For each annotator, using the click-through information and the image has not had a significant impact on the annotation of categories from the “topic” group (kappa in average 0.80), whereas it has increased and changed the annotation of categories from the other two groups, “object” (kappa 0.57) and “ma-terial” (kappa 0.62).
Gold-standard: automatic extraction from the meta-data of the clicked image The top-category associated in the taxonomy with the sub-categories of the image clicked after querying can be extracted automatically exploiting the click-through information. Hence, we created a sec-ond gold-standard using such automatic extrac-tion. Though our extraction is automatic, the as-signment of the categories to the images is the re-sult of the manual annotation by BAL cataloguers through the years. This annotation was done, of course, by looking only at the images, differently from the previous one for which the domain ex-perts was given both the query and the clicked im-age. This second gold-standard differs from the one created by domain experts. For instance, the query “mountain lake near piedmont” is classified to the category “Places” by the expert, while using the automatic mapping method, we obtain the cat-egory “Emotions & Ideas: Peace & Relaxation”. The kappa agreement between the manual annota-tion and the automatic extracannota-tion is 0.52, 0.53, 0.6 for categories within the “material”, “object” and “topic” group, respectively.
In our experiment, we will evaluate the classi-fier against the “manual” gold-standard and use the second one only to select the most challeng-ing queries (those queries the classifiers fail
clas-sifying in either cases: when evaluated against the manual or the automatic gold-standard) and anal-yse them in further detail.
5 Experiments
LetQ={q1, q2, . . . , qN}be a set ofNqueries and C = {c1, c2, . . . , cM} a set ofM categories. We
represent each queryqiand categorycjas the
vec-tors−→qi = {wtqi}t∈V and − →c
j = {wtcj}t∈V where V is the vocabulary that contains all terms in the corpus and wtqi, wtci are the frequency inqi and cj, respectively, of each termtin the vocabulary.
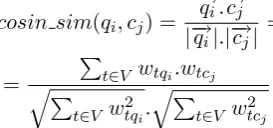
We use the cosine similarity measure to assign categories to the queries. For each query qi, the
cosine similarity between every pairhqi, cjij=1..M
is computed as:
cosin sim(qi, cj) = − →q
i.−→cj |−→qi|.|−→cj|
=
=
P
t∈V wtqi.wtcj q
P
t∈V wtq2i. q
P
t∈V w2tcj
For each query, the top 3 categories with highest cosine similarities are returned.
The different query and category enrichment methods are spelled out in Table 3. To evaluate the effect of click-through information in query classification, we set up two different configura-tions: QR, where besides the terms contained in the top and sub-categories,V consists of terms ap-pearing in the queries;QR-CT for whichV con-sists also of terms in the title, keywords, descrip-tion fields of the clicked images’ meta-data. In the case of the classifiers exploiting topic models, both vocabulary is extended with the hidden topics too and both queries and categories are enriched with them as explained in section 3. In particular, T Mwikiis the classifier based on the model built
WaCKpe-dia, and T MBAL is the one based on the model
built out of Bridgeman metadata.
Setting Query enrichment Category enrichment
QR q CAT + sCAT
QR-CT q+ct CAT + sCAT
T Mwiki q+ct⊕HTwiki CAT + sCAT⊕HTwiki
T MBAL q+ct⊕HTBAL CAT + sCAT⊕HTBAL
•q: query
•ct: click-through information: title, keywords and description - if available
•CAT: top category
•sCAT: all sub categories of the corresponding CAT •HTwiki: hidden topics from WaCKpedia
[image:6.595.333.499.105.170.2]•HTBAL: hidden topics from Bridgeman Metadata
Table 3: Experimental Setting
5.1 Results
To evaluate the classifiers, first of all we com-pute Precision, Recall and F-measure as defined for KDD Cup competition and reported below.4 The results obtained are given in Table 4.
P =
P
i#queries correctly tagged as ci
P
i#queries tagged as ci
(2)
R=
P
i#queries correctly tagged as ci
P
i#queries manually labeled as ci
(3)
F −measure= 2×P×R
P+R (4)
The F-measure average at KDD Cup competi-tion was 0.24, with the best performing system reaching the result of 0.44 F-measure. Differ-ently from our scenario, the KDD Cup task was for web search query classification against 67 gen-eral domain categories (like shopping, companies, cars etc.) and classifiers could assign max. 5 cate-gories.
In the following we report further studies of our results by considering the number of queries that are assigned the correct category in each of the three positions (Hits # 1, 2, 3). Furthermore,
4
http://www.sigkdd.org/kddcup/index. php?section=2005\&method=task
Precision Recall F-measure QR-CT 0.11 0.17 0.13 T MBAL 0.26 0.40 0.31
Table 4: P, R and F measures – Evaluation
we provide the total number of correct categories found in all position 1, 2 and 3 (P
T op3).
Setting Hits
# 1 # 2 # 3 P
T op3
QR 92 38 26 156
QR-CT 183 97 62 342
T Mwiki 145 112 88 345
[image:6.595.76.295.354.499.2]T MBAL 340 257 144 741
Table 5: Results of query classification: number of correct categories found (for 1,049 queries)
As can be seen in Table 5, the performance of query classification using only terms in the queries (QR) is very poor. Already enriching the query with the words from the title, keywords and description (QR-CT) increases the P
T op3
by nearly 120%.
Topics derived from the TM estimated from Wikipedia (T Mwiki) did not help much in
find-ing the right categories for a query. In comparison toQR-CT classifier, they decreased the number of correct categories in position 1 and they only slightly raised the number of correct categories when considering the three positions.
On the other hand, the TM built from the Bridgeman catalogue (T MBAL) increased the
[image:6.595.309.549.489.605.2]re-sults considerably for each of the three positions. Compared with QR-CT, 399 other correct cate-gories were further found by using topics extracted from the catalogue, giving a raise of 117%.
Figure 7: MatchingQR-CT andT MBAL correct
categories against the manual and automatic gold-standards
Figure 7 reports the number of hits in each po-sition 1, 2, 3 for the two settings QR-CT and T MBAL. It clearly shows that T MBAL
outper-forms QR-CT and matches more correct cate-gories both when considering either of the two gold-standards. It is interesting to note that this holds in particular for categories in the first
[image:6.595.81.280.696.739.2]tion of the ranked list (Hits #1): it results in a raise of 92% in the first position (from 224 correct cat-egories to 431).
5.2 Analysis of wrong classification
To better understand the results obtained, we looked into the wrong classification. Figure 8 re-ports the number of queries for whichQR-CT and T MBAL have not selected in the top three
[image:7.595.308.531.156.303.2]posi-tions any correct category using either the manual gold-standard and the automatic classification.
Figure 8: Queries incorrectly classified
We found that there were 692 queries (422+270) for which QR-CT had not found any correct category in the top three positions; whereas 326 queries incorrectly classified by T MBAL, of which 270 queries were in common
with those wrongly classified byQR-CT.
[image:7.595.75.292.225.335.2]We further analyzed the set of 270 queries of Figure 8 which we take to be the most difficult queries to classify since neither of the two clas-sifiers have succeed with them considering ei-ther the manual or the automatic gold-standard. These queries and the categories assigned to them by the QR-CT andT MBAL classifier have been
checked and evaluated again by the domain expert. Figure 9 gives an example out of the 270 and the result of the second run evaluation by the domain expert. The top categories assigned to the query “mountain lake near piedmont” by the classifier QR-CT andT MBALare “Ancient & World
Cul-tures” and “Land & Sea”, respectively. The two categories do not match either the correct category assigned by the expert (“Places”) or the category assigned by the automatic method (“Emotions & Ideas”). However, after being checked by the ex-pert, it was decided that the category proposed by the T MBAL classifier (“Land & Sea”) was also
correct whereas the one assigned byQR-CT was not. This query and click-through information do not share any common words with the category
“Land & Sea” and its sub-categories, hence it was not possible for theQR-CT classifier to spot their similarity. However, the enrichment with the hid-den topics discovered the similarity between the query and the top-category: they share topic 14with high probability.
Figure 9: Effects of TM on the classification task
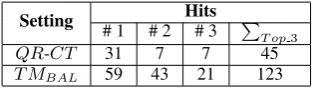
In total, the categories assigned to these 270 queries, were considered to be corrected in 123 cases for the T MBAL classifier and in 45 cases
for theQR-CT (Table 6).
Setting Hits
# 1 # 2 # 3 P
T op3
QR-CT 31 7 7 45
T MBAL 59 43 21 123
Table 6: Correct categories checked by the expert for the 270 queries (using the click-through infor-mation)
Finally, the numbers of queries with at least one correct label out of these 270 queries are 39 (14%) for the QR-CT method and 115 (43%) for the T MBALmethod.
6 Related Work
(Cao et al., 2009) shows that context information is crucial for web search query classification. They consider the context to be both previous queries within the same session and pages of the clicked urls. In this paper, we focus on information simi-lar to the latter and postpone the analysis of query session to further studies. (Cao et al., 2009) also shows that the taxonomy-based association be-tween adjacent labels is useful for our task. Sim-ilarly, we exploit Bridgeman taxonomy to enrich the categories target of the classifier.
[image:7.595.338.495.408.453.2]created via click-through information is inspired by (Hofmann et al., 2010) where it has been shown that system rankings based on clicks are very close to those based on purchase decisions. There is strong evidence in favor of the relevance of click-through data to detect user’s intention.
7 Conclusions
This paper shows the effect of the click-through information and the use of topic models in query classification in the art, history and culture closed domain. The main contribution of this study is the proposal of using the metadata as a source to train topic models for the query and category enrich-ment. In particular, we first enriched the queries with the click-through information including in-formation associated with the image clicked by the user. Then, we used topic models built out of Wikipedia and the Bridgeman catalogue to an-alyze topics for both of the queries and the target categories. Experiments from the real dataset ex-tracted from the query logs have shown the impact of the click-through information and topic models built from the catalogue in helping to find the cor-rect categories for a given query.
In this paper, we have not considered more than one click-through image for each query. How-ever, we expect that more click-through images can give a better understanding of user intent. Fur-ther research regarding this issue might be studied in more detail in future.
Acknowledgments
This work has been partially supported by the GALATEAS project (http://www.galateas.eu/ – CIP-ICT PSP-2009-3-25430) funded by the Euro-pean Union under the ICT PSP program.
References
Marco Baroni, Silvia Bernardini, Adriano Ferraresi,
and Eros Zanchetta. 2009. The WaCky wide
web: a collection of very large linguistically pro-cessed web-crawled corpora. Language Resources and Evaluation.
David M. Blei and John D. Lafferty. 2007. A corre-lated topic model of science. AAS, 1(1):17–35.
David M. Blei, Andrew Y. Ng, and Michael I. Jordan. 2003. Latent dirichlet allocation. J. Mach. Learn. Res., 3:993–1022, March.
Huanhuan Cao, Derek Hao Hu, Dou Shen, Daxi Jiang, Jian-Tao Sun, Enhong Chen, and Qiang Yang. 2009. Context-aware query classification. In SIGIR’09, The 32nd Annual ACM SIGIR Conference.
T. L. Griffiths and M. Steyvers. 2004. Finding scien-tific topics. Proceedings of the National Academy of Sciences, 101(Suppl. 1):5228–5235, April.
Katja Hofmann, Bouke Huurnink, Marc Bron, and Maarten de Rijke. 2010. Comparing click-through data to purchase decisions for retrieval evaluation. InSIGIR’10.
Xiao Li, Ye-Yi Wang, and Alex Acero. 2008. Learn-ing query intent from regularized click graphs. In
SIGIR’08.
Thomas Andrew Peters. 1993. The history and devel-opment of transaction log analysis. Library Hi Tech, 11(2):41–66.
Xuan-Hieu Phan, Cam-Tu Nguyen, Dieu-Thu Le, Le-Minh Nguyen, Susumu Horiguchi, and Quang-Thuy Ha. 2010. A hidden topic-based framework to-wards building applications with short web docu-ments. IEEE Transactions on Knowledge and Data Engineering, 99(PrePrints).
Dou Shen, Rong Pan, Jian-Tao Sun, Jeffrey Junfeng Pan, Kangheng Wu, Jie Yin, and Giang Yang. 2006a. Query enrichment for web-query classifi-cation. ACM Transactions on Information Systems, 24(3):320–352.
Dou Shen, Jian-Tao Sun, Qiang Yang, and Zheng Chen. 2006b. Building bridges for web query classifica-tion. InSIGIR’06.