Determining an indicator list
for benchmarking delivery
logistics in proton therapy
treatment
And a systematic review of operations research
application in particle therapy logistics
Tim Schwarte
Master Thesis, Health Sciences
July 2016
Examination Committee:
Abstract
Introduction: The application of particle therapy (PT) for treatment of cancer patients is increasing worldwide. PT centres can easily cost in excess of €100M to build and operate and should therefore be operated as efficiently as possible. Operations research (OR) is a field of mathematics that is applied to optimise processes. Benchmarking is a method used to compare processes and identify areas of improvement for benchmarking partners. The goal of the paper is to create a list of viable data indicators for a benchmark study and supply an overview of current OR methods used in PT to guide future improvement.
Methods: A benchmarking system for specialty hospitals was applied to PT centres. Stakeholder and PT process analysis were used to construct a list of indicators to be assessed by PT centres for data availability, definition clarity, and discriminative value. The results of the assessment were used to determine viable indicators. Additionally, PubMed and Scopus were searched for papers on OR application in PT treatment logistics. Databases were searched from 2000 to February 2016. Inclusion criteria were presence of OR methods and application of these methods in the treatment phase of PT. Results: From the original list of 28 proposed indicators, eight were approved, six were conditionally approved, two were merged, three were modified, and nine were discarded. From the literature review, another two indicators were added. Nine studies were included in the literature review: The literature search returned 42 results from which five papers were included in the study. Four additional papers were included from references.
Conclusion: PT centres gather enough data for a viable comparison in a benchmark but extraction of large amounts of data can be troublesome . Users of the indicator list should take care to correct for differences in data entry points. Literature review shows that simulation and linear programming are the most applied OR methods in PT. Radiation delivery processes are well modelled but staff utilisation is not.
Table of contents
List of figures ... 3
List of tables ... 4
1. Introduction ... 1
2. Research methods ... 2
2.1 Benchmark indicator selection ... 3
2.1.1 Determining benchmark scope ... 3
2.1.2 Benchmark partner selection ... 4
2.1.3 Stakeholder analysis ... 5
2.1.4 Defining benchmarking framework, domains and indicators... 7
2.1.5 Stakeholder assessment of indicators ... 11
2.2 Systematic literature review ... 12
3. Results ... 13
3.1 Benchmark indicator selection ... 13
3.2 Qualitative questionnaire ... 22
3.3 Systemic literature review ... 23
4. Discussion ... 29
4.1 Quantitative indicator selection ... 29
4.2 Systematic literature review ... 30
4.3 Future research ... 31
5. References ... 34
Appendix A: Qualitative questionnaire before assessment ... 38
Appendix B: Quantitative indicators before assessment ... 40
Appendix C: Qualitative questionnaire after assessment ... 44
Appendix D: Results of systematic literature search ... 46
Pubmed Query 1 ... 46
Pubmed Query 2 ... 46
Scopus Query 1 ... 48
Scopus Query 2 ... 48
List of figures
Figure 1: “Benchmarking process, visual representation of the research method”. ... 3Figure 2: Parts of proton therapy process included in study ... 4
List of tables
Table 1: Patient categories for analysis ... 5
Table 2: Stakeholder attributes according to Mitchell, Agle & Wood ... 6
Table 3: Stakeholder analysis ... 6
Table 4: Information required for construction of process flowcharts ... 8
Table 5: Summary of indicator feedback ... 14
Table 6: results of indicator assessment ... 15
Table 7: data entry points for IBA system logs ... 18
Table 8: final list of indicators... 19
1
1.
Introduction
The use of particle therapy (PT), such as protons and carbon ions, for cancer treatment is expanding rapidly and being implemented on a worldwide scale. Although the therapeutic possibilities of proton particle beams have been long known (1, 2) and facilities providing such treatment have been in operation at research institutes since 1969 (3), technological and medical advances have allowed the construction of specialised multi-room hospital based particle therapy centres on an increasing scale since 1990 and especially since the start of the 21st century. (2-5) Currently, there are over thirty
facilities in operation which have treated over 100.000 patients as of December 2013. (6) Another 44 are under construction or in the planning stage, four of which are in The Netherlands. (7, 8)
Porter defines value in healthcare as outcomes / costs. (9) Proton beam therapy has been proven to reduce the risk of damage to surrounding tissue for selected indications while achieving same or better tumour control, leading to better health outcomes and a reduced risk of side-effects. The cost-effectiveness of proton therapy compared to state-of-the-art photon therapy such as IMRT is, due to high initial investment costs and the current lack of high-quality comparisons of clinical outcomes, at best disputed. (5, 10-13) While clinical trials to investigate the effect on medical outcomes are part of regular operations in most PT centres, it is less common to research the operational practices of PT centres regarding the other aspects of the value equation: costs, and non-medical outcomes such as patient and staff satisfaction.
Operations management (OM) is a combination of operations research and management science (OR/MS) methods that can be applied to analyse and improve production processes. OR quantitative methods are especially applicable to logistics and planning processes, which are important to improve the use of resources while accounting for user preferences. (14) For further effect, operations research can be combined with business quality management practices like LEAN and Six Sigma to reduce and prevent waste and reduce variance in healthcare operations. (15-17)
2
Benchmarking is an OM method that can be used to compare operations and identify best practices. (24) Van Lent, De Beer & Van Harten have developed a framework for benchmarking specialty hospitals, including cancer therapy centres. (16) Objective and comparable data indicators are critical elements of a benchmark process. As to date, no indicator set has been developed for PT, a benchmark of existing PT centres cannot yet be performed. A study of current practices and present research is required to develop such an indicator set.
A combined study of indicator set development, including adjudication by operational centres, and a systematic literature search reviewing present literature on OM practices in PT logistics has been performed to achieve the following objectives:
1. To determine a feasible set of data indicators to be used in a benchmark of proton therapy centres,
2. To determine the current state of operations research in proton therapy logistics and how this research compares, especially regarding the indicators used, to the operational demands of active proton therapy centres, and:
3. Identification of opportunities for improvement in operating proton therapy facilities, primarily (but not limited to) using operations research methods.
2. Research methods
Two separate methods are required to give a complete overview of the available information. First, the benchmark protocol by Van Lent, De Beer & Van Harten (16) was used to investigate available information (data indicators) that can be used to perform a future benchmark. Second, a systematic literature review was performed to determine the current state of OR applications in PT, to identify the OR methods, objectives, and indicators used, and to identify differences between these studies and the operational feedback from benchmark participants.
3
2.1 Benchmark indicator selection
The benchmark protocol (16) is designed for international benchmarking of specialty hospitals. Specialty hospitals have been described by Schneider et al. (25) as hospitals “that treat patients with specific medical conditions or those in need of specific medical or surgical procedures.” Proton therapy centres, due to their singular focus on cancer treatment, fit very well within this categorization. Therefore, this method is suitable for the intended benchmark.
This study focuses on the development of an indicator list for a future benchmark. The following steps from this method have been executed in this study:
- Determining benchmark scope
- Selection, definition and verification of main
characteristics of benchmarking partners.
- Identification of relevant stakeholders.
- Defining benchmarking domains and indicators. - Obtaining stakeholder input and feedback on
indicators, domains and framework
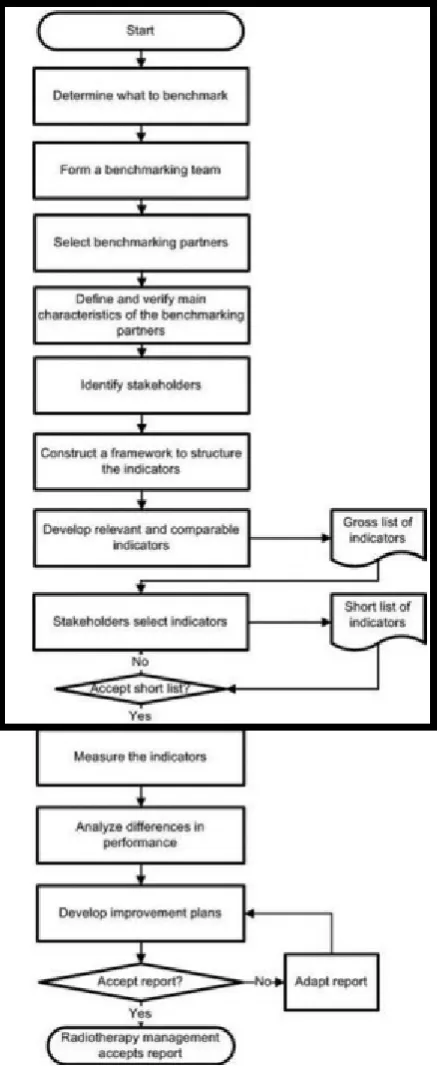
The benchmarking process itself has been visualised by Van Lent, de Beer, van Triest & van Harten in figure 1 (26), The scope of the indicator selection process is shown within the black rectangle.
2.1.1 Determining benchmark scope
[image:7.595.30.251.72.606.2]Scientific papers on particle therapy processes (4, 27-31), PT centre websites (32-34) and other sources (35, 36) were consulted to get an overview of the workings of a particle therapy facility. Although more detailed medical and technical information is available on every step of the PT process, a general overview suffices to construct the workflow of a PT centre and differentiate relevant indicators.
4
Particle therapy treatment processes consist of two distinct phases: 1) the pre-treatment phase, consisting of intake, (additional) diagnosis and treatment /dose planning, and 2) the treatment phase, which concerns the actual delivery of the dose by a particle accelerator and is split up into several fractions (visits). (4, 19) A purely logistical benchmark will be limited to the treatment phase: although the pre-treatment phase can be measured and compared, the efficiency of this process is not crucial to the efficiency of the treatment phase. The configuration of particle accelerator and treatment rooms are the primary strategic factor in determining the capacity of a PT centre and are set by the way the centre is constructed. This configuration cannot be changed on an operational level as changes would require costly additional construction and are very disruptive to operational processes. Diagnostics capacity in the pre-treatment phase, imaging capacity in the pre-treatment phase and required staff in both phases can be changed more easily by hiring more staff and construction of diagnostics/imaging capacity is less expensive or disruptive than treatment rooms. Most of the activities in the pre-treatment phase are started some 7-10 days in advance but can be completed in a shorter period if necessary. The availability of a first appointment slot in the treatment phase is the determining factor in the required completion time of this phase.
Limiting the scope of the benchmark to the treatment phase will also limit the number of indicators required and the associated resources for collection and analysis. Therefore, the treatment delivery phase in general and specifically the use of the particle accelerator is the primary focus of this study and we start analysing the process from the moment a complete treatment plan has been generated and is ready for independent verification. The final point of the scope is the end of the treatment process, i.e. when the final fraction has been delivered. A schematic overview of which parts of the proton therapy process are covered by this study can be found in figure 2.
2.1.2 Benchmark partner selection
While the benchmark in general focuses on the entire range of patients in a PT centre, it may be unlikely that a PT centre treats all different tumour types in sufficient numbers to generate enough evidence suitable for comparison. Therefore, the patient scope of the study focuses on specific tumour categories in both adult and paediatric patients as noted in Table 1. These tumour categories have been
Figure 2: Parts of proton therapy process included in study. black = included, white = not included.
Consultation
Simulation &
dose planning
Independent
treatment
verification
Treatment
(fraction)
delivery
5
selected to reflect the most important and likely categories of patients for proton therapy: in Italy (37), the Netherlands (38) and the U.K. (39) these categories are included in the standard indications for proton therapy, meaning that these are tumour types to be primarily treated with protons. Within these standard indications these are the most complex tumour types, often requiring multiple angles of irradiation, and therefore the most likely to benefit from OR optimisation. Participating centres can take part in either the benchmark of adult patient processes, the paediatric benchmark or both.
Table 1: Patient categories for analysis
Patient category Process type
Adult Skull base tumours (40-43)
Tumours of the head and neck (44-47)
Paediatric (anaesthesia) Medulloblastoma (48, 49)
Ependymoma (49, 50)
For the benchmark of treatment processes for adults, participating centres have to meet the following characteristics: 1) centres have treated or are planning to treat skull base and/or head and neck tumours and have in place or designed logistical (not clinical) processes for treatment of said tumours, and 2) deliver treatment using a pencil-beam (spot)-scanning or IMPT system.
Centres in the paediatric benchmark will have to treat or intend to treat significant numbers of paediatric Medulloblastoma and Ependymoma under anaesthesia. Because of the relatively low incidence of paediatric cancers and the relatively high amount of time associated with anaesthesia compared to the treatment delivery, neither the type of treatment delivery technique used nor the location where anaesthesia is administered is of concern in the paediatric benchmark.
2.1.3 Stakeholder analysis
Stakeholder identification has started with the research performed by Van Lent, De Beer & Van Harten (16), who have identified cancer centre management, radiotherapy department management, radiation oncologists and clinical physicists as stakeholders. Further identification was performed by analysing PT delivery for the presence of stakeholders within the classification used by Patel et al. and grouped accordingly. (51)
6
one or more of these attributes. Only stakeholders that possess all three attributes, termed “definitive stakeholders”, will be included in the indicator selection.
Table 2: Stakeholder attributes according to Mitchell, Agle & Wood
Attribute Description (original from Mitchell, Agle & Wood, 1997: table 3, p.869) (52))
Power “A relationship among social actors in which one social actor, A, can get another social actor, B, to do something that B would not have otherwise done.“
Legitimacy "A generalized perception or assumption that the actions of an entity are desirable, proper, or appropriate within some socially constructed system of norms, values, beliefs, and definitions"
Urgency “The degree to which stakeholder claims call for immediate attention.”
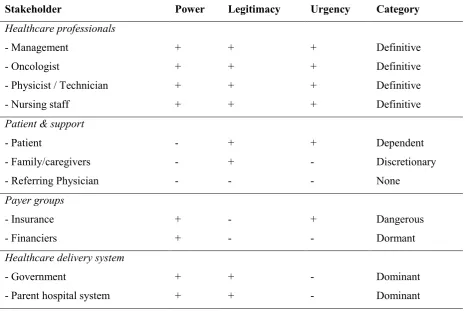
[image:10.595.66.537.452.763.2]Within the operational scope of this benchmark, Power can be explained as the ability to immediately influence, disrupt or change logistical procedures, legitimacy as a genuine claim to consideration in the day to day details of treatment delivery and urgency as the degree in which a stakeholder should be consulted on a frequent basis. As can be seen in Table 3, healthcare professionals involved in the day to day operations of the clinic are all definitive stakeholders, as they have direct control over these processes, and are included in the indicator selection.
Table 3: Stakeholder analysis
Stakeholder Power Legitimacy Urgency Category
Healthcare professionals
- Management + + + Definitive
- Oncologist + + + Definitive
- Physicist / Technician + + + Definitive
- Nursing staff + + + Definitive
Patient & support
- Patient - + + Dependent
- Family/caregivers - + - Discretionary
- Referring Physician - - - None
Payer groups
- Insurance + - + Dangerous
- Financiers + - - Dormant
Healthcare delivery system
- Government + + - Dominant
7
Mitchell, Agle & Wood (52) discuss the possibility stakeholders can gain or lose attributes and the associated relevance. This is most important when a stakeholder possesses two out of three attributes, in this case patients, insurers, government and the parent hospital system. Patient’s needs are normally managed by the centre’s staff, in terms of access time, appointment slots and medical effectiveness, and patients have little individual power over the procedures. However, when a patients’ needs are not carefully monitored or in case of complications, patients can gain power, for instance by utilising insurers, patient organisations or the media to draw attention. Insurance companies are not normally inclined nor expected to interfere with the day to day proceedings of medical institutions but can gain legitimacy if their demands, for instance access time and costs, are not met by the centre. The power of insurers to move business is considerable. The government and parent hospital do not normally have an urgent claim to interference on an operational level but can become powerful stakeholders in case of underperformance or changes in the way these institutions conduct business, such as reorganisations or changes in healthcare laws, as centres are dependent on the frameworks set by these stakeholders.
Stakeholders who possess only two out of three attributes may not have a significant influence on day to day operations, but their objectives must not be ignored in any change process. To simplify the indicator approval process, we have assumed that the patients interest are championed by the doctors in reducing access and throughput times, the institutional stakeholders (government, insurer, parent system) are taken care of by management and that physicists and technical staff, due to their overlapping responsibilities, can be combined into one category.
2.1.4 Defining benchmarking framework, domains and indicators.
The benchmark framework consists of two different analyses: qualitative analysis and quantitative analysis. The qualitative analysis concerns the comparison and evaluation of the design of logistical (non-medical) protocols in use at a centre to identify differences in the way a centre handles patients, resources and information streams required to facilitate particle therapy treatment. Since this is an evaluation of design, this can also be done in centres that are not yet in operation. The quantitative analysis concerns the performance of the designed logistical protocols and is being done through the measurement of key performance indicators throughout the process. When a difference in performance is measured, design analysis can be used to account for the difference and define areas of improvement for centres where performance is not optimal.
Qualitative analysis
8
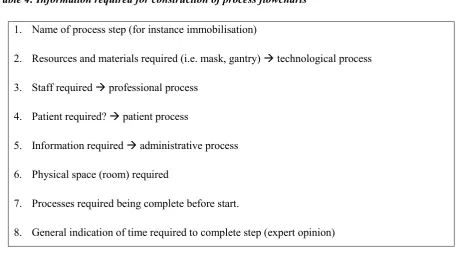
[image:12.595.75.532.297.552.2]The benchmark requires general descriptions for processes for both adult and paediatric patients and, when different from the general process, more in-depth information about the selected patient categories in Table 1. Information is needed concerning four different logistical processes: the patient process, which concerns activities of the patient, the administrative process, which concerns information transfers required to treat the patient, the technological process, which concerns the preparation and use of the proton beam treatment rooms, and the medical professional process which concerns staff planning and availability. These processes will largely coincide, as the activities in one process are entangled with the three other processes, and can therefore be graphically combined in key stages of the treatment delivery. This will give a clear overview of the preparations and executions in each centre. An overview of information required for constructing the process maps can be found in Table 4.
Table 4: Information required for construction of process flowcharts
1. Name of process step (for instance immobilisation)
2. Resources and materials required (i.e. mask, gantry) technological process
3. Staff required professional process
4. Patient required? patient process
5. Information required administrative process
6. Physical space (room) required
7. Processes required being complete before start.
8. General indication of time required to complete step (expert opinion)
Furthermore, information is needed because differences in operating procedures outside the direct logistical process may influence the results of the quantitative measurements. It is necessary to have additional information about resource use, operating framework and staffing levels of centres to determine the baseline levels in which a centre operates and to determine how to correct for differences within these baselines.
9
access time, service quality, shared decision making and patient satisfaction. Technical aspects are limited to the required maintenance and associated loss of operating time.
Additional questions are included concerning the appointment scheduling process used in the centres. Successful utilisation of a shared resource, such as particle accelerators and gantries can be seen as a combination of two factors: appointment scheduling and the execution of this schedule. (54) There are two distinct steps in the scheduling process for which information is required: tactical block scheduling, which allocates treatment time in large blocks for a period of months, operational treatment appointment planning that distributes the allocated blocks over specific patients. Last, information on the treatment planning verification procedure is needed to assess the procedure to approve a patient for the start of the irradiation.
A complete overview of the questions can be found in Appendix 1.
Quantitative Analysis
In addition to the literature used to determine the benchmark scope processes (4, 27-36), research by Li & Benton (14), Hulshof et al. (18) and Van Lent et al. (26) has been consulted to construct a framework of potential indicators. Li & Benton have defined both production efficiency and utilisation as the main cost performance domains. Hulshof et al. classify radiation as an ambulatory care service and have identified indicators and methods in these fields. Van Lent et al. have performed a benchmark of radiotherapy centres and have established a shortlist of 33 indicators applicable to this cause. Furthermore, a literature search has been performed in the ORCHESTRA (55) database to identify indicators in use in operations research not mentioned in these papers. While the database did not show any papers regarding PT applications of OR, it did give an overview of the data indicator requirements for OR application.
An example of this can be found in a paper by Kortbeek et al. (54), which includes various indicators that are of impact to the performance of a schedule and as such the production efficiency and utilisation. Relevant indicators include the number of resources, time slots length and availability, no shows and access time. Using the information on PT processes, these indicators have been adapted for the PT situation. This paper also indicates the importance of appointment duration, it is relevant to determine the contents of an appointment and influencing factors in some detail. Studies and process descriptions by Combs et al. (4), Rieken et al. (56) and the University of Florida PTC (35) show the process inside the treatment room and give information about the specific steps involved in proton beam delivery. This information has been used in the resource utilisation indicators.
10
been established as a result of the literature study. Subsequent consultation with Amsterdam Proton Therapy Centre staff with knowledge about the process has reduced the number of indicators for consideration by stakeholders to 28. This list is presented in Appendix 2.
Variance is essential to identify OR research projects, and raw data should be supplied wherever possible. For instance, the numerator time required for treatment plan verification (indicator #7) consists of the added up individual times of treatment verification. These individual times can be used to calculate variance. Indicators are written as if one year of raw data is available.
Structure indicators
Structure indicators concern the proton therapy centre as a whole. All operations in the centre should be considered in determining these indicators.
Staff workload (#1) is a general indicator which can be used to assess differences in staff utilisation. Workload can be defined as the staff-to-patient ratio: the amount of full-time-equivalent (FTE) of staff per patient. As patients require different amounts of fractions, it is more useful to use fractions as the denominator. Patient population (#2-3) concerns the amount and type of patients that are (expected to be) treated at a centre to get an overview of the case mix per centre. These indicators concern the entire patient population of a participating centre and are required to properly scale activities and resources for comparison. Data for these indicators is also used in many process indicators. Available equipment (#4,5,6) should be assessed to calculate utilisation and correct for differences between centres.
Process indicators
Process indicators are not automatically homogenous for a facility as a whole. Therefore, when the indicator requires patient-specific information for the nominator or denominator (such as the number of fractions), indicators should be stratified per tumour type to generate comparable results. The ideal situation would be to have as much data on different tumour types as possible, but the minimum requirement would be information on the patients types as determined in Table 1.
(#26-11
28) should be minimised for efficient operations but cannot be totally avoided. This section provides indicators for downtime and maintenance measurement. In this case, working hours are hours that a patient normally could have been treated. Quality assurance is required to assure correct targeting precision to make sure the beam is delivered to the specification of the treatment plan.
2.1.5 Stakeholder assessment of indicators
12
2.2 Systematic literature review
A systematic literature search was performed in Pubmed and Scopus from January 2000 up and until the date of the last search, February 27, 2016. Inclusion criteria were:
1. Item was published in journal, conference proceeding or PhD-thesis 2. Item covers particle therapy,
3. Item describes the application of at least one OR/OM method.
4. Item covers treatment delivery logistics. Most importantly, papers that cover OR/OM methods only to optimise dose delivery, which is outside the scope of the proposed benchmark, were excluded.
To find articles relating to OR/OM research in particle therapy, two search queries were used. First, a direct search was performed for OR/OM in particle therapy. Search terms were placed within brackets as the individual keywords have other meanings within medical research and would return results outside the intended scope.
1: ("Operations research" OR "operations management") AND ("proton therapy" OR "particle therapy" OR "hadron therapy")
OR/OM might not be specifically designated in an article but such articles can contain information on logistical optimisation. Therefore, an additional search was performed on the most common subjects in logistics and capacity planning:
2: ( capacity OR throughput OR appointment ) AND ( planning OR scheduling ) AND ( "proton therapy" OR "particle therapy" OR "hadron therapy" )
References within included articles were screened and articles were sought that cited included articles for additional publications that are relevant to this study.
13
3. Results
3.1 Benchmark indicator selection
The proposed set of indicators and the qualitative questionnaire was sent to eight particle therapy centres: five in Europe and three in the USA. Four European and one US centre (62.5%) have responded and stated their intention to participate in the benchmark process and provide feedback. Two US centres (25%) have indicated that no resources were available to participate and one European centre (12.5%) has not responded.
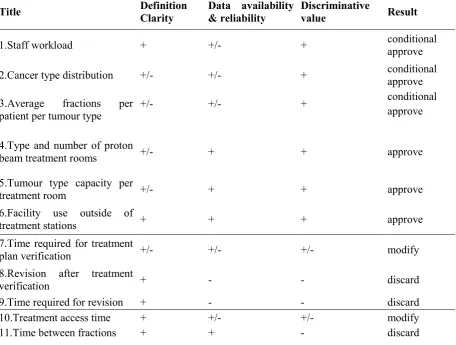
Formal feedback was received from 5 centres. Feedback on the quantitative indicator set was received from four centres (80%): One centre (20%) was not yet operational and indicated that feedback on the quantitative indicators could not be supplied. Centres were invited to comment on the qualitative indicators as well: one centre (20%) has submitted formal feedback and two other centres (40%) have provided informal feedback during a visit by the author. One centre (20%) indicated that paediatric patients under anaesthesia were rarely treated (~1/year) and that no information could be given on the paediatric procedure. Centres were asked to assess indicators by at least one member of all stakeholder groups but the feedback was received as one document, and the internal assessment procedure is unknown. During site visits to several centres, the author spoke to all stakeholders, except nursing staff, while presenting and discussing the project. A summary of feedback is presented in Table 5, and the assessment of indicators can be found in Table 6
14 Table 5: Summary of indicator feedback
15
These differences have the greatest effect on indicators that require the number of fractions. One centre has indicated that they have no methods in place to extract the number of fractions for individual patients without extensive amounts of work as data needs to be extracted for individual patients without the option to aggregate data before extraction. The amount of data that centres are willing to provide would be reduced due to the linear scaling of resources required to extract data on patient level: more information would require more staff time and associated expenses. This leads to the conditional approval of indicators #1, #2 and #3: before the benchmark can be performed possibilities to make extraction of patient treatment characteristics, such as scripts used by other centres or other possibilities to initiate a system dump from Mosaiq, should be researched. Alternatively, data collection from this centre could be restricted to the categories mentioned in Table 1 or a period that is representative for the centres activities could be sampled. Other centres have not indicated any problems with the availability of this data. Possible effects of these restrictions will be illustrated in the discussion section.
[image:19.595.72.529.430.775.2]The way cancer type distribution was described in indicator #2-5 was not clear to all centres. After inquiry as to which classification for tumour type was the most accessible for centres, the use of the ICD-10 classification for patients is the best option to determine tumour type.
Table 6: results of indicator assessment
Title Definition
Clarity
Data availability & reliability
Discriminative
value Result
1.Staff workload + +/- + conditional
approve
2.Cancer type distribution +/- +/- + conditional approve
3.Average fractions per
patient per tumour type +/- +/- +
conditional approve
4.Type and number of proton
beam treatment rooms +/- + + approve
5.Tumour type capacity per
treatment room +/- + + approve
6.Facility use outside of
treatment stations + + + approve
7.Time required for treatment
plan verification +/- +/- +/- modify
8.Revision after treatment
verification + - - discard
9.Time required for revision + - - discard 10.Treatment access time + +/- +/- modify
16
12.Treatment completion time + + - discard
13.Patient on-site waiting
time + - - discard
14.No-shows + + + approve
15.Patient lateness + - - discard
16.Staff overtime +/- +/- + modify
17.appointment duration + + + approve
18.Radiation time as part of
appointment time + + + approve
19.Proton beam not on patient + + + approve
20.Proton beam unavailability + + + approve
21.Treatment room utilisation
(immobilisation) + +/- +
conditional approve 22.Treatment room utilisation
(positioning) + +/- +
conditional approve
23.Positioning accuracy + - - discard
24.Treatment room utilisation
(nozzle adjustment) + - + discard
25.Time required for
anaesthesia + +/- +
conditional approve
26.Unscheduled maintenance + +/- + Merge #27 with
27.Other downtime + +/- + Merge #26 with
28.Quality assurance time + - - discard
17
time verification by the physics department is complete. The resulting time between the completion of verification and start of treatment can be used to measure the workload of the verification department in indicator #10. While these indicators can only be used to benchmark centres if the expected amount of time left is equal to other centres, it can be valuable for benchmarking against the internal norms of a centre. On indicators #8 and #9, centres have stated that the number of revisions and associated resource spending is not tracked.
Indicators #11 and #12 are discarded due to the way a PT treatment is divided into fractions: all centres have indicated that patients are treated with one fraction per day, five days per week from the start until the completion of the dose requirements. This means that a patient with X fractions requires X days of treatment, and this does not differ between centres. Hypofractionation, the use of a higher dose per fraction in fewer fractions per treatment, is not systematically applied within the responding PT centres. Possible future changes concerning hypofractionation will be discussed later in this paper.
Patient on-site waiting time (#13) and Patient lateness (#15) are not reliably measured by centres. The staff can shift appointments in case of serious disruptions to the schedule. This means that these two indicators are not discriminative for the process as patients can get shifted at the staff's discretion.
Data on staff overtime (#16) is not available for all staff types. Centres have indicated that data is available with regards to the scheduled and realised end of treatment and thus for staff directly involved with the patient process, but not with regards to the support staff and the activities employed after regular treatment hours. The indicator can be modified to measure regular operating overtime only by measuring the difference between the scheduled and realised end time of the last patient.
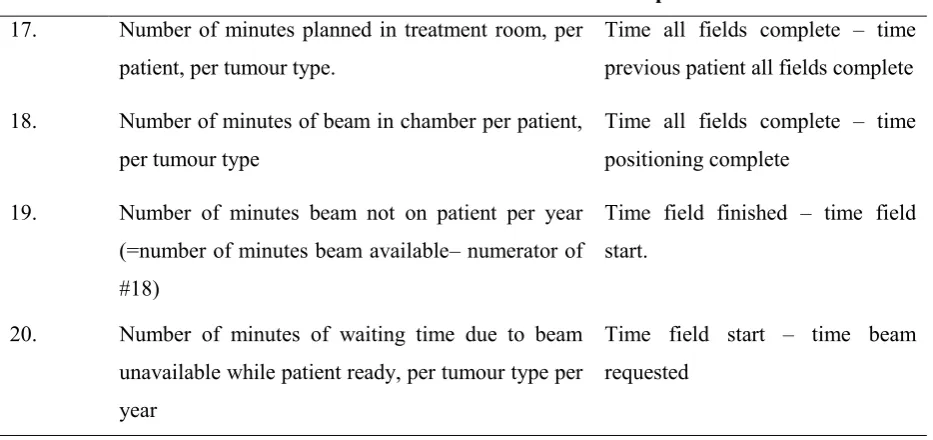
18 Table 7: data entry points for IBA system logs
Indicator Numerator Data points
17. Number of minutes planned in treatment room, per patient, per tumour type.
Time all fields complete – time previous patient all fields complete
18. Number of minutes of beam in chamber per patient, per tumour type
Time all fields complete – time positioning complete
19. Number of minutes beam not on patient per year (=number of minutes beam available– numerator of #18)
Time field finished – time field start.
20. Number of minutes of waiting time due to beam unavailable while patient ready, per tumour type per year
Time field start – time beam requested
Data on unscheduled downtime and maintenance (#26-27) is available in limited form: Not all delays are registered as unscheduled downtime, and the distinction whether unscheduled downtime includes aspects that can be described as maintenance is not clear. One centre has replied that downtime greater than ten minutes is registered in logs but less than ten minutes is not. Therefore, these two indicators can best be combined to include both downtime and maintenance over ten minutes in time. Centres have indicated that quality assurance (QA) occurs outside regular operating hours and is part of the start-up procedure. As with indicator #23, time spent is dependent on the quality and safety framework of the centre and is influenced by the manufacturer and regulatory demands and procedures. It is unlikely that this indicator has discriminative value in an international benchmark.
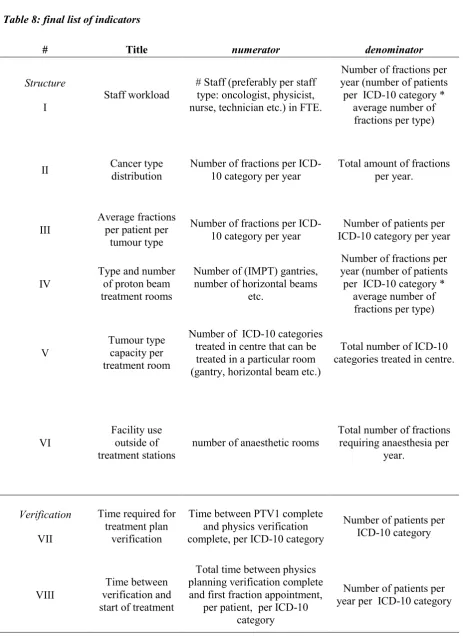
19 Table 8: final list of indicators
# Title numerator denominator
Structure
I
Staff workload
# Staff (preferably per staff type: oncologist, physicist, nurse, technician etc.) in FTE.
Number of fractions per year (number of patients per ICD-10 category *
average number of fractions per type)
II Cancer type distribution Number of fractions per ICD-10 category per year Total amount of fractions per year.
III
Average fractions per patient per
tumour type
Number of fractions per ICD-10 category per year
Number of patients per ICD-10 category per year
IV
Type and number of proton beam treatment rooms
Number of (IMPT) gantries, number of horizontal beams
etc.
Number of fractions per year (number of patients per ICD-10 category *
average number of fractions per type)
V
Tumour type capacity per treatment room
Number of ICD-10 categories treated in centre that can be treated in a particular room (gantry, horizontal beam etc.)
Total number of ICD-10 categories treated in centre.
VI
Facility use outside of treatment stations
number of anaesthetic rooms
Total number of fractions requiring anaesthesia per
year.
Verification
VII
Time required for treatment plan
verification
Time between PTV1 complete and physics verification complete, per ICD-10 category
Number of patients per ICD-10 category
VIII
Time between verification and start of treatment
Total time between physics planning verification complete and first fraction appointment,
per patient, per ICD-10 category
20
No-shows
IX
No-shows Total number of fractions not delivered due to patient not available, per ICD-10 category
Number of fractions per year, per ICD-10 category
staff
X
Staff overtime
Number of minutes worked after scheduled end of last patient treatment, per staff type
per year.
Number of working days per year.
throughput
XI
Appointment duration
Number of minutes planned in treatment room, per patient, per
ICD-10 category
Number of fractions planned per patient, per
ICD-10 category
XII
Radiation time as part of appointment time
Number of minutes of beam in chamber per patient, per
ICD-10 category
Number of minutes treatment room allocated,
per patient, per ICD-10 category
XIII Proton beam not on patient
Number of minutes beam not on patient per year (=number of minutes beam available–
numerator of #18)
Number of minutes beam available for treatment per
year
XIV unavailability Proton beam
Number of minutes of waiting time due to beam unavailable while patient ready, per
ICD-10 category per year
Number of minutes of radiation time (including waiting time) per ICD-10
category per year
XV
Treatment room utilisation (immobilisation)
Number of minutes required for immobilisation, per patient
per tumour type
Number of minutes treatment room allocated, per patient, per tumour type
XVI
Treatment room utilisation (positioning)
Number of minutes required for positioning, per patient, per
ICD-10 category
Number of minutes treatment room allocated,
21
XVII Time required for anaesthesia
Number of minutes required for anaesthesia, per patient, per
ICD-10 category
Number of fractions, per patient, per ICD-10
category
XVIII Beam switch time time field started - time beam requested
Number of minutes treatment room allocated, per patient, per tumour type
XIX Time per field time field finished - time field started
Number of minutes treatment room allocated, per patient, per tumour type
downtime
XX
Unscheduled maintenance &
downtime
Number of minutes of unscheduled delay >10 minutes during working hours, per year.
22
3.2 Qualitative questionnaire
Assessment of the qualitative questionnaire showed that two areas required more attention. The first area is the start-up period of a PT centre. Two of the centres had recently started activities or added significant resources, such as a new gantry treatment room, and were interested in the experiences of other centres during the start-up period. This is also of interest for the situation in the Netherlands where all four centres are scheduled to start operations in the coming two years. For this purpose, the following questions were added to the questionnaire:
- During the first year of start-up:
1. Did the number of patients per week/month fluctuate and if so, how?
2. Were you able to adapt staffing to the number of patients treated? If so, how?
3. Were you able to adapt the radiation delivery capacity (for instance closing/opening treatment rooms, changing operating hours/days) to the number of patients treated? If so, how?
4. How did you ensure patient recruitment? What was the role of the insurer in patient recruitment/referral?
Second, centres have indicated that the questions about staff satisfaction cannot be answered in depth with the current formulation, but centres are interested in this information. The current formulation of this question is intended to give a general overview of the most relevant experiences regarding staff and patient satisfaction, and the question has been reformulated to reflect this objective.
From the assessment of the quantitative indicators, it was determined that the quality assurance indicators could not be measured and were better suited for process descriptions in the qualitative section. For this purpose the following questions were added:
Quality Assurance
1. Could you describe the quality assurance process used to calibrate treatment delivery with the treatment plan?
2. Could you describe your experience in optimising this process?
3. Do you use Monitor units and/or Gamma index methodology to calibrate quality assurance procedures and if so, what are your experiences and what is the tolerance required?
23
3.3 Systemic literature review
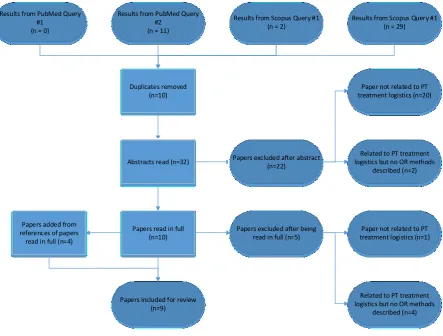
The total number of results was 42. Query one returned no results in Pubmed and two in Scopus. Query two returned eleven results in Pubmed and 29 in Scopus. Ten results were duplicates, 22 results were excluded after reading the abstract and five after having been read in full. Five papers were included in the study. From the references of these papers another four papers were included. A schematic overview of the selection process can be found in figure 3. An overview of the included papers, their methods, data classification according to Vieira et al. (65), objectives and the indicators used can be found in Table 9.
Results from PubMed Query #1
(n = 0)
Results from PubMed Query #2
(n = 11)
Results from Scopus Query #1 (n = 2)
Results from Scopus Query #1 (n = 29)
Duplicates removed (n=10)
Abstracts read (n=32) Papers excluded after abstract (n=22)
Paper not related to PT treatment logistics (n=20)
Related to PT treatment logistics but no OR methods
described (n=2)
Papers read in full (n=10)
Papers excluded after being read in full (n=5)
Paper not related to PT treatment logistics (n=1)
Related to PT treatment logistics but no OR methods
described (n=4) Papers added from
references of papers read in full (n=4)
[image:27.595.79.523.230.566.2]Papers included for review (n=9)
Figure 3: Overview of literature selection process
24
hospitals as input for the time parameters and sample these numbers to define a range of variability for the output. This means that these times can also be compared against the results of the data gathered through the proposed indicator set.
Price, Golden, Wasil & Zhang (68) and Price (69) have built a simulation model to improve the patient throughput of a PT facility. This research continues on the work done by Fava et al. (67) and uses a simulation model to investigate further possibilities for facility layout and resource optimisation. Throughput and waiting times are determined for a facility with anywhere between two to six gantry rooms. This model can be used to calculate several key performance values for stakeholders, such as the total amount of patients treated, idle times and waiting times. The research shows a decreasing economy of scale for facilities with increasing numbers of resources due to the model being based on a centre having only one beam generator (cyclotron/synchrotron), which is a standard situation. The extended research (69) adds additional scenarios such as inpatient/outpatient mix, block scheduling, patient arrival reliability, equipment failures and anaesthesia. These papers give a great amount of insight into the variability of centres parameters, and the simulation is one of the most extensive published in this field. It uses a large number of indicators that are also proposed in this study and can be used as a starting point for further research after the results of the benchmark.
Aitkenhead et al. (70) have built a Monte Carlo simulation model for a proposed UK PT centre and benchmarked their model against the MD Anderson, Houston, USA, PT centre. The model calculates the maximum throughput of a facility, patient waiting time and beam idle time under a case mix derived from the MD Anderson data but does not use a schedule or block planning as the extended Price model does. A sensitivity analysis was performed to study the effects of variation in the patient set-up time, beam switch time and caseload complexity. Last, a simulation of a two-cyclotron situation has been done. The authors conclude that the model is a good fit to the real-world realised throughput.
Gedik, Zhang & Rainwater (71) describe a Markov model to optimise adherence to a pre-determined patient mix. A balanced patient mix is important to predict access times, workload and revenue stream: The length of a treatment slot, beam time and gantry use is determined by the characteristics of the patient. The authors intend to maximise the number of patients treated while adhering to a profitable patient mix. The use of a Markov model allows for the selection of multiple options instead of a single mathematically optimal solution and gives more flexibility to schedulers. This paper is also commendable for its related work section, which gives an excellent overview of the literature of admissions planning optimisation in radiotherapy.
25
within a category is not met. Further constraints used are gantry specialisation, starting date restrictions, anaesthesia and multi-fraction treatment days.
A paper by Wang, Marcon & Pomier (73) also covers the subject of admission planning through constraints programming. The authors try to maximise the number of patients treated by programming an admission schedule that takes into account patient priority, required time and resources, and the amount of revenue a patient provides. The resulting model provides decision support for PT centres as to which patients can be treated in a timely manner within the constraints set by the business model of the centre and which need to be referred to other centres.
Cao et al. (74) use integer programming to reduce the number of energy levels required for a fraction delivery through Intensity Modulated Proton Therapy (IMPT). Although this paper concerns dose planning and would therefore fall outside the scope of the benchmark, one of the starting points of this research was to reduce the amount of time required for the fraction delivery, and the resulting model has direct implications for the optimisation of patient throughput. The solution proposed by the authors has lead to a reduction of energy levels required ranging from 11% to 26.5%, depending on the tumour type. This translates to a gantry time reduction of 12 to 126 seconds on the cases tested in this paper.
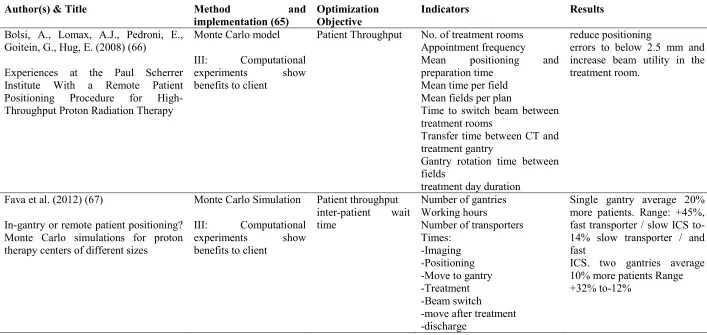
26 Table 9: Included papers and core information
Author(s) & Title Method and implementation (65)
Optimization Objective
Indicators Results
Bolsi, A., Lomax, A.J., Pedroni, E., Goitein, G., Hug, E. (2008) (66)
Experiences at the Paul Scherrer Institute With a Remote Patient Positioning Procedure for High-Throughput Proton Radiation Therapy
Monte Carlo model
III: Computational experiments show benefits to client
Patient Throughput No. of treatment rooms Appointment frequency Mean positioning and preparation time
Mean time per field Mean fields per plan
Time to switch beam between treatment rooms
Transfer time between CT and treatment gantry
Gantry rotation time between fields
treatment day duration
reduce positioning
errors to below 2.5 mm and increase beam utility in the treatment room.
Fava et al. (2012) (67)
In-gantry or remote patient positioning? Monte Carlo simulations for proton therapy centers of different sizes
Monte Carlo Simulation
III: Computational experiments show benefits to client
Patient throughput inter-patient wait time
Number of gantries Working hours
Number of transporters Times:
-Imaging -Positioning -Move to gantry -Treatment -Beam switch
-move after treatment -discharge
Single gantry average 20% more patients. Range: +45%, fast transporter / slow ICS to-14% slow transporter / and fast
27
S Price, B Golden, E Wasil, HH Zhang (2013) (68)
Optimizing throughput of a multi-room proton therapy treatment centre via simulation
Price (2015) (69)
Applying operations research models to problems in health care (PhD Thesis)
Simulation
II: Computational experiments with real data
Patient throughput (fractions delivered) Gantry wait time Excess gantry time Gantry utilization Inpatient/outpatient distribution
Block scheduling
Number of gantries Working hours
Number of fields (patient mix) Patient lateness % outpatient Block size Priority system Times: -Imaging -Move to gantry
-Preparation (positioning) -First field
-(Gantry realignment) -(other fields)
-Discharge from gantry
Reduction of avg. Total wait time by 2 minutes. Gantry wait time by 37s/patient. little extra wait time added (about 6%), in switching from individually scheduled arrivals to block scheduling in the presence of early and late patient arrivals
Aitkenhead et al. (2012) (70)
Modelling the throughput capacity of a single-accelerator multitreatment room proton therapy centre
Monte Carlo Simulation
III Computational experiments show benefits to client
Patient throughput Beam waiting time Utilization %
Patient mix
Number of gantries Equipment uptime Times: -patient set-up -anaesthesia set-up -equipment set-up -beam switch -beam delivery
good agreement between the modelled (140¡4 fractions per day) and reported (133¡35 fractions per day) throughputs
Gedik, Zhang, Rainwater (2016) (71)
Strategic level proton therapy patient admission planning: a Markov decision process modeling approach
Markov Model
II: Computational experiments with real data
Gantry utilization Patient mix adherence
Number of gantries Patient mix
Times:
-Scheduling block
28
Men (2009) (72)
Optimization models for radiation therapy : treatment planning and patient scheduling (PhD Thesis)
Linear programming (constraints programming)
III: Computational experiments show benefits to client
Patient throughput Appointment time Patient mix adherence
Patient satisfaction
Number of gantries Working hours
New patient starting hours First-time patients
Anaesthesia required
Anaesthesia team availability Gantry specialization
Times:
-Intra-fraction -Snout changing -Treatment
-appointment time deviation
#fractions per day under different scenarios: 77 to 126 (base 100). Increased number of paediatric patients.
Wang, Marcon, Pomier (2011)(73)
Online scheduling for a hadrontherapy center
Linear programming (constraints programming)
II: Computational experiments with real data
Patient throughput (Revenue) Overtime Opening hours Patient mix Patient priority Times: -Treatment
Decision support feasible for both off- and online scheduling
Cao W, Lim G, Liao L, Li Y, Jiang S, Li X, Li H, Suzuki K, Zhu XR, Gomez D, Zhang X. (2014) (74)
Proton energy optimization and reduction for intensity-modulated proton therapy.
iterative mixed-integer programming optimisation
IV: Results of computational experiments validated by client
Treatment time proton beam energy state
Number of fields Number of energy states Total delivery time Number of spots
29
4.
Discussion
To our knowledge, this study is the first attempt to determine PT benchmark attributes that are validated by prospective participants. The benchmark methodology used required that the decision what to benchmark was made at the start of the study. This meant that a focus on the logistical processes was immediately adapted. However, from the feedback on the developed indicators and questionnaire, it is noticed that the patient, who is not identified as a definitive stakeholder for the scope of the benchmark, is a definitive stakeholder in the eyes of the centres. This stakeholder is not well represented in the developed indicators. Although this is acceptable as patients have little influence on the processes studied the outcomes of this process to the patients are very relevant to the responding centres. As the importance of outcomes in the definition of value in healthcare is growing it is advisable to take the outcomes into account in any situation where a process is analysed. The recommended approach to this situation is to carefully research the desired outcomes of prospective benchmarking partners before the stakeholder analysis. Any stakeholder that is not included in the definitive category through their influence on the process but is referred as important for outcomes by the centre should be included in the definitive category. This is especially true for stakeholders that possess two out of three attributes. Doing so would create several scenarios for the benchmark, depending on the stakeholders present. For instance, a more patient centred approach would take into account indicators such as adherence to preferred time slots or waiting times for companions while a more insurer-based approach would focus on maximum cost reduction with less attention to patient and staff indicators.
4.1 Quantitative indicator selection
The most important limitation in the determination of the indicator set is the relatively low number of centres that have given feedback on the quantitative section: four. Of these four, one centre has given in-depth information on the amount of information available, possible data points and bottlenecks. Two centres have given thorough feedback on the availability of data and the limitations of their output but have not given feedback on possible data points. The last centre has only given an assessment on the availability of data. This means that although this set of indicators is feasible for these centres, the generalisability of this set to other centres is unknown. However, the literature study shows that the indicators proposed for this study have also been extracted from to other PT centres and used in simulation studies. It is therefore expected that the proposed indicator set is feasible for application in existing models and can be applied to other centres for future benchmarking.
30
of the scope of this benchmark. To determine performance in terms of the patient as a stakeholder it may be of value to include the access time and case mix in the benchmark but this would significantly widen the scope of the benchmark: Although the treatment plan is supposed to be complete any time before start of treatment this is not possible without the resources available in the planning and physics department. For an effective benchmark of the access time, it is therefore not only required to know the patient mix and associated scheduling characteristics, which is included in the indicators, but also the workings of the diagnosis and treatment planning procedure. This would require new process analysis and indicator development for the pre-treatment phase.
From the assessment of indicators, feasibility of data extraction was identified as the primary restriction on the acceptance of the quantitative part of the benchmark. While most information was available through one of several software systems, the required effort to extract the data could be more than acceptable under current circumstances as there is no straightforward (or automated) method to generate a data dump to be used for quantitative analysis. Sampling data could limit the amount of effort required, but a site visit to one of the centres made clear that seasonal influences are present and it is difficult to determine a period that samples the right patient mix in sufficient numbers for statistical analysis. For the current situation, it is advisable to work with the manufacturer of the patient management software to find a workaround for this problem. The popularity of benchmarking is increasing, and the expected future situation in the Netherlands is ideally suited to benchmark the four planned centres. Action should be taken to ensure that the means to generate comparable data is part of the development of the centres software systems, for instance by making the possibility to generate data dumps part of the purchasing tender for the patient management software.
4.2 Systematic literature review
31
papers is done through well-defined contextual search terms that return the papers on the OR subject one is interested in.
Most published models use Monte Carlo simulation methods. This is no coincidence: Monte Carlo models are best suited to provide information on scenarios with several parameters that can vary in magnitude. However, the variance in these simulations is modelled by a probability distribution and the models are not in agreement as to which distributions to use. This means that while models may be a good fit to an existing situation, this must be revisited for the specific expected distribution of each simulated centre. The data gained in the benchmark can be used to better estimate the best distribution for simulation studies that can be applied to multiple centres.
Linear programming can be used to optimise one single parameter. These studies are effective for specific scenarios but other parameters can only be controlled by constraining. This implies that the parameter to optimise must be carefully chosen to align with the stakeholder analysis, and an in-depth knowledge of the preferences and limits of all stakeholders should be known in order to set the right constraints.
It is notable that significant effort is taken to optimise patient throughput, patient mix and waiting time. These indicators belong to management and patient stakeholders, but very little attention is paid to staff indicators. All models assume that unlimited staff is available in all departments and that every preparation step is complete before the start of the model. This is logical considering the objectives of the simulations but not realistic given the costs of staff and other resources.
Optimisation of non-gantry resources is especially important in the planned PT centres in The Netherlands. As these are all relatively small, 2 or 3 treatment rooms each, it is unlikely that high beam utilisation can be achieved due to the processes other than irradiation that takes place in the treatment rooms. Optimisation of these processes can lead to a greater increase in utilisation than in centres with higher numbers of treatment rooms. Additionally, remote positioning such as described by Bolsi et al. and Fava et al. is more suitable to smaller centres. However, future developments in imaging, such as MRI-assisted PT, lead to high-quality imaging equipment being available inside the treatment rooms and the obsolescence of remote positioning.
4.3 Future research
32
uniform between centres. Therefore, the main issue to be kept in mind when performing the benchmark is to correct for differences in data entry.
The presented list of indicators has been assessed by centres in four different countries, each with their culture of healthcare delivery and reimbursement. It is thus expected that the benchmark can be expanded to include other centres without much adaptation, but each centre needs to make an
assessment. To make data as comparable as possible, it is advised to include at least one user of every major producer of PT equipment and patient management software to increase knowledge of data entry points and comparability.
The responding centres have indicated that the use of both hypofractionation and adaptive planning can influence the validity of the current benchmark parameters. Hypofractionation is a radiation treatment technique that delivers more than the regular amount of radiation to a patient, using a smaller amount of longer than regular fractions. This decreases the number of fractions that can be delivered in a treatment day but may lead to less variation in the schedule. Adaptive planning divides the treatment into several stages, for instance, five five-day stages for a 25-fraction treatment, and creates a new treatment plan for every stage. Creating multiple treatment plans instead of one requires additional imaging and verification resources; this extra load has to be taken into account.
The results of the OR literature search show a clear knowledge gap concerning the use of shared resources such as nursing and anaesthesia staff. Only one centre was a true stand-alone outpatient clinic, the other responding clinics are part of a larger hospital and depend in some way on the resources supplied by this hospital. All reviewed studies simulate a centre with no outside influence and unlimited staffing. The way staff interacts with the patient and the technological process is well suited for a simulation study that includes facility layout optimisation.
Current models use either an average with standard deviation and range limits to determine a possible range of variation or a block planning with averages in the indicators used for simulation. While these simulations indicate that a high utilisation is not acceptable because of bottlenecks and the requirement for some slack in the process, no study to date has determined how this slack should be quantified in a PT setting. Simulation models can be developed that allow slack to be included in the calculation of an appointment schedule. The data generated by the benchmark would be ideally suited for determination of a statistical distribution and the resulting slack calculations. It is expected that this will improve the scheduling efficiency and throughput.
33
The models developed by Gedik, Zhang & Rainwater and Wang, Marcon & Pomier use the amount of revenue that patients create in a comparison against the required resources and patient mix adherence. These kind of models are very heavy on computational resources but can be simplified. If these models are reversed, they can be used to calculate a price point for a specific patient and access time. In a true market setting, this can be used to create a digital market in which insurers can ask for a price quote for their patients: this would lead to higher amounts of competition in the healthcare market and a lower price for consumers. The applicability of these methods in the strictly regulated PT market is limited: Due to the high costs of capital, limited patient mix in comparison to radiotherapy and limited numbers of centres is it easy to distort this market by (temporarily) setting an unreasonably low price to gain market advantage. Additionally, detailed knowledge about the price structure of medical services would be required to operate such a system; this information is likely unknown to hospital staff. This lack of knowledge is subject to intense discussion about the structure of the healthcare market and using computer aided pricing models would require hospitals to restructure their business models.