Structured production
planning and control using a
push-pull hybrid approach
Paul Maarleveld 5-11-2015
Author
P.J. Maarleveld
Supervisory committee
i
Management summary
Problem & objective
The main problem for production planning at Company X is the high degree of variability. Company X is a supplier for Original Equipment Manufacturers and as such, it does not have its own products. Company X (engineers and) manufactures customer specific products on demand (pull-controlled). The market is characterized by short delivery times. Demand and product-mix are difficult to predict, if not impossible. It operates in an environment of “unknown unknowns”. Not only is demand unknown, neither is the product which will be manufactured. Order priority can change rapidly, causing waiting time for others. As a result, the internal lead time increases and becomes uncontrolled. The production schedule is frequently infeasible. The main research question is:
“How could the planning function at Company X be improved so as to support the company’s objective of controlling and reducing internal lead time?”
Approach
With information gathered during preliminary conversations, we define several problem areas pertaining to planning and control. These problems are translated into research questions. Based on the conclusions from a literature review and analysis of the current situation at Company X, we identify the current network of television screens as an opportunity to focus ourselves in the direction of a solution. The solution approach is adapted to fit the characteristics of Company X and tested using a simulation study to prove its favorable effect.
Findings
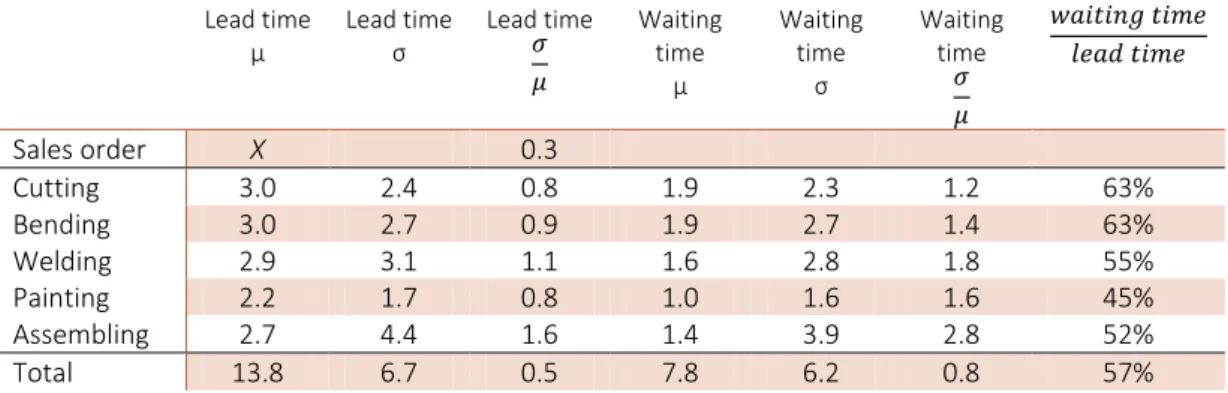
The current sales order lead time is X days on average, whereas the actual internal lead time is 13.8 days. 57% of the internal lead time consists of waiting time. Using queueing theory, we conclude that we cannot explain, predict or control how and when internal lead time increases. Nor is there a typical or average situation of demand and product mix. We are forced to accept that we cannot completely control our scheduled production using the current Material Requirements Planning
(MRP) method (push-controlled). We find a gap between research and practice. Because neither a pure push nor pure pull approach is fitting, we come to understand that a hybrid push-pull approach is needed. None of the hybrid approaches described in the literature proves particularly useful. We identify four things to prevent the lead time from increasing uncontrollably:
1. A method to roughly assess required versus available capacity (push); 2. A method to schedule the production orders (push);
3. A flexible material control system to achieve an efficient order flow (pull);
4. A mechanism to guard the scheduled production order lead time between departments (pull).
ii
The solution provides us with an approach to meet requirements 3 and 4. The order release mechanism based on available capacity in the next capacity group, prioritizes the orders in queue based on a pull strategy. We work on production orders for which we know capacity is available downstream, ensuring an efficient order flow (3). Meanwhile, the solution has the ability to guard the MRP schedule by limiting the allowable workload in a capacity group (4).
This approach is tested using a simulation study and the result provides us with a proof of concept. The new approach outperforms the current approach; it decreases the lead time by 15% and reduces its variability. The ability to maintain the MRP schedule is increased, while the throughput remains the same. Unfortunately, because no such thing as a typical or average situation of demand and product mix exists, the hypothetical simulation model is not suitable to predict how much reduction in lead time is to be expected if implemented. This is expected however and not the intended objective of the simulation study. Case studies in literature show lead time reduction between 22 and 70%.
This new approach is not a stand-alone solution to the problems at Company X. We identify the possibility to increase the chances of success by dividing the complex problem of planning into several planning levels. This also helps to make the planning function more transparent and understandable. A hierarchical framework is used to distinguish between a strategic, tactical and operational level, each with its own objectives, responsibilities and tools.
Recommendations
We recommend to implement the new approach as an operational tool in a hierarchical planning framework. It should be combined with a balanced workload over the capacity groups using MRP on a tactical level. We recommend to plan against 80% capacity on a tactical level to account for uncertainty. On an operational level we work at 100%. This will improve lead time, decrease Work In Progress (WIP) inventory in production, while maintaining throughput. Any unused safety capacity we recommend is used to fulfill short term customer orders, solve backlog or work ahead of schedule to free up capacity at a later time. On a strategic level, we recommend to strengthen the tactical and operational performance by facilitating with the right resources and clear objectives. For example, well-trained and well-maintained multifunctional employees to promote the exchange of flexible capacity.
iii
Preface
After I finished my bachelor of applied science at the Hogeschool Utrecht, it felt as if I had not yet learned as much as I had hoped for. Looking back on my period at the University of Twente, I really have the feeling I challenged myself to go the extra mile and be as much as I can be. I feel very proud and satisfied to present to you the result of my efforts over the last nine months. A period during which I experienced ups and downs, but in the end came out stronger and wiser. I could not have done it without the support of some people I would like the thank.
First of all, I would like to thank the people at Company X for their collaboration and interest in my research. I would especially like to thank Jasper for his excellent guidance and the way he has supported me in achieving this great result. I sincerely hope that the outcome of this research will help Company X in its future endeavors.
Second of all, I would like to thank Ahmad and Peter for their efforts, valuable insights and pleasant cooperation.
Thirdly, I would like to thank my parents and my sisters. I am grateful for their love and support. I feel very fortunate to have had the possibilities my parents gave me.
Last but not least, I would like to thank Ruth for everything she has done for me and her believe in me during the good times and the bad.
Paul Maarleveld
Location X, November 2015
v
Table of content
Management summary ... i
Preface ... iii
Table of content ... v
List of abbreviations ... vii
1. Introduction ... 1
1.1 Personal motivation ... 1
1.2 Company background ... 1
1.3 Origin of the problem ... 1
1.4 Detailed problem description ... 2
1.5 Research question ... 4
1.6 Research scope ... 5
1.7 Deliverables ... 5
1.8 Approach ... 5
1.9 Structure of the report ... 6
2. Theoretical framework ... 7
2.1 Lead times ... 7
2.2 Shortcomings of Enterprise Resource Planning systems ... 9
2.3 ERP and Lean manufacturing ... 11
2.4 Push vs. pull and hybrid approaches ... 13
2.5 Structured planning ... 16
2.6 Summary... 18
3. Production process and performance analysis ... 21
3.1 Manufacturing system typology ... 21
3.2 Production process ... 21
3.3 Current performance ... 23
3.4 Lead and waiting time explained... 25
3.5 Lead time and waiting time controlled ... 29
3.6 Theoretical landscape... 30
3.7 Summary... 31
4. Workload and lead time control ... 33
4.1 Push-pull hybrid system ... 33
4.2 POLCA adaptation... 34
4.3 Approach ... 37
4.4 Electronic capacity loops ... 38
vi
4.6 Expected benefits ... 43
4.7 Capacity groups ... 43
4.8 Summary... 45
5. Simulation study ... 47
5.1 Simulation ... 47
5.2 Model ... 47
5.3 Concepts of interest ... 51
5.4 Allowable workload ... 52
5.5 Current vs. new approach ... 57
5.6 Conclusions and limitations ... 59
5.7 Summary... 59
6. Planning structure ... 61
6.1 Objective of planning ... 61
6.2 Operational level ... 62
6.3 Tactical level ... 63
6.4 Strategic level ... 63
6.5 Summary... 65
7. Conclusions, recommendations and future research ... 67
7.1 Conclusions ... 67
7.2 Recommendations... 69
7.3 Future research ... 70
Appendix A: Order flow current order release... 72
Appendix B: Order flow new order release ... 73
Appendix C: Hierarchical planning framework ... 74
Appendix D: Organization chart ... 75
Appendix E: Roadmap ... 76
vii
List of abbreviations
BOM Bill Of Materials
CODP Customer Order Decoupling Point ERP Enterprise Resource Planning ETO Engineer-To-Order
FCFS First Come First Serve FCS Finite Capacity Scheduling
HIHS Horizontally Integrated Hybrid System IT Information Technology
JIT Just In Time
MPS Master Production Schedule MRP Material Requirements Planning MTO Make-To-Order
MTS Make-To-Stock
OEM Original Equipment Manufacturer OPT Optimized Production Technology
POLCA Paired-cells of Overlapping Loops with Capacity Authorization RCCP Rough Cut Capacity Planning
TPS Toyota Production System
1
1.
Introduction
1.1
Personal motivation
This thesis is written as part of my master program Industrial Engineering and Management to obtain the degree of Master of Science at the University of Twente. The research is conducted for the planning department at Company X over a period of nine months and focuses on introducing a new, structured method of production planning and control.
1.2
Company background
The research assignment is performed at Company X. Together with Company Y it forms the XY Group. Company X has been a production company since 19XX with a turnover of XX million euro in 20XX. Company X distinguishes itself as a quality supplier and partner of Original Equipment Manufacturers (OEM). The company has a varied customer base for whom it manufactures housings and frames for automated systems, such as baggage claims at airports, automated sorting systems for logistics operations and assembly systems for material handling.
Production is located at a plant in Location X, where around 100 people are employed. The company does not produce its own products. The products are customer specific, either designed by the customer itself or engineered by Company X’s engineering department. Collaboration is important, from product creation to product realization, logistical support, assembly and maintenance. As such, the company has a diversified product mix, where no product is the same.
1.3
Origin of the problem
Company X operates in a difficult market with a lot of competition. Especially at this time of decreasing repeat business, it is important to attract new customers. Short delivery times at controllable cost are a strong competitive advantage. To this end, the management of Company X has set up a number of objectives:
Decreased internal lead times;
Increased efficiency in fulfilling orders with less Work In Progress (WIP) inventory and reduced unnecessary movement of materials;
Increased effectiveness (increased delivery reliability and quality);
Decreased operational cost.
Because production and planning are closely linked, Company X is looking for someone who is able to take a critical look at the planning process and come up with concrete solutions how the planning department can support the production process. Highly fluctuating demand makes it difficult to match demand with available capacity. Nevertheless, we are looking for a method to control and reduce the internal lead time, and increase the chances of a feasible schedule. Moreover, the intention is to make the planning process more transparent, more understandable and easier. Formulating a clear planning method with broad support throughout the organization, contributing to the achievement of the objectives of Company X.
2
desired to quantify any solutions as well. Subsequently, Company X is able to compare the current situation and any possible solution to assess its impact.
1.3.2 Current planning process
The planning function of Company X can be described by the two different order flow patterns it distinguishes: so-called initial orders and repeat orders. The organization maintains a pull strategy, meaning that no production starts if there is no demand. This does not necessarily precludes building a product before it is due for delivery. In some cases, Company X works with framework contracts and therefore does have some insight into upcoming demand. In these cases it may decide to manufacture some parts upfront, awaiting final assembly. This is called the customer order decoupling point (CODP). After this CODP the manufacturing process is a pull strategy (demand-driven), before the CODP it is a push strategy (forecast-driven).
1.3.3 Software and underlying methods
Company X uses an ERP system from software manufacturer Company Z for its business. The underlying method that is used to generate production schedules is MRP. To produce an article, Company X uses numbered production orders. For every production order, a bill of materials (BOM) is generated specifying required components and materials, a standard routing which dictates the required processing steps and resources and a calculation of required production time. This information has been entered into the system by the engineering department at the time it was an initial order.
The deadline is the day upon which the final product should be ready for shipment to the customer. The overnight run of the MRP proceeds to schedule all steps in the routing and create new production orders for the parts in the BOM. It repeats this until all required parts for the finished product are scheduled. MRP works backwards in time, scheduling processes based on a standard off-set lead time on required resources, against infinite capacity.
1.4
Detailed problem description
Company X has a desire to reduce the lead time of its production orders to five work days. The final objective is to be able to produce 80% of its sales orders within this time. It should be noted that this pertains to internal lead time, from the moment production is started until the time of order expedition. It does not necessarily mean that five work days will become the external lead time with which Company X delivers its product, i.e., it is not the time from order acceptance until order expedition. The lead time of raw materials and other purchase components is still a limiting factor for the external lead time, as is the engineering process for initial orders. This aspect of the lead time falls outside the scope of this research, as this falls under the responsibilities of the purchasing department and engineering department respectively.
To accomplish this objective a number of problems need to be solved. These can roughly be categorized as problems related to knowledge, capacity and culture. These problems will now be discussed in more detail.
1.4.1 Knowledge
3 forecasts is something that ideally would be translated into a sound Master Production Schedule (MPS) and smart parameter settings in an MRP system.
Another problem related to knowledge, is the fact that there is limited knowledge about planning as a function. The organization does not have a clear understanding of what the function and objective of a well-structured planning process is and how it can add value to the business.
1.4.2 Capacity problems
The main problem concerning capacity is related to order intake. When accepting a new order, there is not enough insight into and attention for the impact on current sales orders. The lack of overview results in more accepted work than free capacity to allocate. This manifests itself in different ways and situations.
The departments can be divided into two capacity restrained categories; first category is the manual labor constraint department where capacity is determined by the number of people. The other category is capacity restriction by machine. Each machine has a limited amount of work it can perform in an amount of time. According to the Director of Operations, machine capacity mainly forms the bottleneck for Company X. The foremen of all departments have autonomy and responsibility when it comes to organizing the work force. This means they can exchange workers with other departments when necessary but also hire temporary workers if needed. This should mean that manual labor capacity should not have to be an issue. That being said, asking around to verify turned up some issues in practice. First of all, qualified replacement is not readily available for some functions. For instance when it comes to programming the machines at the sheet metal center, for this type of work a skilled programmer is required. Secondly, it is difficult for the departments to predict when a peak in workload is coming due to uncertainty in demand. In reality, it is not always possible to organize extra labor in reaction to an upcoming capacity shortage.
Furthermore, the notion that Company X only manufactures on demand leads to a false idea that forecasts can be omitted as a restricting factor in the capacity allocation. This is problematic, as some customers have framework contracts with forecasts. As such, Company X has forecasts for the required amount of capacity to manufacture these items. This reserved capacity cannot be allocated to another customer without considering the consequences. However, this is what happens in the current situation where forecasted production capacity is ignored in favor of another customer.
The added difficulty in the planning process is the fact that a denied delivery date is not perceived to be a real option, especially for some of the (potentially) important, high revenue customers. These orders need to be fulfilled in a short amount of time, which causes disruptions in the production process. A strong desire from management is to look for possibilities to be flexible in capacity. This flexibility most likely comes down to adding extra machines as it is believed these form the most important bottleneck as previously stated.
In practice, the manufacturing activities are often not performed as planned. Sometimes because of unforeseen circumstances, sometimes due to unbalanced workload. Fact of the matter is that too often scheduled production planning is not feasible or is disturbed by short notice developments.
1.4.3 Cultural problems
4
moved in time in the system, a process the planner performs. It could be argued that this formation of forecast to sales order is a process the sales department should monitor, thereby freeing up the time for the planner to perform more value-adding tasks. A different problem occurs when the customer does call upon the forecasted order, however in a different quantity than agreed upon. Within ERP a minimal lot size is often required when starting a production, cost price of the item is based on this lot size. If the planner decides to overrule the system and start production for an actual smaller demand, economies of scale are partially lost, the actual cost price will be higher and the margin will decrease. This causes friction with the pre-production department, responsible for the pricing. To counteract this, the sales department uses graduated prices (Dutch: Staffelprijzen). On the other hand, if the planner decides to respect the lot size, a part of the items could end up in inventory. This contradicts the objective of Company X to manufacture on demand according to the Lean philosophy1.
A second cultural problem stems from the imagined flexibility in production capacity. This method to cope with fluctuating capacity demand is perceived to require no further control policy. The first manifestation of this lack of control occurs when an increased workload calls upon the deployment of the flexibility. Temporarily ramping up production or solving backorders requires the foremen to actively communicate with one another in order to use excess capacity from departments. The foremen have the responsibility to do so but the feeling is that not all foremen are equally assertive. Conversations with the production employees on the other hand, point out that the support for this is perhaps insufficient. This lack of support is related to the second manifestation of the lack of control.
In the past, flexible teams have been attempted, workers have been trained in various processes besides their own. After these trainings, however, the workers predominantly worked in their original department on familiar processes, most likely because lack of control has not urged them to maintain the newly acquired skills. Furthermore, without proper control the skill sets of the individual employees have not been formally documented. This makes it difficult for the foremen to know where to acquire the additional capacity required to finish the work, or guarantee the quality of output.
Lastly, because of the management choice to monitor and actively pursue machine efficiency, production employees believe that idle machines should be avoided. This focus on machine efficiency (contradicting demand-driven production) counteracts interchanges between departments as it would cause efficiency to drop when an employee supports another department. Subsequently, one machine could be working ahead of schedule while others are behind.
1.5
Research question
Based on the problems which have been discussed in the previous paragraphs, the main research question of this thesis is:
“How could the planning function at Company X be improved so as to support the company’s objective of controlling and reducing internal lead time?”
A number of sub questions have been devised to analyze the main problem in a more structured and detailed manner:
1. What has been written in academic literature regarding the problems facing Company X?
1
5 a. Can we explain and predict lead times?
b. Which problems related to ERP/MRP and capacity management are known? c. What are well-known problems related to ERP and Lean (pull strategies in general)? d. What is the objective of a well-defined planning function?
e. What should a structured planning function look like?
2. What does the production process look like and what is the current performance?
a. How is the production process structured and what do the production departments look like?
b. What is the current performance of the departments and Company X in general, and how is performance measured?
c. Which performance problems and production characteristics form the largest obstruction towards completing Company X’s objectives?
3. How could Company X implement an approach to control and reduce lead time? 4. How could Company X structure its planning function?
1.6
Research scope
This research focuses on the planning function itself by clearly defining its objective and added value to the overall performance of the company, and how it can be improved by devising a structured approach. Thereby supporting Company X’s objectives as were introduced in the origin of the problem (section 1.3).
1.6.1 Inclusions
Firstly, a part of Company X’s production process consists of outsourcing. To be able to control the throughput time of an order, outsourcing must be considered in the planning process. These production steps and their influence will be taken into account. Secondly, order intake has a significant influence on capacity and occupation of the resources and is a source of variability. To be able to create a realistic, feasible production schedule, it is necessary to take order intake into account in this research. Thirdly, for new projects and products the processing steps and times are often not known with certainty. This also has a strong influence on the planning process and its ability to generate feasible schedules. Therefore project and manufacturing preparation will be taken into account in this research.
1.6.2 Exclusions
Decisions regarding processing steps to outsource and where to outsource them, will not be included, as is the purchasing of raw materials and the logistics of distributing the final product to Company X’s customers. Due to time constraints, the implementation of the solution falls outside the scope of this thesis as well.
1.7
Deliverables
Report – a detailed study and analysis of the problem
Solution method – a description of the possible solution and adaptation to fit Company X
Proof of concept – a simulation model to test the solution
Planning framework – a structured function, describing what the objective of production planning is and how decisions should be made
1.8
Approach
6
and multiple sub questions. A literature review is conducted to construct a framework of academic background information regarding the production planning and control problems facing Company X. We continue with a detailed description and analysis of the current production process and performance. With the information from the literature research and analysis of Company X, we focus ourselves on the direction of a solution and adapt it to fit the characteristics of Company X. A simulation study is used to prove the benefits of the solution approach.
1.9
Structure of the report
7
2.
Theoretical framework
This chapter answers the first research question, “What has been written in academic literature regarding the problems facing Company X?”. Throughout meetings with various people within the organization several topics of interest have come up pertaining to manufacturing methods in relationship with a controlled planning method and the problems that arise when the business strategy and manufacturing concepts are misaligned. These topics are:
Explaining or predicting lead time and the occurrence of waiting time;
Shortcomings of ERP/MRP systems;
ERP in combination with Lean;
Pull vs. Push and hybrid approaches;
Structured planning.
This chapter presents a literature study in which these topics have been researched. Section 2.1 is a review of lead time control and prediction. Sections 2.2 through 2.4 are focused on planning and control approaches. The process is aimed at identifying opportunities and problems in scientific research and connect this to the practical situation at Company X. The objective is to find either common ground or gaps between science and practice. This common ground, or lack thereof, may serve as a basis to start looking for solutions. Section 2.6 is the last section of this chapter and addresses the theory behind a structured and well-defined planning function.
2.1
Lead times
Before any analysis can be carried out, the definition of lead time and waiting time is clearly stated here. We define the lead time of any production order as the time elapsed between the moment at which the order becomes available to be processed and the moment at which the order is completed. This time period includes actual time spent working on the product, as well as time spent waiting before capacity is available for processing. Waiting time is therefore defined as the time elapsed between the moment an order becomes available to be processed and the time processing is started. Waiting time usually accounts for a large portion of the total manufacturing lead time, estimates vary between 70 and 80% (Subba Rao, 1992) and it is therefore most interesting to understand how waiting time can best be decreased by understanding the characteristics of the business process which cause it to originate. Research has found a relationship between characteristics of manufacturing, lead times and the production performance. Chin (2009) and Subba Rao (1992) both apply queueing theory to explain the causes of waiting time.
Subba Rao (1992) explicitly mentions capacity planning and control as an area of the manufacturing process where queueing theory can be used to gain an understanding. The manufacturing process consists of a number of work centers (machines, departments) where work is performed. At each center, work arrives from the previous work center, and after processing is completed it moves on to the next. The simplest example is an assembly line, such as the one shown in Figure 2.1. Jobs arrive at station 1 for the first process step and move through the system to be finished at station N. Each station has a queue where products are allowed to be stored.
3 2
8
Figure 2.1: Example of a typical, simple assembly line process flow
This assembly system can be expressed as a serial system of work centers, expressed in terms of Kendall’s notation, using three factors; A/S/c. A denotes the arrival process, S describes the service (processing) time and c is the number of servers at each work center (Winston, 2004). In the case of most manufacturing environments (and Company X is no exception) the arrival and service process do not follow any of the well-known and regularly used distribution functions. Therefore a general distribution (G) is used, such that the work center is expressed as a G/G/1 queuing model (for sake of simplicity the assumption is that each work center has one resource).
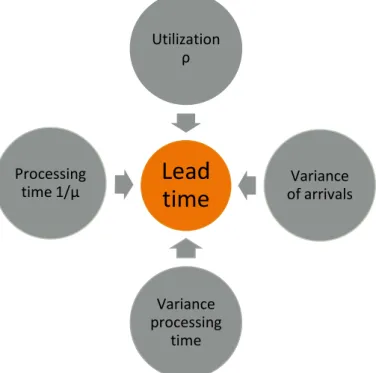
From queuing theory it is known that waiting times are influenced by three factors; variability (V), utilization or traffic intensity (U) and process time (T). The following formula known as Kingman’s formula is used to explain and predict the occurring waiting time in a steady-state G/G/1 system with a first come first serve (FCFS) priority:
Ca is the coefficient of variation in the inter-arrival time, Cs is the coefficient of variation in process
time, ρ is the utilization and 1/µ is the average processing time. Utilization (ρ), also known as the traffic intensity, is the ratio , where λ is the number of arriving orders per unit of time and µ is the number of processed orders per unit of time. The term U predicts the average number of orders in queue and shows that if approaches 1, this mean explodes (increases towards infinity). It is important to realize that these relationships are based on averages, an instantaneous arrival rate may exceed the service rate. Production orders will back up in queue, but as long as the arrival rate decreases afterwards the queue will not explode. On average however, the service rate must always exceed the arrival rate to avoid the system from overflowing.
The relationship V x U x T shows that the occurrence and magnitude of waiting time can be explained and influenced by analyzing and improving the parameters mentioned:
Decreasing variability;
Decreasing ρ;
Decreasing 1/µ (or conversely increase µ, the number of orders processed).
Shorter lead times can be attained by investigating the root causes that degrade each factor (Chin, 2009).
For most manufacturing organizations, the simple line assembly representation is not suitable. The process is better described as the network of diverging (station 1) and converging (station N) product flows in Figure 2.2. This complicates the situation somewhat, but for an organization manufacturing its own products queuing theory might still be directly applied by modeling it as a series of queues. The products, their structures and routings are deterministic (demand could be variable). As such the diverging and converging points in the network are known, and the proceeding station for each component is known. Therefore the arrival process for station N
9
Figure 2.2: Example of a typical job shop environment
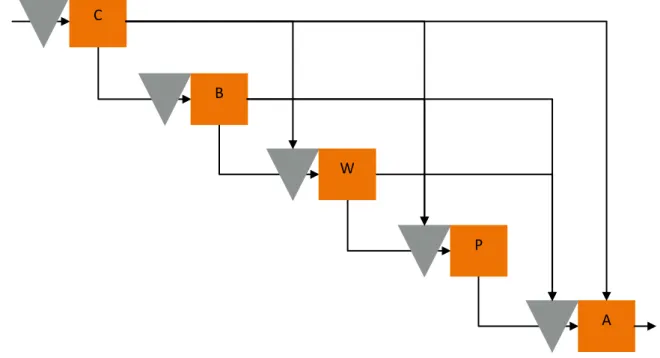
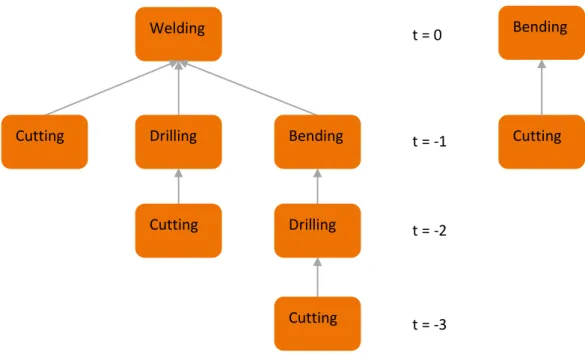
The fact that Company X is an MTO/ETO business, means that each product is different than the other in some way or another. Therefore it is unsure where any diverging and converging processing steps are, if any, and which ratio of the total output of a work center proceeds to the next (Figure 2.3). For instance, after being cut out of sheet metal, the components may go to any of the other departments in any kind of ratio. For initial products none of these relationships are known in advance. As such, the traffic pattern is complicated and uncertain. The situation at Company X can therefore not be modeled as a system of queues directly. The effects of variability, utilization and processing time should still apply though and therefore these are analyzed in the next section, because controlling WIP, assigning priorities and varying capacity over work centers could improve manufacturing efficiency (Subba Rao, 1992).
Figure 2.3: Order flow at Company X (C=Cutting, B=Bending, W=Welding, P=Painting, A=Assembling)
2.2
Shortcomings of Enterprise Resource Planning systems
2.2.1. The system
In short, an Enterprise Resource Planning (ERP) system is a (usually) commercial software package that enables the integration of transactions oriented data and processes throughout an organization (Markus, Axline, Petrie, & Tanis, 2000). In most cases, the ERP system works with Materials Requirement Planning (MRP) as its planning system. MRP is designed to translate predetermined demand or sales orders for finished products into a manufacturing schedule: which
C
B
P
A W
Station N Station 2
Station 1
2/3μ1 μ2
1/3μ1
μN
10
materials are required, when are they required and how many are required (Murthy & Ma, 1991). The four major inputs for the system are:
1. The Master Production Schedule (MPS);
2. The product structure called Bill of Materials (BOM); 3. The resource requirements;
4. The inventory status.
Orders for finished products are obtained from the MPS; the required quantity and delivery dates for different products. By working through the levels of the product structures using the BOM, the finished product is divided into a hierarchy of required subassemblies, components and materials. All the requirements to meet the orders (several finished products might use the same component) are then aggregated into gross requirements in each time period. Using information about current inventory and work in progress, the MRP system computes the net requirements. The requirements are then offset in time to establish the dates by which actions (manufacturing or purchasing) must be initiated such that the components and subassemblies are timely available at different stages of manufacturing and the orders for finished products are met by the times specified in the MPS (Murthy & Ma, 1991).
ERP merely extends the system architecture of MRP with other business functions, without adding actual intelligent planning (Zijm, 1999). Otherwise put, an ERP system is mainly designed for transaction bookkeeping purposes. In its original intent it is good at monitoring events and bookkeeping trails of the events, but it is not meant to help the decision-making process (Moon & Phatak, 2005).
2.2.2 The problems
The previous section explained the basic principle behind MRP. It is this apparent procedural simplicity that makes MRP such a widely used system (Zijm, 1999). For some criteria it indeed outperforms other methods (e.g. the ability of order tracking and a high product variety), making it the best choice (Plenert, (1999)). However, a closer look reveals a number of issues. These can be divided into modeling errors (or wrongful assumptions), parameter errors and flexibility.
Before the MRP system works properly, the modeling of the real world situation and its underlying assumptions must be met (Euwe & Wortmann, 1997; Moon & Phatak, 2005; Zijm, 1999). Two of the most important assumptions are usually not met in reality; a deterministic character of the business processes (Moon & Phatak, 2005; Zijm, 1999) and an infinite production capacity (Bott & Ritzman, 1983; Euwe & Wortmann, 1997; Zijm, 1999). Simultaneous workplace occupation is often not considered when multiple orders require the same resource (Moon & Phatak, 2005).
11 Various FCS tools have become extremely popular enhancements to the MRP process, but they present a new challenge. MRP needs to be running correctly and efficiently for these tools to be effective since they add another layer of complexity to the process (Plenert, (1999)).
Lastly, flexibility is a problem encountered in the literature. Euwe and Wortman (1997) describe a lack of alternative plans. Planners have several scenarios, e.g., lot splitting, subcontracting, overwork and such. This is not modeled in MRP, it generates only one plan. Nor does MRP generate alternative production schedules in case some materials or parts do not become available as planned (wrong quantities, inferior quality, machine break-down) (Moon & Phatak, 2005; Zijm, 1999). Moreover, Zijm (1999) points out that the system is inflexible in make-to-order organizations, requiring a rather detailed knowledge about which resources, materials and parts are needed when accepting customer orders. In this type of organization these conditions are often not fulfilled. Plenert (1999) claims MRP is in fact flexible in comparison with Just in Time (JIT) or Optimized Production Technology (OPT). First of all, because MRP handles multiple products. Second of all, scheduling flexibility allows a variety of products to be scheduled via any number of routings (Plenert, (1999)). The lack of explanation of Plenert (1999) leaves room for discussion about what this flexibility is or how it can be used to our advantage. MRP does not necessarily allocate lower level production to higher level assemblies, meaning that an assembly order is free to pull an item from any production routing that makes the required item available. This is after the fact however, when a part did not become available through its usual routing. Another interpretation could be about scheduling flexibility, considering multiple alternative routings beforehand. However, he offers no insight if programming multiple routings offers the planner a decision, or if MRP is able to make an intelligent decision on its own.
2.3
ERP and Lean manufacturing
In 20XX, Company X has started a Lean transformation and implementation. Based on the early impression of characteristics of Company X a decision to introduce Lean does not seem to be obvious. This section is meant to find the differences and similarities between Lean and ERP (applied at Company X).
In 1977, Sugimori et al published the first English paper on the Toyota Production System (TPS), a major precursor of the Lean philosophy. In their paper they are critical towards complicated IT systems as a means of organizing production logistics. It introduces unnecessary cost, over-production and uncertainty (in Riezebos, Klinkenberg, & Hicks, 2009). At the same time, in the Western industrialized world, IT and advanced automation were seen as the way to gain competitive advantage (Riezebos et al, 2009). One of the main contradictions is centralized (ERP) and decentralized (Lean) planning (Powell, Alfnes, Strandhagen, & Dreyer, 2012; Riezebos et al, 2009). According to Huoy (2005) Lean authors also advocate decentralized information processing and communication. Furthermore, combining the two was something that until recently seemed inappropriate because of the inherent contradiction between the push strategy of ERP (unlimited workload) and the pull strategy of Lean (limited workload) (Olhager & Östlund, 1990; Riezebos et al, 2009). The pull strategy pursuing ‘zero inventory’, uncovering any production problems or inefficiencies and solving them. The push strategy pursuing ‘zero risk’, being independent of production in case of product defects and machine break-downs (Villa & Watanabe, 1993). Needless to say, these two approaches have been regarded as incompatible for a long time. As a result, extensive information can be found in literature about either ERP implementation or Lean implementation, but applying both has not been well-documented.
12
Strandhagen, & Dreyer, 2013). Powell et al (2012) have performed a literature review where they have identified 15 areas where a well-configured ERP system could support Lean, see Table 2.1. These are evaluated through the usage of the fundamental principles of Lean identified by Womack and Jones (1996); value, value stream, flow, pull and perfection (in Powell et al, 2012).
Table 2.1: 15 points for ERP to support Lean (source: Powell et al, 2012)
No Principle An ERP system for Lean should:
1 Value Support customer relationship management
2 Automate necessary non-value adding activities (e.g. back flushing) 3 Value
stream
Enable process-modeling to support standard work processes
4 Provide a source for easy-to-find product drawings and standard work instructions
5 Support information sharing across the supply chain
6 Flow Create synchronized and streamlined data flow (internal & external) 7 Support line balancing
8 Support demand leveling
9 Support orderless rate-based planning (e.g. takt-time) 10 Provide decision support for shop floor decision making 11 Pull Support Kanban control
12 Support production leveling (Heijunka) 13 Support JIT procurement
14 Perfection Provide a system to support root-cause analysis and for the logging and follow-up of quality problems
15 Provide highly visual and transparent operational measures (e.g. real time status against plan)
This extensive list of elements applies to the situation where the character of the production is equal to the traditional Lean assumption: high-volume production of low-variability products. For typical make-to-order and engineer-to-order organizations these assumptions are quite the opposite: high-variability products, manufactured in low volumes. Neither the TPS nor the pure takt-time control principle is deemed appropriate (Portioli-Staudacher & Tandardini, 2012; Slomp, Bokhorst, & Germs, 2009).
13
It is not difficult to see that in case of high-variability production rates (typical for high-variability products), this equation becomes rather unstable and therefore useless. The number of required Kanbans would continuously change. Lean, through its philosophy, lacks the ability to manage a high-variability environment and related information complexity. If an organization wishes to implement Lean in such an environment, ERP is an essential system to manage the large quantities of information.
2.4
Push vs. pull and hybrid approaches
We have seen that MRP and Lean, or push and pull in general could go together. Villa and Watanabe (1993) claim they are in fact complementary and several researches have shown that hybrid approaches outperform pure push or pull strategies. Wang and Xu (1997) for example, simulate a 45-stage production system and compare several (hybrid) control strategies. They present four manufacturing systems; (i) single-material, serial process (ii) multi-material, serial process (iii) multi-part process and assembly system (iv) multi-part multi-component process and assembly system. The results indicate that the recommended hybrid push-pull strategy results in lower average cost. (It should be noted that the experimental set-up simulates a demand for just one product.)
2.4.1 Typology
We use the distinction made by Corry and Kozan (2004) to make a typology for push-pull hybrid approaches. At the end of this section we conclude whether or not the approaches treated here are applicable for Company X. Corry and Kozan (2004) separate push-pull integrations in vertical and horizontal ones. Vertical being a different policy at different levels of planning, i.e., MRP plant-wide and Kanban between work centers. Horizontally applies push for some work centers and pull for the remaining. Gerathy and Heavey (2005) call them vertically integrated hybrid systems (VIHS) and horizontally integrated hybrid systems (HIHS). HIHS are more widely applied, of which Wang and Xu (1997) is an example.
Olhager and Östlund (1990) distinguish horizontal push-pull integration based on three different concepts: (i) CODP (ii) bottleneck resource and (iii) product structure. CODP is the point at which a product becomes customer specific. In other words, it is the point at which the value added to the product is customer specific. From this point of view, it is a logic boundary between push and pull. Every process step before the CODP is pushed through the system based on forecast, these are usually generic parts and subassemblies. Because the value is added mostly after the CODP, production afterwards is demand driven (pulled).
14
considerably more complex when there are multiple or moving bottlenecks (Olhager & Östlund, 1990).
The third and final concept Olhager and Östlund (1990) mention is a push-pull boundary based on the product structure. Products with more complex BOMs usually have a distinguishable path that is more critical than others in terms of lead time. This concept states that the critical path components are pushed through the organization up until the point of convergence, i.e., assembly. Meanwhile the required uncritical components needed are pulled along. The capacity of the critical path serves as the restrictive factor.
The horizontal push-pull integrations all have some fundamental problem for application at Company X. Integration based on CODP and product structure seems to be less promising because all products are customer specific. The CODP is in the engineering phase. There are very few, if any, common parts that could be controlled with a push strategy. A push-pull boundary based on the complex BOM products also seems unlikely. For Company X the product mix changes rapidly. This means that we would continuously be redefining which BOMs are categorized as complex and which components determine critical paths to be pushed and which components to pull along. A horizontal push-pull integration based on a bottleneck is an interesting approach when a bottleneck resource will not change. We cannot state with certainty that a bottleneck at Company X will remain the bottleneck over time. For instance, if the product mix changes, capacity requirement for another processing step could cause a shift.
The VIHS is only limitedly applied in practice. Karmarkar (1986) introduced a hybrid approach based on the vertical integration. MRP controls the overall production facility, where component requirements are calculated based on the MPS. Production cells use Kanban as control strategy, the number of Kanbans is based on the MRP information. Furthermore, because MRP works with off-set lead times based on averages lead time, they tend to be inflated. Therefore cell supervisors get control over the number of active Kanban cards on the floor, releasing them only when appropriate. Karmarkar (1986) notes that this system is most appropriate for repetitive batch manufacturing and not appropriate for a customer order oriented system. Kanban cards are not suitable to identify and allocate parts to a specific order. This VIHS is therefore not suitable for Company X. A promising vertically integrated approach is called POLCA, it is designed specifically for manufacturers of a highly variable product mix with small batches. It is introduced in the next section.
2.4.2 POLCA
15 next work station. We let the department pull work its way when it can handle it, thereby avoiding unnecessary waiting time.
The concept of signaling capacity availability and triggering the right production order to be processed is controlled using capacity control loops. Within a loop between two production cells, a number of polca cards circulate. If and only if a polca card is available to accompany a production order is it allowed to enter the queue of the department. These control loops are actually based on queuing theory, limiting the amount of WIP to make sure that the lead time does not increase.
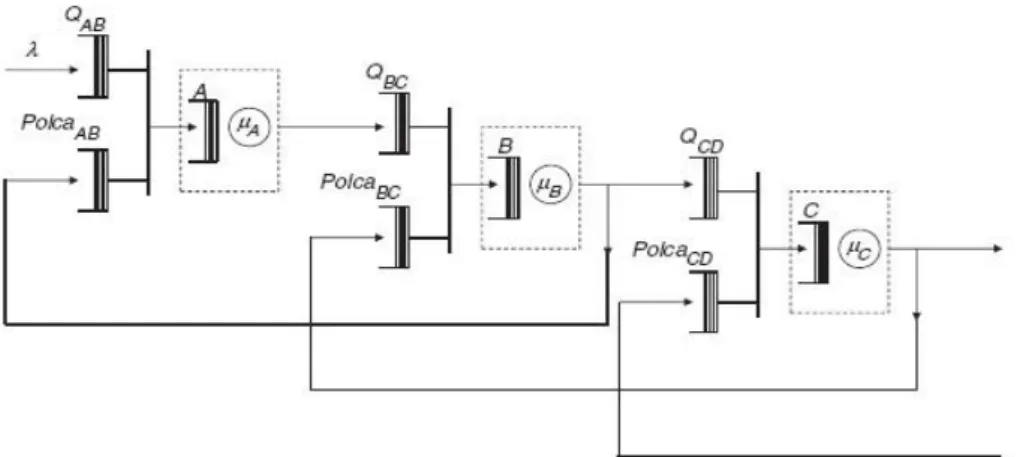
Each production cell is in at least two loops, one with its immediate predecessor and one with its immediate successor (Figure 2.4). The first and final processing step in a routing are the exception. When a production order is supposed to be processed in cell A, then B, it requires a
polcaAB card (Figure 2.5). An absence of this card at cell A tells us that cell B does not have available
capacity in the near future and the order remains in queue QAB. As soon as a production order leaves
production cell B, its polcaAB is removed and transported back to cell A to signal available capacity.
Because the lead time is waiting time and processing time, we only send it back after the processing is finished. Any order authorized to be processed by a production cell within two loops, requires two
polca cards. Production orders waiting in QBC for instance, still have polcaAB and also require polcaBC.
Figure 2.4: Example of paired production cells
Intermediate authorizations can be incorporated as well, Vandaele et al (2008) specifically mention that assembly systems can benefit from this feature. The dynamic and changing situation which occurs when multiple components are required to arrive at the assembling cell in synchronicity, can benefit from extra control.
The objective of POLCA is balancing the workload of each production cell. To avoid overloading with WIP and as a result an increased lead time. The amount of cards NA/B in circulation
is calculated based on a modification of Little’s Law (Krishnamurthy & Suri, 2009):
Where LAand LBare the estimated average lead time during planning period D, W in Little’s Law.
NUMA,B is the total number of jobs which go from cell A to B during this same period, λ in Little’s Law.
The total number of cards in the loop is the total number of customers in the system L in Little’s Law. The basis of the POLCA material control system is therefore queuing theory. By limiting the number of customers in the system with the use of polca cards, we implicitly limit the utilization of a production cell. Utilization between 30 and 80% performs best according to Riezebos (Polca scanningtool). Lower than 30% leads to underutilization, while more than 80% leads to congestion.
Table 2.2 shows an overview of different case studies and the reduction in lead time which is achieved. Based on these results, we expect that the concept of POLCA can definitely contribute to the objective of Company X to reduce internal lead time.
16
2.5
Structured planning
Every manufacturer offers a product to its customer and in order to deliver, it relies on resources with a limited capacity. Furthermore, it is likely to offer multiple products to multiple customers simultaneously. A complex flow of information and materials originates. The production planning and control function of an organization is burdened with the task of managing this flow, looking for a balance between timely delivery and cost efficient use of the required resources. The objective would be a planning procedure which enables this balanced work flow, in a such a way that the products are delivered on time at a profitable price, while the process of planning itself is efficient as well. Ultimately, the objective for planning and control is to contribute to the main business objective to achieve long-term profitability. This is a large, complex problem and to structure this a hierarchical planning framework can be applied.
Figure 2.5: Example of POLCA control loops (Riezebos, 2010)
Table 2.2: Lead time reduction based on case studies
Case study Lead time reduction Author(s)
Bosch Hinges 70% (Riezebos,2010)
Spicer 50%-60% (Vandaele et al, 2008)
Olsen Engineering 22%-68% (Krishnamurthy & Suri, 2009)
Rockwell Automation 25% (Krishnamurthy & Suri, 2009)
17 between the various levels is strategic, tactical and operational (Hans, Herroelen, Leus, & Wullink, 2007; Liberatore & Miller, 1985).
2.5.1 Strategic
At a strategic level, the planning horizon is long term (usually a few years). This level includes decision related to the market, such as what product mix to manufacture. It also includes long term investments, such as the location of manufacturing facilities and the purchase of machines and hiring employees (Hans, Resource loading by Branch-and-Price Techniques (ch.1 of Ph.D. thesis), 2001). Furthermore decisions related to the logistic concept and manufacturing controls, i.e., make-to-stock, dedicated production lines etc.
2.5.2 Tactical
At this level, decisions are made regarding the MPS given the available resources (the strategic decisions impose restrictions), thereby creating a balanced workload. The tactical level has a medium term planning horizon usually up to a year, but the exact planning horizon and time buckets should be chosen to match accurate and useful (aggregated) data. If accurate and useful data about forecasts does not extend six months, efforts to control beyond this point would be a waste. Furthermore, detailed information about actual processing times is generally not available. Therefore detailed daily planning would also be a waste of effort. Planning in time buckets of a week would be more appropriate. This process, often referred to as Rough Cut Capacity Planning (RCCP) (Hans et al, 2007; Jonsson & Matsson, 2002; Tenhiälä, 2011), aims at minimizing the total throughput time of all orders given the available resources and respecting the delivery dates. The process includes order intake as well. Many organizations have a tendency to accept as many orders as they can possibly acquire. In the process, organizations promise a delivery date that is as early as possible, without sufficiently assessing the impact on resource capacity. This may lead to serious overload of resources, having a devastating effect on the delivery performance and the profitability of the production system as a whole (Hans et al, 2007). Through the process of an RCCP, we create a capacitated MPS; forecast and sales orders are input, required resources over (aggregated) work centers [departments] are considered, finalized due dates are given (Frank, Neumann, & Schwindt, 1997). Capacity is still somewhat flexible at this level, the planning horizon is long enough to detect shortages and temporarily increase it. A good RCCP leads to improved schedules at an operational level (Hans, Resource loading by Branch-and-Price Techniques (ch.1 of Ph.D. thesis), 2001).
2.5.3 Operational
At this stage we know which orders have been accepted and therefore must be manufactured before a certain due date (a capacitated MPS forms the constraints for the operational planning). Furthermore, at this stage we know precisely which manufacturing processing steps are required (BOM) and we have a more accurate estimation of the required capacity (processing time). At this point the planning horizon is further decreased to short-term, e.g., a week. The challenge is to create a daily production schedule where all jobs are assigned to a work center, minimizing the total throughput time of all jobs within the planning horizon.
18
2.5.4 Integration
Moscoso et al (2010) are critical towards hierarchical, decentralized (insufficiently integrated) planning, stating it causes instability in the production plans. The causes of the instability, MRP nervousness and the lead time syndrome (see section 2.2.2). They have combined the two under the denominator ‘planning bullwhip’, after its better-known sibling in supply chain management. The supply chain bullwhip effect is an increasing level of variability in demand, going upstream in the supply chain. The effect is caused by decentralized demand information and optimization of subproblems rather than taking end-user demand into account. This causes suboptimization in the supply chain, because each level considers a different scope. While the supply chain bullwhip propagates horizontally along the supply chain, the effects of the planning bullwhip propagate vertically along planning hierarchies, both top-down as well as bottom-up, (sub)optimizing a planning subproblem. For example, an ETO/MTO organization must adhere to the delivery dates previously agreed upon. This could mean smaller lot sizes and quicker product change-over than desired from a strictly machine efficiency point-of-view. However, detailed scheduling based on machine efficiency at the cost of missed delivery dates would be highly undesirable and damaging to the continuity of the organization.
As the example demonstrates, consistency between objectives is a problem between planning levels because objectives potentially conflict. It is not enough to have a good aggregate planning procedure and a good detailed planning procedure, they should be carefully integrated. This integration enforces consistency in the prioritization of objectives when decisions are made at different levels (Gelders & Van Wassenhoven, 1982). Hierarchical planning activities must be integrated to ensure coordination between production levels. Decisions must be consistent to avoid sub optimization (Liberatore & Miller, 1985). When making a trade-off, one should keep the objectives of earlier decisions in mind.
2.6
Summary
For an ETO/MTO organization like Company X, both a pure push (MRP) or pull (Lean) approach causes problems. MRP is too much of a deterministic, inflexible approach. The resulting production schedules are likely to be infeasible because the reality is too variable. At the same time, the flexibility that a successful ETO/MTO organization should inherently have, i.e., consider alternative solutions such as outsourcing and overwork, are not supported in MRP. On the other hand, Lean lacks the ability to manage the highly variable product and demand behavior and complex information associated with it. This is one of the strong points of MRP. MRP and Lean strategies have conflicting objectives, making it difficult to combine them. MRP is a centralized control system where machine efficiency is a leading objective. Independency of production problems in case of product defects or machine break-down, “zero-risk” through enough WIP. Lean is a decentralized control system where WIP and lead time reduction is a leading objective. “Zero-inventory” to uncover production problems and inefficiencies to be solved. A promising alternative for a vertically integrated approach is POLCA, as it is designed to deal with the variability of ETO/MTO organizations. The method focuses on product-anonymous capacity availability. Several case studies show lead time reduction between 22 and 70%.
19 integration is the most important to make it successful. This integration refers to the different levels and their objectives, as well as planning as a function. The function must be embedded within the organization and processes should be integrated with the other functionalities. To make the planning function easier to understand and create more support, we can focus on the level at which planning and an employee’s activities intersect.
21
3.
Production process and performance analysis
This chapter answers the second research question, “What does the production process look like and what is the current performance like?” Firstly, in section 3.2 the production process is described in detail. Section 3.3 discusses the current performance overall and of the specific departments. In section 3.4 and 3.5 we try to understand which factors influence the lead time performance and how it might be controlled. Finally in section 3.6 we combine the literature review and analysis of the current situation and draw our conclusions.
The data that is used to analyze the current performance of Company X has been collected between January 2014 and March 2015. The data used for the analysis is collected by Company X itself. Processing times of production orders are registered using hand-held scanners connected to the ERP system. The clocked times are imported in a business intelligence package (Qlick View) and made available for this analysis.
3.1
Manufacturing system typology
A manufacturer can be described using a manufacturing system typology along two dimensions. A distinction can be made between different logistic product/market combinations and based on the internal structure of the organization (Zijm, 1999). In the case of Company X the product/market dimension is a combination of make-to-order (MTO) and engineer-to-order (ETO).
MTO organizations produce based on demand of the customer, as opposed to production for inventory to be sold at a later date (make-to-stock (MTS)). Engineer-to-order is characterized by a manufacturing process, starting at the design phase. In such a case, the finished product is engineered according to the customer’s (technical) requirements. Company X both co-engineers products with the customer and manufactures products for which the design is supplied by the customer.
The internal manufacturing structure is based on the job shop. Company X has several departments in which combinations of man and machine are able to perform a manufacturing process. The factory layout is functional, the equipment is arranged by function such that all similar operations are performed in one area of the plant (Carlsson, 1989), a so-called department. All products move through the factory and the predefined routing in the ERP system determines which processing steps are required and upon which machines they are performed. These departments are:
Cutting (sheet metal center)
Bending (pressing, punching, drilling)
Welding
Painting (powder coating)
Assembling
(The first department is Engineering and Pre-production, but because these departments are not included in the scope of this thesis they are omitted here.)
3.2
Production process
22
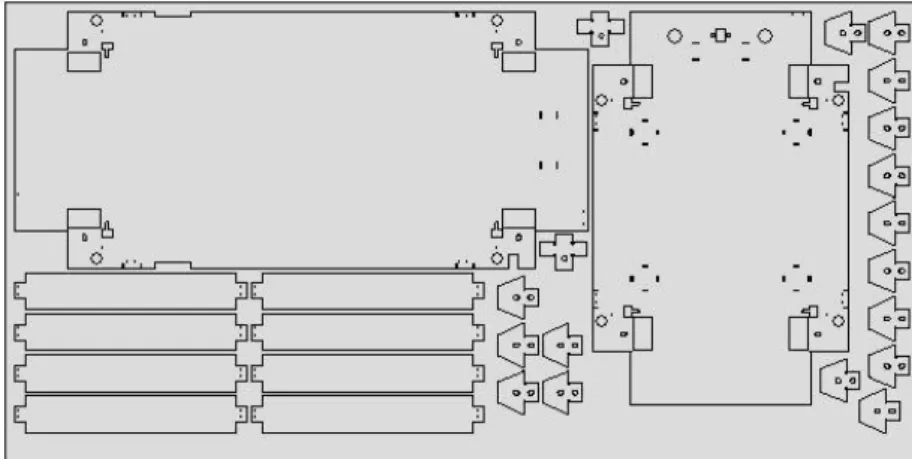
devising the routing for the product and calculating the required processing time for each processing step. These are important input variables for a solid planning. If the product is designed and released by the engineering department, the products move on to the programming department of the sheet metal center. For the initial order, the parts are programmed to be cut out of sheet metal. For first time repeat orders a new concept has been introduced: the programmers perform a process which is called “nesting” of the product (Figure 3.7). The final product is made out of different components, possibly from differing materials. All components of the same raw material are combined into a nest in a way to use the material as efficiently as possible, i.e., with minimum waste of raw material. The nests contain the amount of components required to produce an amount of finished products that fits within the standard shipping container of the particular product. The idea here is that a customer can order a multiple of the shipping quantity, and the cutting department simply cuts the required amount of nests to build the final number. It should be noted that this does not always work out as planned in practice. Some customers, especially some of the bigger companies, are not always willing to comply with this set-up. The distinction between initial orders and repeat orders is based on the fact that nesting requires an extra process for the programmers. For a first and presumed last time production, this extra effort is not worth it. Furthermore, not all products are transformed into nests just yet. If the order is a repeat order, the engineering and programming steps are omitted (with the exception of a first time repeat where a nest could be required). The rest of the processing steps remain the same.
Figure 3.6: Schematic of all processing steps related to manufacturing
Figure 3.7: Example of a nest
Engineering Nesting
(programming) Cutting
Bending Welding
Surface treatment (outsourced)
23
3.2.1 Cutting department
At the cutting department, all parts required to manufacture a finished product are cut out of sheet metal, with the exception of purchase parts. The department uses a CNC laser cutter. The capacity for this department is mainly limited by the machine. The department works two shifts a day, six days a week. The machine can work autonomously, it is combined with a storage facility equipped with an automatic storage and retrieval system for raw materials and parts which have been cut. The cutting department is the only autonomous system, able to function without the (constant) presence of an operator.
3.2.2 Bending department
After being cut from the sheet metal, the parts go to the bending department where an individual order might follow different routings through various processing steps. These routings may include any of the following steps: bending, drilling, punching, deburring. In a typical routing, the sheet metal part is bent into a certain shape (a profile) using a press brake. A punch press provides any necessary recesses and a drill is used to create drill holes for assembly. Afterwards, the parts are deburred to get rid of sharp edges and such.
The department uses robot press brakes which operate autonomously. The department has manual press brakes as well, which are man operated, and several smaller pieces of equipment such as punch presses and drills, all of which are manually operated. 12 people are employed at this department, the capacity of this department is mainly limited by manpower.
3.2.3 Welding department
The welding department is the first converging process step, where multiple parts are combined into a subassembly. The department is divided into two separate ones, welding and stainless steel welding. This is to avoid contamination of the stainless steel with small metal particles. The department employs 18 people and has one welding robot. Capacity is limited by manpower. The welding robot is only useful when there are larger batches of relatively simple products, i.e., no corners which are hard to reach for the robot. Furthermore, it requires the presence of an operator and must be programmed.
3.2.4 Painting department
The painting department has one paint booth where products are powder coated. Before the products can be coated, the welds first need to be sanded to create a smooth surface. The department employs seven people. At this department the booth is the limiting factor on capacity. After the painting process is finished, extra manual labor can be beneficial though. To finish the process the painted parts need to dry hanging. This process can be sped up with more manpower, thereby freeing up the paint booth for a new product. Seven people are permanently employed at the department.
3.2.5 Assembling department
The assembling department is the second converging step in the process, where all subassemblies are assembled into a final product. This department is limited in capacity by manpower. It employs 10 people.