Centre for the Study of Globalisation and Regionalisation (CSGR), University of Warwick, Coventry CV4 7AL, United-Kingdom. URL: http://www.warwick.ac.uk/fac/soc/CSGR
Dean Spinanger
CSGR Working Paper No. 13/98
Kiel Institute of World Economics CSGR Working Paper No. 13/98 July 1998
Abstract:
The Uruguay Round (UR) Agreement on Textiles and Clothing (ATC), which was
meant to undo the MFA, is to be effected by the year 2005 despite inherent tendencies in the past
to continually protect textile and clothing (T&C) industries? How did we get into this
protectionist quagmire? What lay behind being able to sell protection in importing countries to
T&C exporting countries? What pattern of T&C trade has hence evolved and what are the
implications thereof? Based on this background the paper analyzes what currently influences
where we now are four years after the UR ratification. Aside from tariffs and non-tariff barriers,
major influences include regional trade agreements, changing locational demands, normal
development trends and shifting factor intensities of production. It is then cautiously concluded
that, despite backloading liberalization and factors which increase the pressure from major T&C
exporting countries, the wrapping up of the ATC by Jan. 1st., 2005, will be basically abided by,
even if it is accompanied by some sidestepping and perhaps postponements.
Keywords: ATC, MFA, WTO, TEXTILES, CLOTHING, LIBERALIZATION, PROTECTION, QUOTAS, URUGUAY ROUND.
Address for correspondence:
Dean Spinanger
Kiel Institute of World Economics 24100 Kiel, Germany
I. INTRODUCTION ... 1
II. SOME BACKGROUND... 2
1. The Road to the ATC... 2
2. What Underlay the Agreements? ... 5
3. How Did Trade Grow? ... 6
III. WHERE ARE WE NOW?... 8
IV. BEYOND THE MFA PHASE-OUT – A CRYSTAL BALL ATTEMPT... 13
REFERENCES ... 15
List of Tables
Table 1 — Some Key Dates in the History of Establishing the MFA and the ATC ... iTable 2 — Textile and Clothing Exports of Selected ICs and DCs: 1965-1996 ...ii
Table 3 — Structure of and Shifts among Leading Textile and Clothing Exporters: 1965-96 ...iii
Table 4 — Exports of Primary Textile Inputs, Textile and Clothing Products: Values, Shares and Growth Rates 1980-1994 ... iv
Table 5 — Trade in Total Manufactures, Textiles and Clothing as Percentage of Apparent Consumption in the EU, United States-Canada and Japan: 1980-1994... v
Table 6 — Overview of Computable General Equilibrium Assessments of the Uruguay Round – Sectoral Distribution of Welfare Effects ... vi
Table 7 — Tariff Concessions Given and Received: Post Uruguay Round Tariff Rates and Percent Reductions by Selected Countries...vii
List of Diagrams
Diagram 1 — Tariff Rates for Textile and Clothing Products before and after Uruguay Round
(UR) by Regions/Countries... ix
Diagram 2 — Tariff Rates for Textile and Clothing Products before and after Uruguay Round
(UR) by Regions/Countries... x
Genesis: 3:22)
TEXTILES BEYOND THE MFA PHASE-OUT
I.
I
NTRODUCTIONCan perhaps the almost never-ending demand for protecting domestic textile and clothing
(T&C) industries trace its roots back to a monopolist at our genesis? As understandable as
such thoughts may be in light of the tenacity with which protectionism still permeates this
sector across almost all countries, it has yet to be verified that such a constellation belongs to
those factors given to us as natural resources indigenous to this planet. We are rather
indubitably dealing with a fundamental offshoot of political economy intertwined with the
basic necessity of human beings to be clothed – just as basic as the need to seek food to exist
or shelter as protection from the elements. Can it thus really be surprising to determine that
the edicts of an anonymous international organization located somewhere beyond mountains
surrounding a small country in Europe – call it GATT or WTO – encounter noticeable
resistance in trying to inject transparency, consistency and openness into trade relations
between different economies in this world? The result of this resistance is backsliding on, or
sidestepping of agreed-upon liberalization measures or frontloading protection.
Since in the past the above has often proven to be the fate of liberalization measures applied to
T&C products, the obvious question arises in the context of the topic implicitly assigned to
me: How will protection continue to live on after the UR agreements have been effected? But
perhaps the question should be worded otherwise: How can the UR agreements be effected
despite the seemingly inherent tendencies to protect T&C industries? The task of this paper,
after outlining where we have come from, what lay behind the arrangements and how trade
flowed, is to highlight what is happening in the world to promote or hinder the true integration
of an industry that like few others has contributed to developing the wealth of nations. It
concludes with an attempt to look into the crystal ball and predict what the future holds
II. S
OMEB
ACKGROUND1. The Road to the ATC
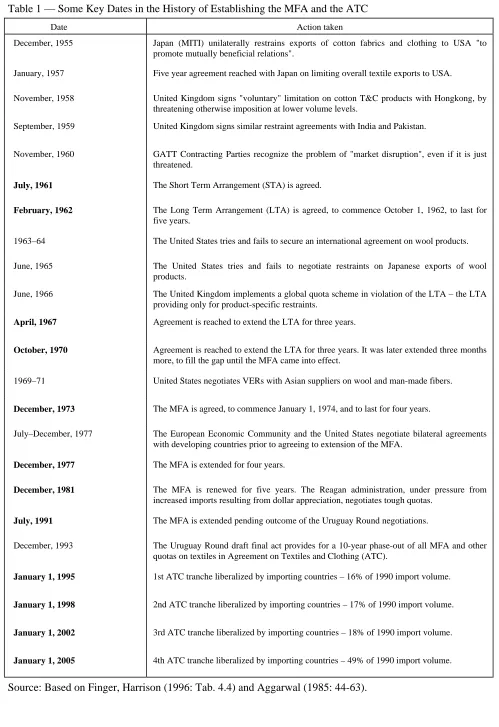
The road leading to the MFA, then to its subsequent extensions and finally to its agreed-upon
phase-out in the context of the ATC by the year 2005, has often been described and analyzed
as well as its impact thoroughly investigated.1 It suffices for this paper to merely broad-brush
some 50 years of restrictions on T&C trade, which (after WW II) began in the second half of
the 50's, with Japan being pressured by the US into imposing "voluntary export restraints" on
cotton textiles (see Table 1). These were followed by "voluntary restrictions" (likewise on
cotton textile products) being placed by the United Kingdom first on Hong Kong then on
India and Pakistan. Under the auspices of GATT, which had already paved the way for
measures dealing with market disruptions (see below), the Short Term Arrangement (STA)
was agreed-upon in July of 1961 only to be replaced with the Long Term Arrangement (LTA)
in February of 1962).2
However, in the course of the 60's3 and particularly into the early 70's, as numerous Asian
countries began to develop their textile and clothing industries, it become quite obvious to the
respective governments in importing countries that it was “necessary” to design a more all
encompassing package of restraints. This was deemed essential to effectively regulate the
rapidly expanding spectrum of T&C products emerging from the DCs and "threatening" the
1 The reader is referred to the following sources, as well as additional worthwhile references therein: GATT (1972); Keesing, Wolf (1980); GATT (1984); Aggarwal (1985); Silberston (1989); Hamilton, ed. (1990); Trela, Whalley (1990); Navaretti, Faini, Silberston, eds. (1995); Finger, Harrison (1996); Yang, Martin, Yanagishima (1997); Baugham, Mirus, Morkre, Spinanger (1997).
2 It is worthwhile noting that at this point in time the US import penetration ratio for textiles was about 6%, and for clothing around 2%. That these low levels could trigger such a massive response is perhaps surprising, but indicative of the T&C sector (see Introduction).
T&C industries in ICs.4 The growth rates of DCs in the period 1965–1973 speak for
themselves.5 The ensuing negotiations, which went down to the wire, gave birth to the MFA,
designated to come into being as of 1 January 1974. While it and its successors up to the
completion of the UR agreements contained wording which underlined the short-term nature
of the agreement to permit structural adjustment in the ICs (see footnote 4), the short-term
nature had by no means become apparent by the end of the 80's. What had become apparent,
however, was that the entire setup had become so complex that there seemed to be almost no
other reasonable solution than to phase-out the MFA in the course of the UR. Hence, the birth
of the ATC.
The agreed-upon solution in the form of the ATC set down the following basic framework:
− the MFA is to be phased out in four tranches over a 10 year period (1/1/1995; 1/1/1998; 1/1/2002; 1/1/2005), encompassing 16%, 17%, 18% and 49% of imports of all specified
T&C products based on volumes in the year 1990;
− products not liberalized, but under quota or elsewise restrained will have their growth rates increased during the first three steps of phase-out period by 16%, 25% and 27%
respectively;
4 The position of the EEC was stated as follows: "The common commercial policy pursues the two-fold objective of progressive liberalization of trade, ... while avoiding any market disruption in the Community. ... The maintenance by the Community of certain restrictions on international trade in textiles and clothing is primarily attributable to the fact that, ... the Community cannot eliminate these restrictions as long as the conditions of competition prevailing in world trade remain abnormal ... while healthy competition no doubt plays an essential incentive role in the adjustment of enterprises ... it is likewise true that excessive pressure on selling prices, because of imports [at abnormally low prices] can jeopardize any adjustment that is in progress..." (GATT 1972: VII-39). It is very much worthwhile to compare these words with a situation in the Zollverein some 130 years earlier when Bavarian and Württemberg yarn producers complained about unfair competition with Prussian producers (Henderson 1959: 183-184): "At the Stuttgart General Congress of 1842 Bavaria and Württemberg demanded increased import duties on both cotton and linen yarn. Prussia objected and ... complained [to the Zollverein about] the attitude of the South German protectionists. The note criticised the South German cotton spinners for their persistent selfish clamour for assistance and their disregard for the interests of other industries and of consumers
[italics by author]".
− each of the four groups, into which the entire spectrum of textile products had been broken down (i.e. tops/yarns, fabrics, made-ups and clothing), must be included in each of the
liberalization tranches during the 10 year period. In the case of the EU the volume of total
ATC imports in the base year 1990 consisted of 37% tops and yarns, 22% fabrics, 24%
made-ups and 17% clothing;
− the liberalization process for members is binding and final.
And finally, it could have been concluded that the negotiating parties were indeed serious in
effectively dismantling the MFA, as in Article 7, para. 1 of the ATC (GATT 1994) the word
"promote" had been replaced with the more forceful word "achieve".
As successful as the countries were in achieving an agreement on T&C products, they were
just as unsuccessful in structuring it in a manner which would have effectively brought T&C
products under the jurisdiction of the GATT framework throughout the phase-out period. It
was indeed a masterpiece of watering down and postponing. It watered down the liberalization process by including a far wider range of T&C products in the population of
products to be liberalized than was ever included to begin with. It postponed any significant liberalization until the final liberalization tranche as of 1/1/2005, at which time – as it stands
now – the most sensitive products will be subjected to basic GATT principles. The sham
result is best represented by simply noting that – believe or not – tire cords, tampons and tents
were products liberalized by Canada, the EU and the USA in the first liberalization tranche as
of 1/1/1995 (see Baughman et al. (1997) in this context).
It can thus hardly be surprising that in the preparations for the December, 1996, Singapore
WTO Ministerial, developing countries (i.e. major exporters) virtually threatened to allow the
Ministerial to collapse, if significant changes were not effected to force a structure of
liberalization which would reduce the probability of an impasse in the year 2005 when the
remaining 49% of T&C products have to be liberalized. That the situation was critical is
underlined by the comment made by the WTO's Council for Trade in Goods, an institution not
known for being overly frank (1996: para. 16.4): "The first stage integration had ... not
EU]. There were no indications that the second stage integrations ... would be more
commercially meaningful."6
The initiative on part of the T&C exporting countries to have the ATC effectively eliminate
NTBs over the course of the ATC, and not just in the final tranche, proved to be unsuccessful,
aside from being able to have stronger wording introduced into the final communiqué. One
reason for this was the attempt by some ICs (in particular the US) to have social and labor
standards to be included in the WTO's brief. Hence, the mere inclusion of stronger wording
concerning the ATC could be considered to be the price paid for keeping the WTO's
involvement with social and labor standards limited to cooperation with the ILO. The question
about whether it will remain at this level is an open question. But is it more open than the
question about whether the ATC will be carried out as agreed upon?
2. What Underlay the Agreements?
Whether T&C products over the last four decades have been subjected to much higher
protection than other internationally traded goods or not, is an important question, but – as far
as the MFA is concerned – not the key point. The core issue is that T&C products were
exempted from basic GATT principles, because of a "dirty deal" struck between importing
and exporting countries. It was a "dirty deal" because it was cut outside the GATT legal
framework by "selling" to exporting countries the right to continue to export given amounts of
T&C products to importing, that is industrialized countries. The selling point was simple and
to the point: The exporting countries had the opportunity to capture the rents ensuing from
restricting supplies.
There was a flip side, of course, namely that the exporting countries had to accept the
quantitative limits dictated to them. These were basically founded on the past performance of
the countries concerned. Naturally such a procedure of using past performance implanted
seeds of discontent for those not initially members and would spawn problems along the way.
It was also "dirty" because it was carried out under the veil of being but temporary, that is, just
long enough to permit the necessary structural adjustment to occur in the industrialized
countries (ICs). In essence, however, the restraints proved to be relatively perpetual, as the
agreed-upon growth rates of quotas for competitive exporters proved to be lower than
demand, and thus quota utilization rates remained relatively high over a long period of time.
And it was even "dirtier" in light of what could not have been fully realized at that time,
namely that the purveyors of the deal maintained the option to apply contingent protection
measures (e.g. anti-dumping proceedings) if imports grew too fast.7 But this is in essence the
heart of the protectionism that underlay the MFA and may well underlie its phase-out.
Generally speaking, the following reaction pattern can be contended to hold: As the need for
additional protection is perceived, so are ways and means found to carry this out.8
3. How Did Trade Grow?
And how has the flow of world trade in T&C products developed over the last 30 years –
Table 2 provides a starting point. It contains data on the 13 largest T&C exporters in 1996 and
traces their performance back to the mid 60's or rather to the beginning of the MFA (i.e.
1973).9 It reveals that – on the whole – the shares of these listed countries in world T&C trade
have tended to slowly decrease over the years. Thereby, however, the picture is quite different
in the case of textiles than in the case of clothing. As far as textiles are concerned, the
7 As noted by Raffaelli and Jenkins (1995: 1-3), the initial legalese construction for launching NTBs on T&C products (i.e. the STA, the LTA and MFA) came from work by the GATT Contracting Parties on market disruption. It thus borders on double jeopardy if, at a later point in time, contingent measures are applied to T&C imports which have already been limited by NTBs.
8 This runs analogous to Parkinson's law (1958: 9), by which "work expands so as to fill the time available for its completion".
countries listed have virtually held their own since 1973, dropping just one percentage point in
the 23 year period since the MFA was enacted. In the case of clothing it clearly reveals that
the listed countries have been continually losing shares to other non-listed, primarily
developing countries.
Breaking down these trends into IC and DC groups (see Table 3) yields a more differentiated
picture.
Textiles: In the 20 years since the MFA was established the ICs lost as much on market
shares as the listed DCs gained (ICs: –17.7 percentage pts.; DCs: +16.7 percentage
pts.). In other words: a reallocation took place between the listed countries or
rather, other countries were not successful in capturing market shares.
Clothing: Major shifts took place between ICs and DCs as well as between those countries
listed and those not listed. Whereas the ICs had a 50% higher share in 1973 than
DCs (or a 300% higher share in 1965), by 1983 they had fallen 20% below DCs.
However, the real winners over the last 20 years were the other, primarily
developing countries, which increased their share by almost 15 percentage points
since the MFA was effected.
The above trends are also accordingly reflected in the structure of exports of specific T&C
product groups (Table 4). Knowing that some of the most capital intensive processes in the
T&C industry can be found in the manufacturing of primary textile inputs as well as certain
textiles, while the most labor intensive are concentrated in the making clothes, the respective
differentiated shifts of production away from ICs to DCs can be seen. It is quite evident that
the inroads made by DCs in all areas is substantiated – a trend which can be further
documented when the flows of textile machinery are examined. DCs are now by far the largest
importers of T&C machinery – a good dozen years ago it was quite different. And DCs use the
export-oriented clothing industry, which are then shipped to ICs.10 There the DCs have been able to
almost double their shares in apparent consumption over the decade 1985–1994 (or almost
triple then in the period 1980–1994) as can be seen in Table 5. However, inroads by DCs into
the apparent consumption of textiles in ICs have tended to be lower than in the case of total
manufactures.
III. W
HEREA
REW
EN
OW?
All the above mentioned developments in the flows of T&C products have brought us to
where we are today almost four years after the conclusion of the Uruguay Round. They reflect
numerous influences, that is the impact of
− the MFA and tariff barriers on T&C products,
− regional trade agreements,
− changing locational demands,
− normal development trends and
− shifting factor intensities of production.
Let us start with the impact of the MFA with its tariff and non-tariff barriers.11
10 It can be shown that it is an essential ingredient in a successful T&C export strategy vis-à-vis aiming at IC markets to use machinery which produces output up to world-market standards. To date such machinery stems almost entirely from ICs. To the extent that such textiles are not produced domestically to world market standards at competitive prices, the other option is to import them. This is the path that Bangladesh successfully followed over the last 15 years (see Spinanger, 1987), and basically reflects the philosophy of Hongkong over the course of its development path.
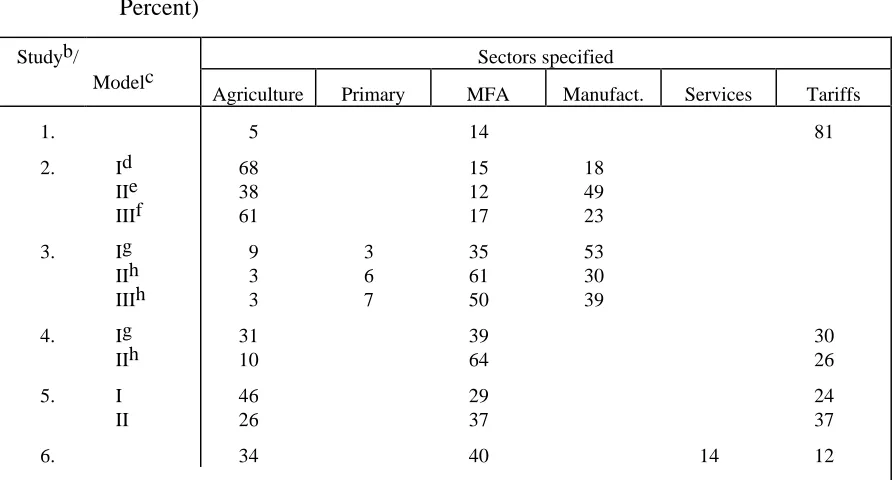
As far as analyzing the impact of UR is concerned, there is no product group which produce
world welfare increases to the extent that the elimination of MFA is posited as doing (see
Table 6). Based on an average of CGE estimates made around the end of the UR, liberalizing
the area of T&C products accounted for almost 40% of the welfare gains calculated from
liberalization measures agreed-upon in the UR. This is an impressive number and one which
could be used as a verification of the importance of such multilateral trade negotiations.
Unfortunately, a caveat needs to be injected here, as the CGE models used so far fail to take
into account some crucial aspects of the MFA:
− First of all, the quota rents applied in the models and accruing to exporting countries,12
reflect the world as it was in the 1980's, in particular the world as it was in Hong Kong.
Times have changed and quota rents in Hong Kong – as well as in other countries – have
been decreasing sharply and even approaching zero in many cases. In other words, one of
the major factors attributed to decreasing the world's welfare seem to be disappearing. One
key reason behind this is the shift in demand away from large Asian suppliers to exporters
closer to home markets (see below).
Secondly, economies like Hong Kong, South Korea and Tawan have long since become
involved in producing many of those T&C products offshore, which they used to manufacture
domestically. In doing so they are still taking advantage of quota rents, but doing this abroad,
that is, of course, to the degree they still exist. The CGE models' calculations of welfare gains
do not allow for the flow of capital assets and/or human capital from Hong Kong (or Taiwan
or ...) to a third country (e.g. Thailand, Mauritius ...). Perhaps more importantly, they do not
allow for the transfer back to Hong Kong of rents accruing to this capital. Hence, at least, the
distribution if not the size of the welfare gains and regional disaggregation are not correctly
taken in consideration. In such cases it may not just be the regional distribution of welfare
gains, but – perhaps even more important – the more productive use of capital and human
resources in other countries. All in all, the published CGE calculations of welfare increases
from an elimination of the MFA may well be misspecified, and particularly overestimated to
the extent that quota rents have not been correctly adjusted to levels prevailing at the start of
the ATC or rather to current levels.
As far as the UR tariffs are concerned, across the board the tariffs on T&C products remain
the highest, except for the agriculture sector (see Table 7). They vary between 3–5 times the
value of tariffs for all industrial goods in the ICs. Their percent reduction, however, ranks as
one of the lowest among the product categories – a sure sign of the sensitivity of this sector to
liberalization. As can be seen in Diagrams 1 and 2, the clothing products were – generally
speaking – subjected to smaller tariff changes than textile products. Only in the case of the
EFTA countries and Japan (Diagram 1) were the reductions in clothing products almost in line
with the reductions in textile products. It also becomes quite apparent that the DCs still have
to decrease tariffs considerably in order to truly improve market access. Since relative tariff
rates did not change all that much, trade in T&C products was probably not noticeably
affected.
A major impact on trade flows ensues from the establishment of regional integration schemes
(including offshore processing legislation) together with changing locational demands dictated
by just-in-time policies and ever-faster fashion cycles. In the case of the EU, these were
already having a far more profound effect on Europe's economic landscape than the ongoing
initial implementation of the UR agreements. Specifically, the completion of the single market
in the EU as of January 1, 1993, the expansion of the EU from 12 to 15 members as of
January 1, 1995, and the attempts to integrate the Central and Eastern European economies,
all had prompted T&C industries throughout Europe to more rapidly rethink corporate
strategies. Given the importance of minimizing the economic distance between locations of
production and consumption in such a time-conscious sector as the fashion industry,
just-in-time production, rapid reordering and quick fashion response were all obviously easier to
achieve with countries next door than with producers far away in Asia. On the other side of
the Atlantic came the implications of the NAFTA, which likewise was shifting demand away
from suppliers of T&C products in Asia. In both cases it was also the existence of offshore
them to establish more than just arm's length production platforms in (almost) neighboring
countries.
All these trends can easily be seen in Table 8 which portrays the country structure of clothing
imports for Germany, United Kingdom, Italy and Sweden. In the case of the four EU
countries, the Asian countries, in particular the East-Asian countries, have been loosing out to
the Euro-Med countries since around 1993 (see table for definition of country groupings),
whereby Germany and Italy imported more from Euro-Med by 1996 (or earlier) than from
Asia or the EU. Sweden, after very rapidly expanding imports from Asia – especially
East-Asia – through 1994 (its share increased by over 55% from 1990-1994), tapped to an ever
greater degree East-European countries (their share jumped over 25% in the period
1994-1996). The pattern in the US was similar vis-à-vis Latin America; with its share virtually
doubling over the seven year period, accounting for almost all of the decrease in the share of
imports from Asia.
The impact of the normal development trends can be best described as a growing up process,
in which countries switch into more physical-capital or human-capital intensive areas of
production as their income levels increase. To some degree this was already seen in Table 2,
where countries like Korea and Taiwan shifted out of the labor-intensive production of
clothing in the early 80’s and have in the meantime concentrated on the capital-intensive
production of textiles. It becomes particularly evident in the ever-increasing share of those
countries which were not among the top 13, but had become in the course of the years ever
more adept at efficiently producing clothing. Of course, some of this increase in the value of
exports must be attributed to the MFA itself, as countries still maintained production
activities, but with higher value added shares particularly in order to capture rent from the
quotas they held. It might thus be contended that it was to a notable degree that the MFA
hindered countries from following an efficient development path. That is, it kept valuable
productive resources flowing into the T&C industries long after they should have been
flowing into more efficient production areas.
The differing capital intensities of production between the T&C industries has been one factor
which has driven trade flows in T&C products. But it also has been the MFA which has
technology been achieved which have helped maintain textile production in ICs. While
sewing together pieces of fabric to produce a shirt is extremely labor intensive – and will
continue to be so in the coming years – parts of the textile industry have become some of the
most capital intensive processes in the manufacturing industry. The result of these
developments could be seen in Table 4, where the ICs in the upstream areas of production
were able to able to perform relatively better. These wide differences in capital intensities
between the textile and clothing industries also helps to explain why – given the possibility of
efficiently carrying out various stages of production in different locations – it has become
worthwhile for countries like Germany, Italy and the USA to produce the capital-intensive
inputs and then have them turned into clothes just east or south of the border.
But even here the constellation may change once NTBs are removed, as it is quite likely that it
was the MFA which kept major European producers of high-quality textile inputs from
establishing large spinning and fabric manufacturing facilities in those countries with high
productivity and low labor costs, namely in Asia. After all, the European companies could not
be sure that such facilities would be able to produce at adequate capacity levels, given the
existence of quotas. However, since quotas are now in the process of being eliminated it is
quite possible – and there are indications that this is indeed occurring – that these producers
will be investing in this part of the world.
But there is also another issue, which affects the production of the machines themselves. In
the past these have been almost entirely produced in ICs (almost 90%), with Germany, Japan,
Italy and Switzerland accounting for the lion’s share. Here the interface with the local textile
and clothing industry proved to be an essential ingredient in producing ever better, ever more
efficient machines, as the actual testing of the machines could be carried out at a textile
manufacturing company virtually around the corner. This interface between the textile
machine industry and the textile industry plays an important role from which both parties
profited. It was not only the synergetic effect stemming from approaching the problem from
different angles, it was also the ability to test machines under true working conditions before
they came on the market (for a theoretical treatment of this issue see Harhoff [1991]). But
now, with ever larger shares of the T&C complex being located in DCs, textile machinery
assemble imported parts of textile machines, but actually engage in testing the machines in
situ. Furthermore, and no doubt even more important, the companies are creating machines
more adapted to conditions in DCs, so they can be more efficiently utilized.13 Hence the
shifting of the T&C industry to DCs is also leading to a shifting of the T&C machinery
industry to the same countries (e.g. India, China, Indonesia and Brazil). But this shifting will
only apply to parts of the industry as there are still other reasons to maintain research and
production facilities in ICs (e.g. the productive interface between the industry and technical
universities).
IV. BEYOND THE MFA PHASE-OUT – A CRYSTAL BALL ATTEMPT
In summarizing the above for beyond the MFA phase-out I can only come to the conclusion
that the crystal ball is clouded. Nonetheless, as Michael Evans used to say: "Often wrong, but
never in doubt."
The good news: There are signs out there which seem to be pointing to or at least supporting
a successful conclusion to phasing out the MFA and returning to international trade in textiles
and clothing determined by traditional division of labor factors. For instance, Norway and
Canada have recently opted out of certain restraints on T&C products. This could perhaps
induce other countries to do the same. The above mentioned T&C machinery industry as well
as the textile industry itself have created joint interests which could possibly lead them to
supporting a complete integration so they themselves can remain competitive. And on top of
this, the Asian crisis may very well prove to be a blessing in disguise for the phase-out of the
MFA: It may place restraints on importing countries trying to back out of the ATC agreements
by denying access to countries trying to improve their economic situation in line with
assistance and advice received from international organizations.
The bad news: The Asia crisis could very well make exports from these countries so
inexpensive (i.e. sold at "dumping prices") that ICs apply more contingent protection
measures. Furthermore, the bias injected into international trade with T&C products by setting
up regional integration schemes works against a global division of labor. This could be seen in
particular in the case of Sweden after it joined the EU. That the EU also opted out of certain
restrictions vis-à-vis bordering countries only strengthens this contention. The US in its latest
attempt to maintain protection despite the ATC by "forcing" Turkey to agree to new
restrictions is perhaps only the beginning of an increased use of such contingent protection.
Likewise, the EU doesn’t seem to be able to restrain itself from applying anti-dumping duties
to greige textiles, even though it rejected this action earlier – France and the Southern alliance
seem to be be determined to push this through. They do not evidently realize that one of the
most competitive industries in the T&C complex, namely the dying and finishing sector, will
be damaged by these actions.
To conclude: If we can make it past the millennium bug, maybe we can make it past January
1st, 2005. It won’t be without glitches and maybe some side stepping, as well as a little
postponing also, but given the trends in trade (see Diagram 3) the pressure to relent rather than
R
EFERENCESAggarwal, Vinod K. (1985). Liberal Protectionism – the International Politics of Organized Textile Trade. Berkeley.
Baughman, Laura, Rolf Mirus, Morris Morkre, Dean Spinanger (1997). "Of Tyre Cords, Ties and Tents – Window-Dressing in the ATC." The World Economy 20 (4): 407-434.
Finger, J. Michael, Ann Harrison (1996). "The MFA Paradox: More Protection and More Trade?" In: Krueger, Anne O. (ed.), The Political Economy of American Trade Policy: 197-254. Chicago.
Finger, J. Michael., Merlinda D. Inges, Ulrich Reincke (1996). The Uruguay Round – Statistics on Tariff Concessions Given and Received. Washington, D.C.: The World Bank.
Francois, Joseph F. (1995). Assessing the Uruguay Round. In: Martin, Will and L.Alan Winters (eds.), The Uruguay Round and the Developing Countries. World Bank, Washington, D.C. World Bank Discussion Papers 307: 117–214.
Francois, Joseph F. (1996). A User’s Guide to Uruguay Round Assessments. WTO Staff Working Paper RD-96-003. London.
GATT (1972). Study on Textiles (L3797, Add. 1, Add.2). Geneva.
GATT (1984). Textiles and Clothing in the World Economy. Geneva.
Hamilton, Carl B. (ed.;1990; ). Textile Trade and the Developing Countries – Eliminating the Multi-Fibre Arrangement in the 1990s. Washington, D.C.
Harrison, Glenn W., Thomas F. Rutherford and David G. Tarr (1995). Quantifying the Uruguay Round. In: Martin, Will and L.Alan Winters (eds.), The Uruguay Round and the Developing Economies. World Bank Discussion Paper 307. Washington, D.C.
Henderson, William O. (1959). The Zollverein. London.
Harhoff, Dietmar (1991). R&D Incentives and Spillovers in a Two Industry Model. Zetrum fuer Europaeische Wirtschaftsforschung GmBH, Discussion Paper No. 91-06, Mannheim.
Hertel, Thomas W., Will Martin, Koji Yanagishima, Bettina Dimaranan (1995). Liberalizing Manufactures in a Changing World Economy. In: Martin, Will and L.Alan Winters (eds.), The Uruguay Round and the Developing Economies. World Bank Discussion Paper 307. Washington, D.C.
Krishna, Kala, Ling Hio Tan (1997). The Multifibre Arrangement in Practice: Challenging the Competitive Framework. In: Robertson, David (ed.)., East Asian Trade after the Uruguay Round: 59-77. Cambridge.
Navaretti, Giorgio Barba, Riccardo Faini, Aubrey Silberston (eds.;1995). Beyond the Multifibre Arrangement? Third World Competition and Restructuring Europe's Textile Industry. OECD, Paris.
Nguyen, Trien T., Carlo Perroni and Randall M. Wigle (1993). An Evaluation of the Draft Final Act of the Uruguay Round. The Economic Journal 103 (November): 1540–1549.
Parkinson, C. Northcote (1958). Parkinson's Law or the Pursuit of Progress. London.
Raffaelli, Marcelo and Tripti Jenkins (1995). The Drafting History of the Agreement on Textiles and Clothing. ITCB, Geneva.
Silberston, Aubrey (1989). The Future of the Multi-Fibre Agreement – Implications for the UK Economy. HMSO, London.
Spinanger, Dean (1987) “Will the Multi-fibre Arrangement Keep Bangladesh Humble? The World Economy, March: 75-84.
Trela, Irene, John Whalley (1990). "Global Effects of Developed Country Trade Restrictions on Textiles and Apparel." The Economic Journal 100 (403): 1190-1205.
UNCTAD (1991, 1997). Handbook of International Trade and Development Statistics. New York.
WTO (1997). Annual Report, Vol. II. Geneva.
Yang, Yongzheng (1994). Trade Liberalization and Externalities: A General Equilibrium Assessment of the Uruguay Round. Mimeo. Australian National University.
Table 1 — Some Key Dates in the History of Establishing the MFA and the ATC
Date Action taken
December, 1955 Japan (MITI) unilaterally restrains exports of cotton fabrics and clothing to USA "to promote mutually beneficial relations".
January, 1957 Five year agreement reached with Japan on limiting overall textile exports to USA.
November, 1958 United Kingdom signs "voluntary" limitation on cotton T&C products with Hongkong, by threatening otherwise imposition at lower volume levels.
September, 1959 United Kingdom signs similar restraint agreements with India and Pakistan.
November, 1960 GATT Contracting Parties recognize the problem of "market disruption", even if it is just threatened.
July, 1961 The Short Term Arrangement (STA) is agreed.
February, 1962 The Long Term Arrangement (LTA) is agreed, to commence October 1, 1962, to last for five years.
1963–64 The United States tries and fails to secure an international agreement on wool products.
June, 1965 The United States tries and fails to negotiate restraints on Japanese exports of wool products.
June, 1966 The United Kingdom implements a global quota scheme in violation of the LTA – the LTA providing only for product-specific restraints.
April, 1967 Agreement is reached to extend the LTA for three years.
October, 1970 Agreement is reached to extend the LTA for three years. It was later extended three months more, to fill the gap until the MFA came into effect.
1969–71 United States negotiates VERs with Asian suppliers on wool and man-made fibers.
December, 1973 The MFA is agreed, to commence January 1, 1974, and to last for four years.
July–December, 1977 The European Economic Community and the United States negotiate bilateral agreements with developing countries prior to agreeing to extension of the MFA.
December, 1977 The MFA is extended for four years.
December, 1981 The MFA is renewed for five years. The Reagan administration, under pressure from increased imports resulting from dollar appreciation, negotiates tough quotas.
July, 1991 The MFA is extended pending outcome of the Uruguay Round negotiations.
December, 1993 The Uruguay Round draft final act provides for a 10-year phase-out of all MFA and other quotas on textiles in Agreement on Textiles and Clothing (ATC).
January 1, 1995 1st ATC tranche liberalized by importing countries – 16% of 1990 import volume.
January 1, 1998 2nd ATC tranche liberalized by importing countries – 17% of 1990 import volume.
January 1, 2002 3rd ATC tranche liberalized by importing countries – 18% of 1990 import volume.
January 1, 2005 4th ATC tranche liberalized by importing countries – 49% of 1990 import volume.
Ratese)
Growth ratesf
1965 1973 1983 1990 1996 1965-73 1973-83 1983-96
Textiles and Clothing
China 3.4 (11) 3.0 (12) 5.9 (6) 7.9 (3) 11.8 (1) 13.8 18.5 16.0
Italy 10.3 (2) 8.5 (2) 9.5 (1) 10.0 (2) 9.3 (2) 13.0 11.9 9.8
Germany 8.5 (5) 11.9 (1) 8.6 (2) 10.3 (1) 6.7 (3) 20.8 7.2 7.7
Korea, Rep. of 0.5 (23) 3.6 (11) 6.7 (3) 6.5 (4) 5.4 (4) 49.7 17.8 8.2
USA 6.8 (7) 4.5 (9) 3.5 (10) 3.6 (9) 4.9 (5) 10.1 7.9 12.8
Taiwan 0.6 (21) 3.8 (10) 5.2 (7) 4.7 (7) 4.9 (6) 44.8 14.2 9.3
France 9.3 (3) 8.2 (4) 4.7 (8) 5.0 (6) 4.1 (7) 13.9 4.7 8.7
Hong Kong 4.3 (10) 5.5 (7) 6.1 (5) 5.4 (5) 3.4 (8) 19.4 11.9 5.1
United Kingdom 8.8 (4) 5.7 (6) 3.5 (11) 3.5 (10) 3.4 (9) 9.6 5.4 9.7
Belgium/Luxembourg 7.2 (6) 6.8 (5) 3.8 (9) 3.9 (8) 3.2 (10) 15.0 4.6 8.5
India 5.7 (8) 2.4 (13) 1.5 (17) 2.2 (15) 2.9 (11) 3.7 5.7 15.7
Turkey 0.0 (39) 0.5 (30) 1.6 (15) 2.2 (14) 2.8 (12) 55.4 25.8 14.7
Japan 13.7 (1) 8.4 (3) 6.5 (4) 3.0 (11) 2.4 (13) 8.9 7.9 1.7
Totalg 79.2 72.7 67.2 68.3 65.3 14.5 9.8 9.7
Worldh 10.30 33.27 91.95 213.41 313.54 15.8 10.7 9.9
Textiles
Germany 8.6 (4) 13.7 (1) 10.6 (1) 13.4 (1) 9.0 (1) 20.9 5.9 7.4
Italy 8.2 (5) 6.9 (5) 8.3 (3) 9.0 (2) 8.8 (2) 11.6 10.6 9.2
Korea, Rep. of 0.3 (23) 2.0 (16) 4.8 (7) 5.8 (6) 8.5 (3) 42.1 18.7 13.6
China 3.9 (10) 3.4 (9) 5.5 (4) 6.9 (3) 8.1 (4) 12.2 14.0 11.9
Taiwan 0.6 (20) 2.5 (12) 3.6 (10) 5.8 (5) 8.0 (5) 36.7 12.4 15.7
USA 6.8 (8) 5.5 (8) 4.7 (8) 4.8 (9) 5.3 (6) 11.1 6.8 9.9
France 9.2 (3) 7.6 (3) 5.1 (6) 5.8 (7) 4.9 (7) 11.3 4.4 8.3
Belgium/Luxembourg 7.6 (6) 7.6 (4) 5.5 (5) 6.1 (4) 4.9 (8) 14.0 5.2 7.7
Japan 14.5 (1) 11.0 (2) 10.5 (2) 5.6 (8) 4.6 (9) 10.1 8.2 2.0
United Kingdom 9.9 (2) 6.5 (6) 3.7 (9) 4.2 (10) 3.6 (10) 8.2 2.7 8.4
India 7.4 (7) 3.1 (10) 1.4 (17) 2.1 (14) 3.0 (12) 2.3 0.2 15.3
Turkey 0.1 (36) 0.4 (28) 1.7 (16) 1.4 (18) 1.8 (16) 47.7 24.2 9.1
Hong Kong 1.8 (13) 2.0 (13) 1.9 (14) 2.1 (15) 1.2 (20) 15.6 7.9 4.8
Totalg 78.9 72.5 67.3 72.8 71.5 12.8 7.8 9.2
Worldh 7.77 22.12 50.65 105.04 150.22 14.0 8.6 8.7
Clothing
China 2.0 (12) 2.1 (13) 6.3 (5) 8.9 (2) 15.3 (1) 21.1 27.1 19.0
Italy 16.8 (1) 11.7 (2) 11.0 (2) 10.9 (1) 9.8 (2) 15.0 13.3 10.2
Hong Kong 12.0 (2) 12.4 (1) 11.3 (1) 8.6 (3) 5.5 (3) 20.9 13.0 5.1
USA 6.8 (6) 2.6 (12) 2.1 (9) 2.4 (13) 4.6 (4) 6.5 11.9 17.9
Germany 8.1 (5) 8.2 (4) 6.2 (6) 7.3 (4) 4.5 (5) 20.4 10.9 8.5
Turkey 0.0 (47) 0.5 (31) 1.6 (15) 3.1 (9) 3.8 (6) 115.9 28.5 19.0
France 9.6 (4) 9.3 (3) 4.2 (7) 4.3 (6) 3.4 (7) 19.9 5.3 9.3
United Kingdom 5.5 (8) 3.9 (8) 3.2 (8) 2.8 (11) 3.2 (8) 15.5 11.5 11.2
India 0.5 (22) 0.9 (25) 1.6 (13) 2.3 (14) 2.8 (9) 29.7 20.8 16.1
Korea, Rep. of 0.8 (17) 6.7 (5) 9.0 (3) 7.3 (5) 2.6 (10) 56.6 17.3 1.0
Taiwan 0.8 (18) 6.4 (6) 7.2 (4) 3.7 (7) 2.0 (15) 56.4 15.5 0.5
Belgium/Luxembourg 5.8 (7) 5.1 (7) 1.8 (10) 1.8 (16) 1.8 (17) 18.5 2.6 11.0
Japan 11.3 (3) 3.3 (10) 1.6 (14) 0.5 (33) 0.3 (36) 3.2 6.0 -2.1
Totalg 80.1 73.1 67.1 63.9 59.6 19.0 13.0 10.1
Worldh 2.53 11.15 41.30 108.37 163.32 20.4 14.0 11.2
aSITC 65, Rev. 2. – bSITC 84, Rev. 2. – cShare of world trade. – dRanking based on values in 1996; covering all available textile and clothing exporting countries; country selection for the table dictated by top 13 countries exporting textiles and clothing in 1996; ranking in given year in ( ). – eAverage annual growth rate. – fBold typed numbers designate an above world average growth rate. – gSum of shares of listed countries. – hIn bill. US$.
[image:22.595.73.542.104.680.2]Table 3 – Structure of and Shifts among Leadinga Textileb and Clothingc Exporters: 1965-96
Sharesd Change in sharese
1965 1973 1983 1996 65-73 73-83 83-96 73-96
Textiles and Clothing
Totalf 79.2 72.7 67.2 65.3 –6.5 –5.5 –1.9 –7.4
ICsg 64.6 54.0 40.1 34.0 –10.6 –13.9 –6.1 –20.0
DCsh 14.6 18.7 27.1 31.3 +4.1 +8.4 +4.2 +12.6
Textiles
Totalf 78.9 72.5 67.3 71.5 –6.4 –5.2 +4.2 –1.0
ICsg 64.8 58.8 48.4 41.1 –6.0 –10.4 –7.3 –17.7
DCsh 14.1 13.7 18.9 30.4 –0.4 +5.2 +11.5 +16.7
Clothing
Totalf 80.1 73.1 67.1 59.6 –7.0 –6.0 –7.5 –13.5
ICsg 63.9 44.1 30.1 27.6 –19.8 –14.0 –2.5 –16.5
DCsh 16.2 29.0 37.0 32.0 +12.8 +8.0 –5.0 +3.0
aBased on top 13 textile and clothing exporting countries in 1996. – bSITC 65 Rev. 2. – cSITC 84 Rev. 2. – dPercentage share of specific country groupings in total world exports of respective products. – eAbsolute changes in percentage shares. – fThe top 13 exporting countries listed in Table 1. – gThe 7 industrialized countries listed in Table 1. – hThe 6 developing countries listed in Table 1.
Table 4 – Exports of Primary Textile Inputsa, Textileb and Clothingc Products: Values, Shares and Growth Rates 1980-1994
SITC Products descriptiond Valuese and shares Growth ratesf
(Rev. 2) 1980-81 1987-88 1993-94 80/81-87/88 87/88-93-94
group World (% IC)g ICs DCs ICs DCs
Total T&C products 104.06 (64) 176.00 (56) 272.82 (46) 5.8 10.9 4.1 11.3
Primary textile inputs 16.40 (65) 20.22 (69) 19.41 (58) 3.5 2.2 –3.1 3.4
263 Cotton 7.67 (40) 7.22 (35) 8.15 (39) –2.7 0.3 3.9 1.0
268 Wool (exc. tops), etc. 4.50 (84) 7.20 (86) 4.73 (76) 7.3 5.0 –8.7 2.0
266 Syn. fibres to spin 2.97 (89) 3.95 (80) 4.58 (60) 2.6 13.3 –2.3 15.0
267 Other man-made fibres 1.26 (94) 1.85 (89) 1.95 (87) 4.9 14.0 0.5 3.8
Textile yarn, fabrics, etc. 50.66 (74) 80.62 (64) 122.39 (54) 4.8 11.7 4.1 11.4
653 Woven man-made fib. fab. 9.85 (78) 15.40 (63) 26.71 (48) 3.4 14.9 4.8 16.0
651 Textile yarn 13.50 (77) 20.67 (68) 25.47 (56) 4.0 13.1 0.2 9.2
652 Cotton fabrics, woven 6.83 (64) 11.99 (53) 16.38 (48) 5.5 12.6 3.6 7.1
657 Special textile fabr., prds. 4.65 (85) 8.09 (82) 14.36 (69) 7.7 11.1 6.9 20.4
658 Textile articles nes 3.82 (61) 5.76 (52) 10.16 (39) 3.7 9.3 4.7 14.4
659 Floor coverings, etc. 4.85 (67) 6.77 (64) 8.84 (62) 4.2 6.2 4.0 5.5
654 Other woven text. fabr. 3.35 (72) 6.16 (68) 8.56 (71) 8.2 11.1 6.4 3.9
655 Knitted etc. fabrics 2.48 (84) 3.78 (60) 8.50 (43) 1.3 20.9 8.3 21.5
656 Lace, ribbons, etc. 1.33 (84) 2.00 (72) 3.41 (60) 3.7 15.0 6.1 15.9
Clothing 37.00 (50) 75.26 (44) 131.02 (37) 8.8 12.4 6.5 11.9
843 Fem. outerwear nonknit. 8.59 (53) 18.59 (47) 33.17 (37) 9.8 13.6 5.8 13.4
845 Outerwear knit nonelast. 8.83 (56) 19.53 (46) 28.74 (40) 8.9 15.4 4.2 8.5
842 Mens outerwear notknit. 7.88 (48) 12.84 (45) 24.01 (36) 6.3 8.1 6.9 13.8
846 Under garments knitted 4.05 (52) 8.19 (44) 17.83 (41) 7.9 13.1 12.5 14.8
844 Under garments notknit. 2.46 (24) 4.87 (23) 11.08 (24) 9.2 10.5 15.5 14.4
848 Headgear, nontext. clothing 3.50 (51) 7.81 (39) 10.65 (29) 8.9 15.7 0.2 8.0
847 Textile clothing acces. nes. 1.68 (65) 3.43 (59) 5.54 (54) 9.2 13.3 6.8 10.4
aSITC 26. – bSITC 65. – cSITC 84. – dRanked within aggregates by 1993/94 values. – eBill. US$, average of the two years. Based on UNCTAD (1991 and 1997) Tables 4.3.A and B. – f%; average annual growth rates. Note: growth rates of individual groups calculated using raw data from Tables 4.3.A and B (UNCTAD 1991 and 1997). The bold typed figures represent above average growth rates for total T&C products in the respective periods (i.e. average growth rates for 80/81–87/88: 7.8%; 87/88– 93/94: 7.6%). – g% of world exports originating in ICs.
Total manufactures Textiles Clothing
1980 1985 1990 1994 1980 1985 1990 1994 1980 1985 1990 1994
European Union
Apparent consumption (mill. US$) 2269604 1715524 3793770 3709476 91767 66787 131841 114334 50746 36310 88569 89834
External imports in % of consumption 8.88 10.65 10.91 13.06 9.90 10.71 11.49 14.57 19.21 23.33 31.73 43.16
of which:
Industrialized countries 5.08 6.20 6.45 6.90 4.29 4.31 4.08 4.14 2.60 1.81 1.92 2.07
Developing countries 2.55 3.12 3.51 4.57 4.88 5.60 6.61 8.90 14.41 19.05 27.27 34.66
United States and Canada
Apparent consumption (mill. US$) 2011874 2595480 3272683 3802392 61528 76047 94975 113260 47441 64170 80257 95207
External imports in % of consumption 6.99 9.92 11.76 13.81 5.09 7.61 7.98 8.81 15.86 26.82 36.30 42.30
of which:
Industrialized countries 4.39 6.31 6.81 7.18 2.50 3.84 3.34 3.33 1.72 3.85 3.36 2.80
Developing countries 2.53 3.54 4.84 6.43 2.48 3.68 4.55 5.33 13.91 22.72 32.74 39.10
Japan
Apparent consumption (mill. US$) 879492 994157 2106795 2871224 36621 36222 63095 75049 11519 12371 30775 43806
External imports in % of consumption 5.33 5.33 6.77 6.35 5.59 6.72 7.79 7.96 13.38 16.32 38.57 34.93
of which:
Industrialized countries 3.21 3.34 4.15 3.57 2.39 2.63 3.55 2.56 3.76 2.81 7.03 6.43
Developing countries 2.01 1.90 2.50 2.70 3.14 4.05 4.18 5.38 9.60 13.49 21.51 28.48
[image:25.842.72.732.111.416.2]Table 6 — Overview of Computable General Equilibrium Assessments of the Uruguay Rounda – Sectoral Distribution of Welfare Effects (in Percent)
Studyb/ Sectors specified
Modelc
Agriculture Primary MFA Manufact. Services Tariffs
1. 5 14 81
2. Id 68 15 18
IIe 38 12 49
IIIf 61 17 23
3. Ig 9 3 35 53
IIh 3 6 61 30
IIIh 3 7 50 39
4. Ig 31 39 30
IIh 10 64 26
5. I 46 29 24
II 26 37 37
6. 34 40 14 12
Reductionsb by Selected Countries
Product Canada EU (12) Japan USA LMIEc HIEc
category Tariff rate Percent reduc-tion Tariff rate Percent reduc-tion Tariff rate Percent reduc-tion Tariff rate Percent reduc-tion Tariff rate Percent reduc-tion Tariff rate Percent reduc-tion
Tariff concessions given
Agricultured 7.0 – 15.7 5.9 65.1 36.6 10.8 1.5 17.4 43.0 26.9 26.9
Textiles/clothing 14.2 5.7 8.7 2.0 7.2 2.3 14.8 2.0 21.2 8.5 8.4 2.6
Metals 1.5 5.5 1.0 3.3 0.5 2.1 1.1 3.8 10.8 9.5 0.9 3.4
Chemicals, etc.e 2.6 5.9 3.8 3.3 1.2 2.5 2.5 4.9 12.4 9.7 2.2 3.7
Transportation equip. 3.2 3.0 5.5 2.4 0.0 3.9 3.4 1.1 19.9 10.1 4.2 2.6
NE machineryf 1.2 4.1 1.4 3.0 0.0 3.9 0.9 2.8 13.5 6.5 1.1 3.1
Electric machinery 1.6 5.3 5.4 3.5 0.1 2.3 1.7 2.5 14.6 7.7 2.3 3.2
Industrial goods 2.6 4.8 2.9 2.9 1.4 2.6 3.1 2.9 13.3 8.1 2.5 3.1
All merch. trade 2.4 4.7 2.8 3.1 2.8 2.7 2.8 2.9 13.3 8.1 2.6 3.2
Tariff concessions received
Agricultured 41.2 40.7 33.6 52.6 6.6 13.8 37.6 46.7 13.3 17.1 39.5 40.0
Textiles/clothing 7.1 5.3 11.4 4.3 8.6 5.9 9.7 4.8 8.8 2.7 10.9 3.9
Metals 0.6 2.8 5.2 5.3 4.8 6.8 3.1 3.3 2.3 3.4 3.2 4.3
Chemicals, etc.e 1.8 5.3 5.2 5.5 5.9 6.6 4.9 4.4 4.8 4.7 4.8 5.0
Transportation equip. 1.0 4.1 5.0 3.2 8.3 3.4 2.3 3.7 5.6 2.2 6.5 3.3
NE machineryf 0.8 3.7 5.4 3.5 3.9 3.7 3.0 3.7 2.9 3.1 3.6 3.4
Electric machinery 2.4 4.0 7.9 3.9 4.7 3.8 4.9 4.9 2.7 3.4 5.0 3.8
Industrial goods 0.6 4.3 5.3 4.3 5.2 4.3 3.3 4.1 4.0 3.3 4.4 3.9
All merch. trade 0.8 4.0 5.5 4.2 3.5 3.9 3.8 4.1 3.9 3.5 4.5 3.9
a Applied rates; percent. – b Weighted changes; calculated by dT/(1+T) in percent. – c Low- and Middle-Income Economies as well as
High-Income Economies as listed in Finger et al. (1996: Table 1). – d Excludes fish, includes tariff equivalents of non-tariff barriers. – e Includes photographic supplies. – f NE = non-electric.
[image:27.595.74.521.99.530.2]Table 8 — Imports of Clothing Products (SITC 84) for Selected OECD Countries by Major Suppliers: 1990-1996 (% of Total)
1990 1991 1992 1993 1994 1995 1996
Germany (Total)a 20,385 24,059 24,718 22,233 22,755 24,591 24,066
EUb 37.92 35.56 36.95 30.36 29.94 29.02 28.08
Non-EUc 60.02 62.46 60.88 67.43 67.95 68.79 68.89
Euro-Medd 29.01 27.40 28.77 32.68 34.11 37.64 38.44
Med.e 14.47 13.46 14.51 15.84 15.47 17.25 17.49
CE-Eurof 14.54 13.93 14.25 16.82 18.61 20.26 20.91
Asiag 29.55 35.89 33.52 36.50 35.94 33.59 34.38
E-Asiah 20.11 22.54 19.44 20.36 19.48 16.81 17.11
UK (Total)a 6,890 7,210 7,763 6,743 7,413 8,017 9,405
EUb 42.81 39.04 38.35 27.65 29.04 29.75 31.08
Non-EUc 54.71 58.46 58.98 69.66 68.26 67.44 66.02
Euro-Medd 10.35 9.72 10.51 11.88 12.66 13.92 14.06
Med.e 8.61 7.87 8.26 9.15 9.35 10.17 10.15
CE-Eurof 1.74 1.84 2.25 2.73 3.29 3.73 3.90
Asiag 41.24 45.24 44.38 53.21 51.54 49.10 47.74
E-Asiah 24.85 27.55 25.30 30.46 28.00 25.04 24.56
Italy (Total)a 2,559 3,418 4,294 3,822 3,964 4,650 4,991
EUb 49.81 45.19 42.53 37.62 36.03 31.97 31.20
Non-EUc 44.11 49.47 53.09 58.54 61.01 65.62 66.01
Euro-Medd 13.52 15.26 19.25 23.00 27.72 31.05 34.52
Med.e 7.26 8.40 9.82 11.57 13.48 14.58 14.99
CE-Eurof 6.25 6.85 9.38 11.26 14.08 16.26 19.08
Asiag 27.23 31.15 30.75 32.62 30.22 31.56 28.47
E-Asiah 16.02 17.78 17.13 17.68 15.26 15.00 14.28
Sweden (Total)a 2,514 2,460 2,622 2,096 2,116 2,127 2,169
EUb 62.14 58.87 55.34 45.66 43.08 43.85 44.53
Non-EUc 35.25 38.33 41.94 51.59 54.59 50.38 51.13
Euro-Medd 4.69 5.31 7.57 8.08 9.75 10.71 12.15
Med.e 2.33 1.84 2.19 2.17 2.33 2.05 2.66
CE-Eurof 2.37 3.46 5.38 5.91 7.43 8.65 9.50
Asiag 29.32 31.77 33.46 42.37 43.92 38.99 38.13
E-Asiah 21.39 23.75 25.04 32.55 33.31 29.06 28.74
USA (Total)a 26,977 27,696 32,951 35,605 38,643 41,367 43,320
EUb 7.00 5.88 4.95 4.40 4.61 4.84 5.17
Non-EUc 91.21 92.13 93.05 93.43 93.00 92.51 92.29
Euro-Medd 3.02 2.57 2.92 3.20 3.88 4.34 —
Asiag 74.31 73.54 72.33 70.49 67.69 63.24 61.50
E-Asiah 53.38 52.36 48.54 46.07 43.14 37.99 —
Latin Americai 12.47 14.75 15.99 17.61 19.04 22.44 24.88
[image:28.595.70.538.108.645.2]Diagram 1 — Tariff Rates (%) for Textilea and Clothingb Products before and afterc Uruguay Round (UR) by Regions/Countriesd
0 5 10 15 20 25
0 5 10 15 20 25
1c 2c 3c 4c 5c 6c 1a 2a 3 1b 2b 3b 4a 4b 5a 5b 6a 6b
5 10 15 20 25
5 10 15 20 25
Note: The thin line ( ) represents a decrease in tariff rates by 25%. The broken line ( ) represents a decrease in tariff rates by 50%.
a The textile tariff rates are designated by "a"; b The clothing tariff rates are designated by "b"; c The clothing tariff rates- if reduced as much in UR as textile tariff rates- are represented by "c"; d 1=Japan; 2=USA; 3=EU; 4=EFTA; 5=East Asia; 6=Transition Economies.
Textiles Clothing Textile tariffs before UR
Textile tariffs after UR
Clothing tariffs before UR
Diagram 2 — Tariff Rates (%) for Textilea and Clothingb Products before and afterc Uruguay Round (UR) by Regions/Countriesd
0 10 20 30 40 50 60 70
0 10 20 30 40 50 60 70
1c 2c 3c 4c 5c 6c 1a 2a 3a 1b 2b 3b 4a 4b 5a 5b 6a 6b
10 20 30 40 50 60 70
10 20 30 40 50 60 70
Note: The thin line ( ) represents a decrease in tariff rates by 25%. The broken line ( ) represents a decrease in tariff rates by 50%.
a The textile tariff rates are designated by "a"; b The clothing tariff rates are designated by "b"; c The clothing tariff rates- if reduced as much in UR as textile tariff rates- are represented by "c"; d 1=Australia; 2=Canada 3=Latin America; 4=South Asia; 5=Africa; 6=Rest of World (ROW).
Textiles Clothing Textile tariffs before UR
Textile tariffs after UR
Clothing tariffs before
Diagram 3 — Per Capita Clothing Imports (US$)a: Total and from NON-ICsb
Total
1 10 100 1000
1973 1978 1983 1988 1993
United States Switzerland
United Kingdom Germany FR
Portugal $/cap.
1 10 100 1000
1973 1978 1983 1988 1993
Japan Sweden France
Benelux Italy
$/cap.
Non-ICs
0,1 1 10 100 1000
1973 1978 1983 1988 1993
United States Switzerland
United Kingdom Germany FR
Portugal $/cap.
0,1 1 10 100 1000
1973 1978 1983 1988 1993
Japan Sweden France
Benelux Italy
$/cap.
a
Imports of SITC 84 in US$ divided by population.– bNon-ICs compromise all countries except those on OECD (excluding Turkey); Germany is Federal Republic (i.e. West Germany) through 1990.