A global multicenter study on reference values: 1. Assessment of
methods for derivation and comparison of reference intervals
Kiyoshi Ichihara
a,⁎
, Yesim Ozarda
b, Julian H Barth
c, George Klee
d, Ling Qiu
e, Rajiv Erasmus
f, Anwar Borai
g,
Svetlana Evgina
h, Tester Ashavaid
i, Dilshad Khan
j, Laura Schreier
k, Reynan Rolle
l, Yoshihisa Shimizu
m,
Shogo Kimura
a, Reo Kawano
a,n, David Armbruster
o, Kazuo Mori
p, Binod K Yadav
q, on behalf of,
Committee on Reference Intervals and Decision Limits, International Federation of Clinical Chemistry and
Laboratory Medicine:
aFaculty of Health Sciences, Yamaguchi University Graduate School of Medicine, Ube, Japan b
Dept of Medical Biochemistry, Uludag University School of Medicine, Bursa, Turkey cBlood Sciences, Leeds General Infirmary, Leeds, UK
d
Laboratory Medicine and Pathology, Mayo Clinic College of Medicine, Rochester, MN, USA e
Dept of Clinical Laboratory, Peking Union Medical College, Beijing, China f
Chemical Pathology, University of Stellenbosch and National Health Laboratory Services, Tygerberg, South Africa
gKing Abdullah International Medical Research Center, King Saud bin Abdulaziz University for Health Sciences, Pathology, King Abdulaziz Medical City, Jeddah, Saudi Arabia hBeckman Coulter LLC, Moscow, Russia
i
Dept of Laboratory Medicine, P. D. Hinduja National Hospital and Medical Research Centre, Mumbai, India j
Dept of Pathology, National University of Medical Sciences, Rawalpindi, Pakistan k
Dept of Clinical Biochemistry, Faculty of Pharmacy and Biochemistry, University of Buenos Aires, Argentina l
Newborn Screening Center Visayas, West Visayas State University Medical Center, Iloilo, Philippines
mDept of Medical Life Science, Faculty of Medical Bioscience, Kyushu University of Health and Welfare, Nobeoka, Japan nClinical Research Center, Yamaguchi University Hospital, Ube, Japan
o
Abbott Laboratories, Abbott Park, IL, USA p
Beckman Coulter Japan, Tokyo, Japan q
Dept of Biochemistry, Maharajgunj Medical Campus, Institute of Medicine, Kathmandu, Nepal
a b s t r a c t
a r t i c l e i n f o
Article history:
Received 31 December 2015
Received in revised form 2 September 2016 Accepted 20 September 2016
Available online xxxx
Objectives:The IFCC Committee on Reference Intervals and Decision Limits coordinated a global multicenter study on reference values (RVs) to explore rational and harmonizable procedures for derivation of reference in-tervals (RIs) and investigate the feasibility of sharing RIs through evaluation of sources of variation of RVs on a global scale.
Methods:For the common protocol, rather lenient criteria for reference individuals were adopted to facilitate har-monized recruitment with planned use of the latent abnormal values exclusion (LAVE) method. As of July 2015, 12 countries had completed their study with total recruitment of 13,386 healthy adults. 25 analytes were mea-sured chemically and 25 immunologically. A serum panel with assigned values was meamea-sured by all laboratories. RIs were derived by parametric and nonparametric methods.
Results:The effect of LAVE methods is prominent in analytes which reflect nutritional status, inflammation and muscular exertion, indicating that inappropriate results are frequent in any country. The validity of the paramet-ric method was confirmed by the presence of analyte-specific distribution patterns and successful Gaussian transformation using the modified Box-Cox formula in all countries. After successful alignment of RVs based on the panel test results, nearly half the analytes showed variable degrees of between-country differences. Thisfinding, however, requires confirmation after adjusting for BMI and other sources of variation. The results are reported in the second part of this paper.
Conclusion:The collaborative study enabled us to evaluate rational methods for deriving RIs and comparing the RVs based on real-world datasets obtained in a harmonized manner.
© 2016 The Authors. Published by Elsevier B.V. This is an open access article under the CC BY license (http:// creativecommons.org/licenses/by/4.0/). Keywords:
Reference intervals Multicenter study
Latent abnormal values exclusion method Harmonization
Standardization Standard deviation ratio Serum panel
Modified Box-Cox power transformation Ethnic differences
Clinica Chimica Acta xxx (2016) xxx–xxx
⁎ Corresponding author at: Department of Clinical Laboratory Sciences, Faculty of Health Sciences, Yamaguchi University Graduate School of Medicine, Minamikogushi 1-1-1, Ube 755-8505, Japan.
E-mail address:[email protected](K. Ichihara).
CCA-14501; No of Pages 13
http://dx.doi.org/10.1016/j.cca.2016.09.016
0009-8981/© 2016 The Authors. Published by Elsevier B.V. This is an open access article under the CC BY license (http://creativecommons.org/licenses/by/4.0/). Contents lists available atScienceDirect
Clinica Chimica Acta
j o u r n a l h o m e p a g e :w w w . e l s e v i e r . c o m / l o c a t e / c l i n c h i m
Non-standard abbreviations
1. Introduction
The reference interval (RI) is defined simply as the prediction inter-val which includes the central 95% of reference inter-values (RVs), or test re-sults from well-defined healthy individuals (reference individuals). Establishment of well-controlled, reliable RIs is an important mission for all clinical laboratories. In reality, it is very challenging, because it is not easy to recruit a sufficient number of reference individuals, to con-trol pre-analytical variables, and to apply all statistical methods in ap-propriate manners. The international guideline entitled“Defining, establishing, and verifying reference intervals in the clinical laboratory”
wasfirst published as a possible solution in 1996 by collaboration be-tween the Clinical and Laboratory Standards Institute (CLSI) and the In-ternational Federation of Clinical Chemistry and Laboratory Medicine (IFCC) (the latest 2010 version is designated as CLSI/IFCC EP28-A3c (for-merly, C28-A3)[1]. However, the descriptions are generally theoretical in nature, and the rationales of the recommendations have not been well evaluated by implementing actual, down-to-earth RI studies. In fact, there have been controversies over its pragmatic aspects, such as the rationale for secondary exclusion, the use of parametric vs. nonpara-metric derivation, and determining how to judge the need for partitioning RVs[2–5].
In the init terim period, for the achievement of global standardiza-tion for major laboratory tests, the current consensus is to derive the RIs in a reproducible manner based on sufficient sample size by collab-oration between multiple laboratories and to use the derived RIs in common or by transference[6–8]. The Scandinavian groups conducted a multicenter study for derivation of common RIs based on standardized test values and found virtually no between-country differences in the Nordic countries[9]. However, the appropriateness of the study proto-col and the method used for evaluating between-laboratory differences need to be evaluated by use of newer statistical methods. In addition, the IFCC Committee on Plasma Proteins concurrently conducted two RI studies mainly aimed at deriving common RIs for major serum pro-teins in East and Southeast Asian countries in 2000 and 2004; it revealed apparent between-country differences in many of the analytes, espe-cially those of inflammatory markers[10,11].
With this background and its mission of promoting proper imple-mentation of multicenter RI studies, the Committee on Reference Inter-vals and Decision Limits (C-RIDL) was established by the IFCC in 2005. The primary project of the C-RIDL, as planned in early 2010, was to clar-ify between-country differences in RIs on a global scale and to seek the most practical and harmonizable methodologies for conducting the RI studies. The key strategy of the global study was to make RVs compara-ble among the countries through measurement of a common panel of serum samples. After conducting a feasibility study to confirm the valid-ity of cross comparison of test results based on the panel test results[12]
and the elaboration of the common protocol[13], the global multicenter study was launched at the end of 2011 on a trial basis. The more
3N-ANOVA three-level-nested ANOVA
Alb albumin
AFP alpha-fetoprotein
ALP alkaline phosphatase
ALT alanine aminotransferase
AMY amylase
ARG Argentina
AST aspartate aminotransferase
BMI body mass index
Ca calcium
CDL clinical decision limit CEA carcinoembryonic antigen
CK creatine kinase
CI confidence interval
Cl chloride
CLSI Clinical and Laboratory Standards Institute
C3 complement component 3
C4 complement component 4
CA125 carcinoma antigen 125
CHN China
Cre creatinine
C-TLM Committee on Traceability in Laboratory Medicine CRM certified reference materials
CRP C-reactive protein
CV(b) CV of the regression slope b dDL drugs for dyslipidemia dHT drugs for hypertension dHU drugs for hyperuricemia
DL decision limit
DMS data management system
Drk drinking habit
E2 estradiol
Fe iron
FSH follicular stimulating hormone GCA general chemistry analytes GGT gamma-glutamyltransferase
Glu glucose
GBR Great Britain
GH growth hormone
HDL-C HDL-cholesterol
HBV hepatitis B virus
HCV hepatitis C virus
HIV human immunodeficiency virus HRT hormone replacement therapy
IgA immunoglobulin A
IgG immunoglobulin G
IgM immunoglobulin M
IND India
IP inorganic phosphate
JPN Japan
K potassium
LAVE latent abnormal values exclusion
LDH lactate dehydrogenase
LDL-C LDL-cholesterol
LH luteinizing hormone
LL lower limit
MALRA major-axis linear regression analysis MRA multiple regression analysis
Me median
Mg magnesium
Na sodium
NP non-parametric
OC oral contraceptives
P parametric
Pr probability
PAK Pakistan
PHL Philippines
PSA prostate specific antigen
PTH parathyroid hormone
Prog progesterone
PRL prolactin
QC quality control
RI reference interval
RMP reference measurement procedure RT reference tests used in the LAVE method
RUS Russia
RV reference value
rp partial correlation coefficient
SAU Saudi Arabia
SD standard deviation
SDR standard deviation ratio
Sk skewness
SV sources of variation
TBil total bilirubin
Testo testosterone
TC total cholesterol
Tf transferrin
TG triglycerides
TP total protein
TUR Turkey
TSH thyroid stimulating hormone
UA uric acid
UL upper limit
concrete objectives were to address the issues listed below and to devel-op a comprehensible picture of the most rational way of conducting the RI study in an internationally harmonized way.
1) How strictly should we set-up exclusion criteria in recruitment of candidate reference individuals? It may differ from country to country.
2) In what situation is it necessary to exclude individuals secondarily? What is the rational method to do so?
3) Why not just use a nonparametric method for statistical derivation of the RI? Does the parametric method give the RI reproducibility for each analyte?
4) How comparable are the RVs if the analytes are supposed to be glob-ally standardized?
5) How reliable is the scheme of aligning RVs based on panel test re-sults measured in common?
6) Are there ethnic or regional effects in the RVs?
7) Are major sources of variations (sex, age, BMI, etc.) of RVs the same among the countries?
As of August 2015, the global study involved 17 countries from 5 continents, the majority of which sought to establish country-specific RIs. In this intermediary report, as thefirst part of the key note article for the study, the methodologies in common use are briefly described, and the analytical results from 12 countries that had completed their studies were evaluated collectively for addressing thefirstfive of the above issues. Evaluation for the issues (6) and (7) will be presented in a second report[14].
2. Methods
2.1. The common protocol for the study
The study protocol[13]commonly used in each country is briefly de-scribed as follows:
2.1.1. Recruitment
The target population was apparently healthy individuals 18–
65 years of age with equal gender and age distributions. Those above 65 years were also included, even with small sample sizes. The test re-sults of that age range were not used for any data analysis except in making profiles for sex- and age-related changes of reference values for the extended age range.
All potential participants should be feeling subjectively well. Any subject taking medications or vitamin supplements had them recorded (name, dose and frequency) so that secondary exclusion after measument could be done as required. The following medications were re-corded but permitted: contraceptive pills or estrogens, plus thyroxine if the subject was maintained in a euthyroid state (TSHbupper refer-ence limit).
Exclusion criteria were known diabetes on oral therapy or insulin (diet alone is acceptable); a history of chronic liver or kidney disease; blood test results that clearly point to a severe disease; a history of being a hospital inpatient or otherwise seriously ill during the previous 4 weeks; blood donation in the previous 3 months; known carrier state for HBV, HCV, or HIV; female participants who were pregnant, breast feeding, or within one year after childbirth; any other significant disease or disorder which, in the opinion of the investigator, might either put the participants at risk because of participation in the study or might
in-fluence the results of the study; or participation in another research study involving an investigational product in the past 12 weeks.
2.1.2. Sampling, storage and measurements
Blood sampling from the volunteers was done under basal condi-tions, including overnight fasting ofN10 h, sitting for at least 20 min prior to sampling, and avoidance of strenuous muscular exertion for three days or working a night shift before the sampling. Sera were
separated soon after sampling and stored immediately at−80 °C. This was because all specimens were tested collectively in batches in each country's central laboratory regardless of the time of sampling.
2.1.3. Target analytes and measurements
The 50 target analytes for the study were as described in the com-mon protocol[13]and were composed of standardized analytes (lipids, electrolytes, enzymes, major serum proteins) and non-standardized but harmonizable analytes (inflammatory and tumor markers, hormones and vitamins). All were measured in the serum samples by use of auto-mated analyzers employed in each central laboratory for routine use. Quality control of the assays was performed by use of commercial QC sera of routine use and the mini panel composed of 5−6 sera from healthy individuals[5].
2.2. The serum panel and assignment of traceable values for standardization
Two serum panels were produced by the C-RIDL in 2011 and in 2014, respectively composed of 80 (all Japanese) and 100 (70 Japanese; 30 from other ethnicities) sera from healthy individuals with nearly equal gender and age (20–65 years) proportions. The scheme of the value as-signment for thefirst panel for standardized analytes was described pre-viously[5,13]. The second panel was divided into two parts, one for chemistry analytes including those measured by immunoturbidimetry, and the other for analytes measured by other immunoassays. Assign-ment of values traceable to the reference measureAssign-ment procedures (RMPs) forfive chemistry analytes (TC, TG, urea, UA, Cre), and for seven enzymes (AST, ALT, LDH, GGT, ALP, CK, AMY) was performed by reference laboratories associated with the Committee on Traceability of Laboratory Medicine (C-TLM) of IFCC: the University of Bonn Faculty of Medicine (led by Dr. Anja Kessler and Prof. Lother Siekmann) and the Hanover University School of Medicine (Prof. Gerhard Schumann).
More specifically, for thefirstfive analytes, six sera out of the 50 chemistry part of the panel were chosen for each analyte so that their values covered a wide portion of the presumptive RIs: i.e., a total of 25 sera (3–6 levels × 5 analytes) were directly value assigned. The indirect value assignment was accomplished by col-laborative measurement of all 50 sera infive leading laboratories in China (Beijing Union Medical School Hospital, Beijing), South Af-rica (PathCare Laboratories, Cape Town), Japan (Beckman-Coulter Laboratory, Mishima, Shizuoka), and Canada (Hamilton General Hospital, Hamilton, Ontario). Based on the linear relationship be-tween the assigned and measured values for the 3–6 sera, all 50 test results were recalibrated. Finally, the average recalibrated values for each of the 50 sera were adopted as the indirectly assigned values.
For the 7 enzymes, three pooled sera with different enzyme activi-ties covering the presumptive RIs werefirst prepared for each enzyme. The 3 × 7 pooled sera were then value assigned directly for use as the calibrators. The 50 sera in the chemistry part of the panel were assigned values of their enzyme activities indirectly by use of the three sets of cal-ibrators for each enzyme.
The list of assigned values for the 50 chemistry samples of the panel is shown in Suppl. Table 1, which also includes tables of assigned values for thefirst serum panel both in SI and conventional units[5].
2.3. Alignment/harmonization of reference values among the countries
The basic scheme for conducting the global study was to make test results comparable among the countries based on the panel test results measured in common. All pairwise method comparisons were per-formed by use of major-axis linear regression analysis (MALRA)[12]. As a result, even if values from a laboratory were biased despite the as-sumption of standardization, accurate comparison across the countries was still possible by recalibration of results from all the laboratories into those matched to assigned values of the panel in the case of
3 K. Ichihara et al. / Clinica Chimica Acta xxx (2016) xxx–xxx
standardized analytes. In the case of non-standardized analytes, test re-sults from any country were aligned to those of a specified country for harmonized comparison of reference values.
In order to perform this recalibration or alignment procedure appro-priately, the allowable limits of errors in converting values were formu-lated based on the theory of allowable analytic errors[5,12]. The theory in brief is as follows. The precision of RI limits (LL, UL), converted from one laboratory to another, based on the major-axis regression can be expressed in two ways. Thefirst is by the SD ratio (SDR) of the standard error (SE) of LL or UL to the SD comprising RI [(UL-LL)/3.92], SDRLL
(=SELL/SDRI) or SDRUL(=SEUL/SDRI). The other is by the CV of the
re-gression slope b, CV(b). Analogous with the theory of allowable analyt-ical bias[15], SDR≤0.125 is regarded as optimal, and SDR≤0.25 as desirable. We demonstrated that there was a close linear relationship between CV(b) and SDRLLor SDRUL[12], and SDR = 0.125 corresponded
to CV(b) = 5.5%, and SDR = 0.25 to CV(b) = 11.0%. In this study, for aligning test results of any given analyte by the regression, we regarded CV(b)≤5.5% as indicating the conversion error is at the“optimal”level, and 5.5bCV(b)≤8.0% as indicating“acceptable”. No alignment proce-dure was performed if CV(b)≥8.0%.
2.4. Statistical analysis
2.4.1. Expression of between-group differences based on ANOVA
The magnitude of between-country or between-region differences was expressed as SDR. By use of one-way ANOVA, between-country SD (SDcnt) and net between-individual SD (SDBI) (after adjusting for
the between-country variations) were calculated and their ratio was set as the SDR[5]. Analogous to the theory of allowable analytical bias, the critical limit for SDR (= SDcnt/SDBI) can be set to 0.25. However,
the denominator, SDRI, tends to be narrower when it is computed by
ANOVA, especially by use of two or more-level nested ANOVA with suc-cessive subtraction of factor-dependent variations. This implies that the SDR is increased in proportion to a decrease of its denominator; there-fore, we chose 0.3 rather than 0.25 as a guide for judging the practical implication of between-country differences. In this calculation of SDR, reference values of analytes with obviously skewed distributions, such as TG, ALT, GGT, and CRP (their names are marked by asterisks inFig. 3), were logarithmically transformed before applying the ANOVA, and then, SDs in untransformed scales were computed through a method of reverse transformation as described previously[16].
2.4.2. Latent abnormal values exclusion (LAVE) method
Inevitably some individuals who had commonly-occurring latent diseases or who failed to observe the basal conditions required before sampling were included in the study population. To overcome this prob-lem, the LAVE method was developed, which makes use of the associa-tions between abnormal values found in different analytes which are caused by common disorders such as the metabolic syndrome, muscular damage and latent inflammation. LAVE is an iterative optimization method for refining reference individuals by excluding subjects possessing abnormal values in related analytes[2,4,5]. Its advantageous features are (1) truncation of reference distributions does not occur, un-like conventional methods of outlier exclusion, because it excludes indi-viduals who have results outside RIs of analytes other than the one for which the RI is being derived, and (2) there is no effect on analytes whose values are rarely outside the RI in healthy individuals. The disad-vantage is a reduction in the number of subjects included in the statis-tics, but this reduction should be minimal, depending on how strictly the exclusion criteria have been set and how many extreme values are allowed in the selection process. In this study, 10 analytes (Alb, UA, Glu, TG, AST, ALT, LDH, GGT, CK, CRP) were set as reference tests (RTs), and one value outside the RI was allowed among them. In the procedure, the RI (LL–UL) of RTs was extended on both ends by 5% of the width of the RI, or (UL–LL) × 0.05. Therefore, assuming a Gaussian distribution of RVs, the extended RI (RI’) corresponded to the
mean ± 2.156 SD or the central 97% ranges of RVs[2]. The probability (Pr) of having two or more abnormal results in“fully normal” individ-uals is computed by use of 10 RTs with assumption of no association of test values among the RTs.
Pr two or more values outside RIð ’Þ
¼1−Pr no value outside RIð ’Þ−Pr one outside RIð ’Þ ¼1:0−ð0:97Þ10
−10C1ð0:97Þ9ð0:03Þ1
Therefore, the influence of the LAVE procedure is not great in deriv-ing the RI as a central 95% range. On the other hand, if test results of RTs are associated with each other, and there exist individuals with latent abnormal results among RTs, reduction in the data size remaining as
“full normal”will be greatly reduced. In this study, the performance of the LAVE methods was evaluated by comparing the RIs determined with or without applying it in various ways.
2.4.3. Derivation of the RI and 90% confidence interval (CI) of the RI limits
The RIs were derived using both parametric and nonparametric methods.
For the parametric method, reference values werefirst transformed to Gaussian by use of a modified Box-Cox equation[2,4]:
X¼ðx−aÞ
p −1
p:
From the mean and SD in the transformed scale (mT, SDT), the
central 95% interval was given as mT± 1.96 SDT. Then, the lower limit (LLT= mT−1.96 SDT) and upper limit (ULT= mT+ 1.96
SDT) were back-transformed to obtain the RI (LL ~ UL) in the original
scale as follow:
LL¼pLLTþ11p
þa UL¼pULTþ11p þa
For the nonparametric method, reference values werefirst sorted, and the 2.5 and 97.5 percentile points were determined. The 90% CI for the LL and UL were predicted by the bootstrap method with repeti-tive resampling of 100 times both for the parametric and nonparametric methods. For smoothing the RI, average values for LL, Me, and UL were adopted as thefinal RI.
3. Results
3.1. The source data assembled
3.1.1. Composition of healthy volunteers from 12 countries
Included in this intermediary report were the results from 12 coun-tries: China (CHN), Japan (JPN), Philippines (PHL), India (IND), Pakistan (PAK), Saudi Arabia (SAU), Turkey (TUR), Russia (RUS), UK (GBR), South Africa (ZAF), USA, and Argentina (ARG). The demographic
pro-files of each country's study are summarized inTable 1. The total num-ber of subjects was 13,396 (male 6347; female 7049).
No ethnicity related distinctions of individuals were made for any countries except South Africa, where RVs were partitioned as Africans and non-Africans. The following are the known ethnic composition of the study subjects from countries other than South Africa. Japan: all Jap-anese; China: all Han Chinese; India: all Indian; the Philippines: the vast majority were Filipino; Pakistan: all Pakistani; Saudi Arabia: all Saudi; UK: the majority (82%) were British; Turkey: no characterization by eth-nicity was made; Russia: all Caucasian; USA: the majority were Cauca-sian Americans; Argentina: the majority were CaucaCauca-sian. Please note that no within country regional differences were observed in China
[17], Japan[18], Saudi Arabia[19], and Turkey[20].
Table 1
Demographic profiles of each country's study.
Male Female
N by age BMI Drk (%) Smk (%) drug Tx% N by age BMI Drk (%) Smk (%) drug Tx%
Area Central lab N all 18−65 66~ dHT dDL
dHU
HR Thy all 18−65 66~ dHT dDL
dHU OC
China Nationwide Beijing Union Hosp 2621 1249 1163 86 23.6 ± 3.0 23.5 29.1 3.2 0.2 0.1 1372 1279 93 22.3 ± 2.9 2.0 0.8 3.4 0.7 0.0
Chongqing 527 260 240 20 23.1 ± 2.5 39.6 42.3 0.4 0.0 0.0 267 251 16 21.9 ± 2.4 2.2 2.6 0.4 0.0 0.0
Japan Ube, Osaka, Hiroshima, BC Mishima Laboratory 655 295 264 31 22.9 ± 2.6 53.6 19.3 8.8 2.7 0.3 360 324 36 21.0 ± 2.5 40.0 10.0 5.0 5.3 1.4
India Mumbai P.D.Hinduja National
Hosp
512 257 244 13 24.6 ± 3.5 24.5 7.8 4.3 0.0 1.2 255 247 8 24.5 ± 4.4 2.7 0.4 3.1 0.4 0.0
Philippines Iloilo city BC Mishima, Japan 757 246 245 1 23.0 ± 3.8 20.3 24.0 8.1 0.0 0.0 511 508 3 23.2 ± 4.2 1.6 6.1 7.0 0.2 5.9
Pakistan Panjab Armed Force Instit of
Pathology
561 311 303 8 24.1 ± 3.6 3.2 2.9 0.0 0.0 0.0 250 246 4 25.0 ± 4.7 6.8 0.8 0.0 0.0 0.0
Saudi Arabia
Jeddah, Hassa Riyadh, King Khalid National
Guard Hosp, Jeddah
822 396 389 7 28.5 ± 5.6 0.0 16.9 1.0 4.5 0.0 426 418 8 28.0 ± 6.1 0.0 1.9 1.4 2.3 0.2
Turkey Nationwide Uludag University 3172 1589 1450 139 26.6 ± 3.6 10.2 24.6 3.7 0.9 0.3 1583 1440 143 25.7 ± 4.9 8 21 5.5 0.7 0.0
Russia Moscow, Yekaterinburg,
St Petersburg,
Helix Laboratories 796 370 340 30 26.6 ± 4.5 43.0 31.1 2.4 0.0 0.0 426 381 45 25.3 ± 5.6 39.2 16.0 3.1 0.7 3.1
UK Leeds Leeds Infirmary 301 114 113 1 26.0 ± 3.3 78.1 8.8 2.6 0.0 0.9 187 179 8 25.5 ± 4.3 69.0 10.2 3.7 0.0 0.0
South Africa (African)
Cape Town, Johannesburg PathCare Laboratories 651 340 333 7 26.0 ± 5.8 5.6 1.8 0.0 0.0 0.0 311 304 7 27.5 ± 5.9 3.5 0.3 0.0 0.0 0.3
South Africa (Non African)
594 199 194 5 25.9 ± 3.7 56.3 13.6 1.0 2.0 0.0 395 379 16 24.6 ± 4.3 48.9 12.7 1.8 0.8 12.2
US Rochester, MN Mayo Clinic 244 92 84 8 27.2 ± 5.1 65.2 5.4 5.4 8.7 4.3 152 135 17 26.2 ± 5.2 66.4 3.3 7.9 7.2 15.1
Salt Lake, UT ARUP Lab 250 125 119 6 28.7 ± 5.8 36.8 4.0 7.2 4.8 1.6 125 120 5 27.0 ± 6.9 50.4 4.8 3.2 2.4 9.6
Davis, CA BC Mishima, JPN 395 191 169 22 25.6 ± 3.6 79.6 5.2 5.2 1.6 1.6 204 172 32 24.8 ± 5.1 69.6 2.0 7.8 1.5 11.8
Argentina Buenos Aires Univ of Buenos Aires 528 313 313 0 27.3 ± 4.0 47.0 22.7 3.8 1.0 0.0 215 213 2 25.4 ± 4.8 38.1 27.9 3.7 0.0 0.0
Total 13386 6347 5963 384 23.9 20.9 3.32 1.06 0.32 7039 6596 443 15.3 9.08 3.8 1.1 2.3
BMI: body mass index (mean ± SD); Drk: alcohol intake; Smk: smoking; drug Tx%: % under drug therapy; dHT: drug for hypertension; dDL: drug for dyslipidemia; dHU: drug for hyperuricemia; HR Thy: thyroid hormone replacement; OC: oral contraceptive or female hormones
shown in Suppl. Figs. 1-1 and 1-2. Distributions of BMI differed greatly among the countries. The influence of these factors on the analysis of RVs will be described in part 2 of this report[14]. The pro-portions of those who smoked cigarettes were quite comparable among the countries. In contrast, the proportions of individuals who drank occasionally or regularly differed greatly between coun-tries, partly for religious reasons.
For medications, we focused on drugs for hypertension (dHT) and drugs for dyslipidemia and hyperuricemia (dDL and dHU), all of which are known to affect test results for some analytes. Although the propor-tions of individuals taking either or both categories of drugs were low, those taking dHT were excluded from the analysis of UA, urea, Cre, and K, those taking dDL from the analysis of lipids, and those taking dHU from the analysis of UA. Oral contraceptives (OC) are reported to be associated with changes in serum levels of some chemistry analytes
[21]. From a preliminary analysis, we found TG were higher and Alb and ALP were lower in users of OCs with their between users and non-users SDR ranging from 0.3 to 0.65. Therefore, in the analysis of the three analytes, we excluded individuals on OC (or receiving female hormone replacement therapy) in countries where the proportions of OC users wereN5.0% (US 12.4%, Non-African in South Africa 12.9%, PHL 5.9%) of females, while those in other countries with the proportion between 0–3.1% were neglected (Table 1).
3.1.2. Analytes and measurements
Analytes measured in each country are listed in Suppl. Table 1. Serum proteins (CRP, IgG, IgA, IgM, C3,C4, TTR, and Tf) were measured by immunoturbidimetry and grouped with the general chemistry analytes. Most of the analytes except these specific serum proteins were measured in all countries; the analytes measured by so-called la-beled immunoassays were less frequently measured because of the cost of reagents.
3.2. Correlations of panel test results among countries
The serum panel of thefirst lot (Panel-I) was assayed by all countries except Pakistan and the Philippines, which used the panel of the second lot (Panel-II). South Africa measured both panels on two occasions.
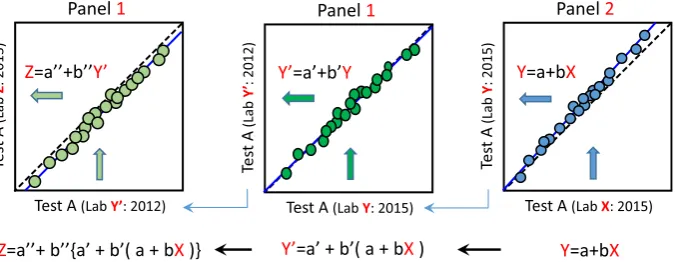
The relationships between Panel I and II were evaluated in the Beckman Coulter Laboratory (Y) in Japan by parallel measurements of both panels. Then, the relationships between the new and past mea-surements of Panel-I (Y vs. Y′) were evaluated. Test results of almost all analytes were nearly identical (Y≈Y′), with only a few analytes
showing bias that required recalibration by use of the linear equation Y′= a + bY. Using these linear relationships, it was possible to convert test result X from Lab-X (Pakistan, South Africa) which measured Panel II to test result Z of Lab-Z which measured Panel I. As illustrated inFig. 1, this cross-conversion becomes possible byfirst converting X to value Y of Lab-Y, which measured both Panel I and Panel II simultaneously. This conversion of X to Y is done by use of the regression equation for Panel-II test results: Y = a + bX. Then, from the relationship between the new and past values (Y and Y′) for Panel I in Lab-Y: Y′= a′+ b′Y, value X is further converted to value Y′: Y′= a′+ b′(a + bX). Finally, from the lin-ear relationship between Y′and Z for Panel I: Z = a″+ b″Y′, X was fur-ther converted to Z by use of the formula: Z = a″+ b″{a′+ b′(a + bX)}.
By use of this conversion scheme in comparing test results among the countries, all the test results of countries which measured Panel II were alignedfirst to the values of Japan at the time of measuring Panel I in 2012. Then, further conversions were done if necessary de-pending on to which country's values the alignment was to be made. Since the above procedure results in additive errors with successive conversions, we applied CV(b)≤5.5, not 8.0%, as the allowable limit of conversion for the analysis of data from Pakistan, the Philippines, and South Africa.
Actual test results of each participating laboratory, and assigned values, if any, for thefirst and second lots of the serum panel are shown in Suppl. Fig. 2 by use of a correlation matrix graph.
3.3. Comparison of reference values among the countries before and after alignment
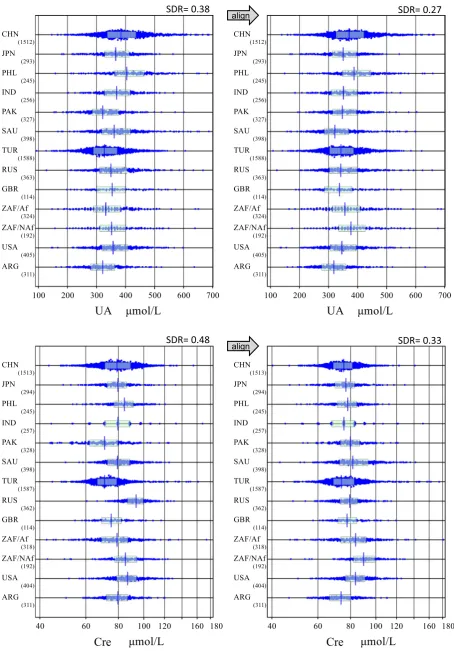
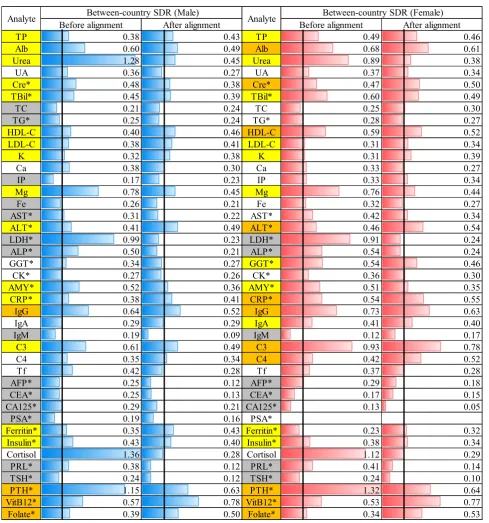
[image:6.595.127.465.536.667.2]In order to compare reference values among the countries, reference values were all aligned to the assigned values for the analytes listed in Supp. Table 1 (TP, Cre, UA, urea, TBil, TC, TG, HDL-C, LDL-C, Ca, IP, AST, ALT, GGT, CK, GGT, CRP, IgG, IgA, IgM, C3,C4, Tf, and TTR); they were otherwise aligned to the values measured in Japan based on pairwise linear regression analysis of the panel test results between assigned/ Japanese values and each country's values. Typical results are shown for UA and Cre inFig. 2, with full results posted as Suppl. Figs. 1-1 and 1-2, for males and females, respectively. SDRs for between-country dif-ferences (SDRcnt) before and after alignment are shown at the top of each graph. The full list of SDRcnt computed separately for each sex is shown for 42 analytes inFig. 3. Not included in the list are those analytes which were measured byb6 countries (GH andfive sex hormones: tes-tosterone, estradiol, progesterone, LH, and FSH). For two analytes (Na
SDR= 0.48
alignSDR= 0.33
[image:7.595.73.528.51.703.2]SDR= 0.38
alignSDR= 0.27
Fig. 2.Comparison of RVs across the countries before and after alignments. The distribution of RVs for males were compared before and after alignment based on the panel test results. The box and center line in each scattergram represents the mid 50% range and median of RVs, respectively. The data size are shown to the right bottom of the country name. Af and NAf for ZAF represent African and Non-African population. SDR for between-country differences is shown on the right upper corner. The graphs are shown for two typical analytes (UA and Cre). Full figures are available in Suppl Figs. 1-1 and 1-2.
7 K. Ichihara et al. / Clinica Chimica Acta xxx (2016) xxx–xxx
and Cl), it was not possible to align values across the countries because of the large CV(b).
Using SDRcnt≥0.3 as a guide, prominent reduction in SDRcnt after alignment was observed for urea, LDH, Mg, cortisol, and PTH. Apparent between-county differences even after alignment were observed in many analytes in males (M) or in females (F): Those with SDRcntN0.5 were Alb, Mg, TBil (F), HDL-C (F), ALT(F), CRP(F), IgG, C3(F), VitB12, and Folate (F). However, the between-country differences observed were crude ones not adjusted for any possible influences on test results.
The most important factor which may confound the between-country differences is BMI, which differed widely from one country to another. The issues of adjusted comparison and multivariate evaluation of sources of variation (SV) are presented in the second part of this report[14].
3.4. Assessment of need for secondary exclusions
[image:8.595.51.541.48.572.2]comprehensible comparisons among the countries were made regard-ing differences of RIs between parametric and nonparametric methods, and with or without application of LAVE methods.
Three methods of deriving the RIs were compared: (1) nonparamet-ric method without LAVE [NP-LAVE(−): CLSI method], (2) parametric method without LAVE [P-LAVE(−)] and (3) parametric method with LAVE allowing one abnormal result (value outside the slightly extended RI) in the reference analytes [P-LAVE(+)]. Since the target disorders or conditions which have high prevalence among apparently healthy indi-viduals were those related to nutritional status or muscular damage, we chose the 10 analytes listed in the Methods section as the standard ref-erence analytes to detect individuals with multiple abnormal values.
As typical examples, inFig. 4, nine clinical chemistry analytes were chosen for evaluation: three for LAVE insensitive analytes (urea, Cre, K) and six LAVE sensitive ones (AST, ALT, LDH, GGT, TG, and CK). Data were limited to those of males because of their higher prevalence of the metabolic syndrome. The minimum number of subjects included in a data set was 300 males. This criterion led to inclusion of the follow-ing 7 countries: CHN, SAU, TUR, RUS, ZAF, USA, and ARG.
As expected, with regard to urea, Cre, and K, there were no changes in RI regardless of LAVE method, while the nonparametric method gen-erally gave slightly wider RIs (higher ULs). For TG, AST, ALT, LDH, GGT and CK, there was a consistent tendency for reduction of the UL of RIs regardless of the country. ULs of RIs by the nonparametric method al-ways were higher than those of the parametric method.
With application of the LAVE method, the reduction in data size for calculation of the RI was between 15 and 22%, pointing to worldwide high prevalence of latent abnormal values attributable to nutritional disorders or failure in complying with the pre-sampling requirements (muscular exertion, insufficient resting/fasting). Please note that the slightly smaller data size analyzed by the parametric method compared to the nonparametric method despite non-use of the LAVE method was due to the exclusion of values outside mean ± 2.81 SD once after Gauss-ian transformation in applying the parametric method. This procedure of removing influential data points in the periphery is required for an improved result in the parameterfitting. This fact partly explains why the nonparametric method gave higher ULs than the parametric meth-od for almost all the analytes examined.
3.5. Consistency of the reference distributions and appropriateness of Gaussian transformations
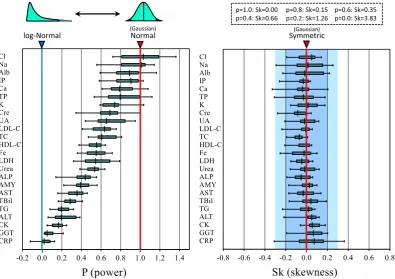
RIs for 24 chemistry analytes were derived by the parametric meth-od separately for males and females using the datasets from 10 coun-tries (the UK was not included because of insufficient data size). The modified Box-Cox power transformation formula was used to make each reference distribution Gaussian (normal). The maximum likeli-hood method was used to predict power (p), and then the origin of transformation‘a’was optimized to the predictive p, iteratively. The value p represents the distribution pattern; i.e.,pb1.0 implies the distri-bution has a longer tail in its higher side;p= 1.0, Gaussian (normal) pattern or symmetrical;pN1.0, the distribution has a longer tail in its lower side; p≈0.0, log-normal.
In the left panel ofFig. 5, the distributions of the‘p’consisting of 20 points (10 countries × 2 sexes) were depicted for each analyte as box and whisker plots with their spans representing the central 50% and 90% ranges, respectively; 90% was chosen rather than 95% because of the small sample size. It is notable that almost all of thepvalues are
below 1.0, implying that the reference distributions have a tendency of more or less larger tail toward the higher side of values. It is also of note that each analyte has its own distribution pattern regardless of the country. We found that the distribution pattern expressed as‘p’
does not differ between the two sexes. From thefigure, we can roughly categorize the analytes from the p value as follows: highly skewed (pb0.25: very close to the logarithmic normal distribution), CRP, GGT, CK, ALT, and TG; moderately skewed (0.25≤pb0.4: cube-root normal): TBil, AST, and AMY; slightly skewed (0.4≤pb0.7: square-root normal): ALP, Urea, LDH, Fe, HDL-C, TC, LDL-C, UA, Cre, and K; almost normal ( 0.7≤p ): Cl, Na, Alb, IP, Ca, and TP.
The success of the Box-Cox formula in transforming the reference distribution into the Gaussian pattern was evaluated by computing the skewness (Sk)[22], which reflects the degree of symmetry of the distribution. In the right panel ofFig. 5, the distributions of Sk computed after Gaussian transformation are depicted for each analyte using the same drawing scheme as the left panel. As shown on the top right, the Sk values for Gaussian (p= 1.0) and log-Gaussian (p= 0.0) dis-tributions are theoretically 0.0 and 3.8, respectively, while the distribu-tions with | Sk |b0.2 are almost indistinguishable from the Gaussian distribution by inspection. It is obvious from thefigure that the
modi-fied Box-Cox formula was very successful in transforming the reference distributions into Gaussian form in the vast majority of the cases. The conformity of power-transformed values to the Gaussian distribution was also evaluated by performing three statistical tests (test of skew-ness,χ2test of goodness-of-fit, and Kolmogorov–Smirnov test) and by
visual inspection of probability plots (cumulative frequency on Y-axis and a power-transformed value on X-axis). Used for those evaluations were two examples of male datasets from Saudi Arabia and Japan that remained after the application of the LAVE method. Thefinal data sizes were approximately 320 and 215, respectively.
Although the statistical testing of the datasets with those data sizes is generally very sensitive to a slight deviation from the Gaussian form, power-transformed values of any analytes were almost invariably judged as not significant (Suppl. Table 3). The probability plot (Suppl. Fig. 3) also showed linearity for its main segment (cumulative frequen-cies of 10–90%), except for the CRP dataset from Japan which required non-parametric derivation of its RI.
Thesefindings support the reproducibility and accuracy of the para-metric method in estimating the central 95% range of the reference distribution.
4. Discussion
The choice of appropriate reference individuals for the study of RIs (RI study) is a challenging problem. It is expected that reference individ-uals are healthy without any disease or condition which affects test re-sults of the analyte for which the RI is being determined. It is usually essential to determine RIs for as many analytes as practical in the same samples for the sake of efficiency. However, it is difficult tofind in-dividuals who fulfill“normal”requirements for all the analytes. Further-more, it is not easy to identify individuals who have latent disorders beforehand without the actual tests being evaluated. If the prevalence of a disorder is low, this does not pose a problem in determining the RIs. In contrast, if the prevalence is relatively high, it is crucial either to apply very strict exclusion criteria in recruitment or to apply secondary exclusion after testing.
Fig. 4.Comparison of RIs and their 90%CI derived in three ways. RIs were derived in three ways by nonparametric (NP) or parametric (P) method with/without LAVE method. Each RI was depicted by the horizontal bar with shades on both ends corresponding to the 90%CI derived by the bootstrap method. LAVE method was applied by use of the following test items as reference for exclusion: Alb, UA, Glu, TG, AST, ALT, LDH, GGT, CK, and CRP. They are reliable markers of nutritional derangement, muscular exertion or inflammation which constitute latent disorders commonly seen in apparent healthy individuals. Data sizes used for computation of the RIs after the selection process are shown next to the Y-axis for each subgroup. Nine analytes were chosen for contrasting the effect of LAVE: top-three as LAVE-insensitive, and other six as LAVE-sensitive analytes. Since the RIs were derived for male subgroup with data size of≥300, the number of countries fulfilling the condition were 7: China (CHN), Saudi Arabia (SAU), Turkey (TUR), Russian (RUS), African of South Africa (ZAF) not including non-African, USA, and Argentina (ARG).
9 K. Ichihara et al. / Clinica Chimica Acta xxx (2016) xxx–xxx
In the global study, the objective was to have a harmonizable, prag-matic protocol for conducting the RI study which could be applicable to all participating countries. Therefore, we had to apply a lenient policy for recruitment without setting any limitation to BMI, habits of alcohol drink or smoking, and even use of common medications, as long as the individuals were feeling healthy and did not have any chronic renal or hepatic disorder or a past history of significant diseases.
This policy inevitably required us to apply secondary exclusions criteria customized to each analyte and to some countries. The exclusion was done on an analyte by analyte basis for those on medications. For example, for subjects who were on medication or supplements which may affect lipids, Fe, Ca, vitamin D, B12, and folate were excluded. A sim-ilar approach was taken for subjects on antihypertensive drugs which may affect urea, UA, Cre, and K values. However, the percentage of indi-viduals who were on these drugs was low (b10% for individuals over 50 years of age), indicating reasonable self-restraint on the part of volunteers.
Aside from medications, it is most important to remove the influence of latent diseases or commonly-occurring conditions as much as possi-ble. In the CLSI/IFCC document EP28-A3c, this problem is treated as a univariate issue and thus outlier exclusion methods, such as the Dixon method[23]or Tukey method[24], are listed, although EP28-A3c dis-courages them, emphasizing the need for proper selection of individuals in thefirst place. In general, the outlier exclusion is applicable only to data of a very small sample size. For a larger sample size, there is no such concept as outliers but a cluster of abnormal results, and thus, re-peated application of outlier exclusion leads to truncation of the refer-ence distribution without prior transformation of RVs. In the global study the LAVE method was adopted as the solution, which corresponds to a multivariate approach depending on co-occurrence of abnormal re-sults among mutually related analytes. However, appropriate selection of“reference analytes”which are used to judge the latent disorders is crucial. Since the most common disorders or conditions which affect
the basic laboratory tests are the metabolic syndrome, strenuous exer-cise-related muscular damage, and sampling without fasting or enough resting, for the clinical chemistry analytes, the following 10 tests were chosen as the reference: Alb, UA, Glu, TG, AST, ALT, GGT, LDH, CK, and CRP. Most of them are known to be affected by nutritional status and by chronic inflammation, and CK, LDH and AST reflect muscular dam-age. There have been almost consistent reports indicating that TG, AST, ALT, GGT, LDH, CK, and CRP are LAVE-sensitive analytes[16–20, 25,26]. We confirmed thisfinding by looking at the RIs with or without LAVE among the countries as shown inFig. 4. The consistentfinding of a fairly large reduction in data size in any country indicates that a sizable number of inappropriate results are invariably present and should be processed multivariately by use of LAVE method, not univariately by use of outlier detection methods.
On the other hand, for urea, Cre, and K, no difference of the RIs were observed regardless of the use of the LAVE method in any country. For those analytes the LAVE method is of no use and leads only to reduction of the sample size and expansion of the 90% CI of the RI.
[image:11.595.105.501.52.331.2]The possibility of too great a reduction in data size by applying the LAVE method can be a concern. The relative decrease in data size can be reduced if we apply stricter exclusion criteria at the time of recruit-ment. In reality, however, that policy makes it difficult to recruit a suffi -cient number of volunteers. On the other hand, the LAVE method can be applied in a looser way either by allowing up to two abnormal results among the reference analytes, or by a 2 to 5% expansion of the RI limits (LL, UL) of each reference analyte in judging abnormality. In fact, the LAVE method is a pragmatic solution to optimize the RI in face of an un-certain number of inappropriate results. Therefore, procedures for ap-plying LAVE have to be determined on a trial and error basis and are thus dependent on the policy of the organizer of the study. Despite this empirical nature of the LAVE method, with the consistency of its ef-fect across the countries, the LAVE based RIs are currently accepted by all the collaborating investigators.
Fig. 5.The power (p) required for Gaussian transformation of reference values and the skewness after the transformation. In the process of deriving the RIs by use of parametric method, the distribution pattern of RVs were predicted as the power (p) by regression to the modified Box-Cox formula for Gaussian transformation. The success of the transformation was assessed by the skewness (Sk) of the distribution: i.e., |Sk|≤0.2 indistinguishable from Gaussian pattern and |Sk|≤0.3 very close to Gaussian pattern. Distribution of 20 p and Sk values, which were obtained from 10 countries in the derivation of RIs separately for males and females, were compared for 24 chemistry analytes. The spans of the box and whisker drawn for each analyte represent central 50% and 90% range of the values.
11 K. Ichihara et al. / Clinica Chimica Acta xxx (2016) xxx–xxx
The reason why the parametric method was not recommended in the CLSI/IFCC guideline was the failure of Gaussian transformation by the Box-Cox transformation[1,27]. Therefore, it has been thought that the pattern of reference distribution is uncertain and cannot be expressed by the known mathematical formula on which the paramet-ric method relied. As expected, the nonparametparamet-ric method was recom-mended instead. However, it has been shown that the parametric method works appropriately when the modified Box-Cox power trans-formation formula is used, which includes the origin of transtrans-formation
‘a’as an additional parameter to befitted[2,4,5]. In this study, by com-piling the intermediary data obtained in the process of computing RIs for each country, it now became clear that the reference distribution can be successfully transformed into the Gaussian pattern almost invari-ably, judged from the virtual lack of skewness after the transformation (Fig. 5, right panel; Suppl. Table 3; Suppl. Fig. 3). As for the controversial view of uncertainty about the distribution pattern of RVs, we have dem-onstrated that, viewed across countries, there is consistent pattern of distributions specific to each analyte (Fig. 5, left panel). This implies that the power required for Gaussian transformation is not determined by chance, but it is predetermined for a given analyte regardless of the countries. In fact, thepvalues (power) of the reference distributions for both males and female were very similar.
Thesefindings imply that the parametric method based on the mod-ified Box-Cox formula is the method of choice for deriving RIs in almost all situations. A known exception is a situation where the reference dis-tribution is truncated on its lower side due to a limited level of assay quantitation. We encountered this problem in the derivation of the RIs for CRP (measured by routine and not high sensitivity methods), PSA in females, rheumatoid factor, and anti-thyroglobulin antibody. It was necessary to use the nonparametric method or a probability plot meth-od for estimating the upper 2.5 or 5% limit. Another situation where the parametric method is not appropriate is when there are only an insuffi -cient number of RVs for computing the RI. The method is sensitive to outlying points with data size below 150. However, this problem is eas-ily overcome by applying the bootstrap resampling method to the same dataset and adopting the average LL and UL as thefinal limits of the RI. We used this smoothing technique both for the parametric and non-parametric methods.
So far we have discussed the C-RIDL task of establishing optimal methodologies for derivation of RIs, which was made possible through the comparison of analytical results gathered from the RI studies around the world. Another important task of C-RIDL was to put together RVs from around the world, overcoming the problems of insufficient stan-dardization or non-harmonized status of assay methods. Our objective was to compare the RVs through harmonization and to investigate the regionality and ethnicity of RVs on a global scale. If successful, the infor-mation we collected is expected to contribute to globalized medical practice.
In the history of laboratory medicine, there have been no attempts to overcome the difficulties in establishing collaborative teams needed to recruit a large number of reference individuals in a harmonized way. Fortunately, toward the end of 2011, several laboratories from 17 coun-tries willingly joined the study in response to the C-RIDL's call for participation.
C-RIDL proposed that to achieve the goal, the key strategy was to produce a serum panel composed of many individual commutable spec-imens and to ask for its measurement by all collaborating laboratories for cross-comparison of the results. Conventionally, a panel of sera has been used mainly as a reference set of specimens for the validation of an assay under evaluation. It was necessary to confirm the feasibility of using it for aligning test results among the countries. In early 2011, 60 sets of the serum panel (thefirst lot), composed of 80 specimens from healthy individuals, were produced, and the feasibility study was carried out in spring of 2011 through collaboration among 4 laborato-ries from the US, Turkey and Japan[12]. The results clearly revealed the usefulness of the panel in aligning test results by pair-wise
comparison of test results among collaborating laboratories, and the concept of allowable limit of error using CV(b) was also elaborated.
From this study, the practicality of the scheme of using the panel for cross-comparison and alignment of RVs has now become obvious. It is of note that some bias existed even for standardized analytes, and it was necessary to make adjustment for proper comparison of the results. Furthermore, the assignment of serum panel values traceable to the RMPs proved to be very useful for recalibration of the RVs and RIs. As an important outcome of the scheme, we showed an absence of between-country differences (SDRcntb0.3) regardless of sex in RVs for TG, Fe, LDH, ALP, IgM, Tf, AFP, CEA, CA125, PSA, cor-tisol, PRL, and TSH. In contrast, prominent differences in both sexes (SDRcntN0.4) were revealed in RVs for TP, TBil, HDL-C, Mg, CRP, IgG, C3, and Vit-B12. It is important to note, however, that thesefi nd-ings need to be confirmed by multivariate analysis to adjust for pos-sible confounding effects of age, BMI and other sources of variation of RVs. The results of the detailed analyses are to be described in the second part of this report[14].
C-RIDL is now considering another utility of the panel: to provide a service of transferring the RIs determined country by country to any party (clinical laboratories or IVD manufacturers) that is interested in confirming, comparing or introducing the RIs without actually conducting an RI study. If some bias is found from the panel test results, the RI can be recalibrated easily based on the regression analysis. If the purpose is just to verify the RIs before transference or just to confirm the standardized status of the assay, it is not necessary to measure all of the sera in the panel. Only 5 to 10 sera are enough if their concentrations are widely apart. Exceptions are some analytes measured by immunoassays showing a high degree of molecular heterogeneity or assay imprecision
[12]. It is notable that certified reference materials (CRMs) currently available are composed of just one to three specimens. Recalibration of any assay based on a few data points is not accurate, no matter how precisely CRMs were measured. In contrast, the specimens in the serum panel are value assigned for many of the standardized analytes. Therefore, only a small fraction of the panel is sufficient for use either to confirm the state of standardization or to recalibrate the RIs more ac-curately than CRMs. However, to make use of the panel for these pur-poses, it is necessary to produce a large number of aliquots of a smaller sub-set of a panel to make them widely available. With this per-spective in mind, the second panel, fully value-assigned for the 12 analytes, was produced in 2014. It is now possible to produce multiple
“secondary”serum panels inheriting the values from the second panel, each of which is composed of a smaller number of sera with traceable values. C-RIDL has now set this as one of the most important activities for the coming years.
5. Conclusion
There were two main objectives in the C-RIDL's global project. One was to establish optimal methodologies for derivation of RIs through analysis of real-world datasets gathered from studies around the world. The other was to put together RVs on a global scale for compar-ison after harmonization and for exploration of the regionality and eth-nicity of these RVs among all countries. Both objectives were achieved as planned, and the controversial issues posted at the beginning of this article were answered as below:
1) The strict criteria for recruitment tailored to each country may not be necessary if investigators in each country make efforts by their own standards of“healthiness”, and the measures below are applied. 2) In the situation where test results from healthy volunteers are
approach), but rather the LAVE method (multivariate approach) de-spite the reduction in the data size.
3) The parametric method is applicable for derivation of the RIs almost invariably. Its validity was suggested from the consistent pattern of reference distributions specific for each analyte. On the other hand, the nonparametric method is applicable but not recommended when abnormal results are expected in test results from healthy in-dividuals because there is no way to fully exclude them non-parametrically.
4) Some bias in the RVs existed even for the standardized analytes. Therefore, it is essential to make cross-comparison of them by use of multiple commutable specimens (serum panel) in conducting the multicenter study for derivation of the RIs.
5) Unbiased comparison of the RVs for most analytes is possible by use of the serum panel regardless of the standardized status of the assay.
Supplementary data to this article can be found online athttp://dx. doi.org/10.1016/j.cca.2016.09.016.
Research funding
A Scientific Research Fund (No. 24256003: 2012–2014) provided by the Japan Society for the Promotion of Science (JSPS) was used to par-tially support local studies (to cover breakfast after sampling for volun-teers, personnel fee for recruitment and sampling, consumables such as sampling equipment) in India, Saudi Arabia, Philippines, US, and Argentina.
Conflict of interest statement
The authors state that there are no conflicts of interest with regard to publication of this article.
Acknowledgement
We are very grateful for the invaluable service of value assignment to the serum panel (produced in 2014) kindly provided by Dr. Anja Kessler and Prof. Lother Siekmann of University of Bonn Faculty of Med-icine, and Prof. Gerhard Schumann of Hanover University School of Medicine. We appreciate Dr. Joseph Marci for his service of measuring the serum Panel-II in the practice of indirect value assignment.
We are also greatly indebted, for the success of this study, to the ear-nest contributions of local coordinators: Dr. Melahat Dirican (Uludag University School of Medicine, Central Laboratory, Bursa, Turkey), Dr. Liangyu Xia (Peking Union Medical College Hospital, Beijing, China), Dr. Mariza Hoffmann (University of Stellenbosch and National Health Laboratory Services, Tygerberg, South Africa), Ms. Janette Wassung (PathCare Laboratories, Cape Town, South Africa), Prof. Tandi Matsha and Mr. Francois Smit (Faculty of Health and Wellness Science, Cape Peninsula University of Technology, Cape Town, South Africa), Dr. Anna Ruzhanskaya (Beckman Coulter LLC, Moscow, Russia), Dr. Irina Skibo (Helix Medical Laboratories, St. Petersburg, Russia), Dr. Swarup Shah (P. D. Hinduja National Hospital and Medical Research Centre, Mumbai, India), Daniel N Bustos (Faculty of Pharmacy and Biochemis-try, University of Buenos Aires, Argentina), Dr. Joely Straseski (Universi-ty of Utah School of Medicine, Salt Lake Ci(Universi-ty, UT, USA), Ms. Ashley Bunker (ARUP Laboratories, Salt Lake City, UT, USA), Dr. Kimber Stan-hope (University of California, Davis, CA, USA), Dr. Katsuyuki Nakajima (Nakajima Associates Inc., Maebashi, Japan), Ms. Mio Nagai (Yamaguchi University Faculty of Health Sciences, Ube, Japan), and Ms. Aki Takahashi (Beckman Coulter Japan).
The study depended a great deal on the support for assay reagents, and thus, we express our sincere gratitude to the US companies Beckman-Coulter and Abbott Laboratories for their generous support
of reagents required for smooth implementation of the local studies. We are also grateful to BD (Becton, Dickinson and Company), the US, for their generous offer of sample collection equipment for use in many of the participating laboratories.
Finally, we are grateful to Professor Andrew M. Johnson for his de-tailed scientific editing of this manuscript.
References
[1] IFCC, CLSI, EP28-A3c document, Defining, Establishing and Verifying Reference In-tervals in the Clinical Laboratory: Approved Guideline, 3rd ed., vol. 28, No. 30, 2010. [2] K. Ichihara, T. Kawai, Determination of reference intervals for 13 plasma proteins based on IFCC international reference preparation (CRM470) and NCCLS proposed guideline (C28-P,1992): trial to select reference individuals by results of screening tests and application of maximal likelihood method, J. Clin. Lab. Anal. 10 (1996) 110–117.
[3] K. Ichihara, T. Kawai, Determination of reference intervals for 13 plasma proteins based on IFCC international reference preparation (CRM470) and NCCLS proposed guideline (C28-P, 1992): a strategy for partitioning reference individuals with vali-dation based on multivariate analysis, J. Clin. Lab. Anal. 11 (1997) 117–124. [4] K. Ichihara, J.C. Boyd, An appraisal of statistical procedures used in derivation of
ref-erence intervals, Clin. Chem. Lab. Med. 48 (2010) 1537–1551.
[5] K. Ichihara, Statistical considerations for harmonization of the global multicenter study on reference values, Clin. Chim. Acta 432 (2014) 108–118.
[6] H. Petersen, P. Rustad, Prerequisites for establishing common reference intervals, Scand. J. Clin. Lab. Invest. 64 (2004) 285–292.
[7] F. Ceriotti, Prerequisites for use of common reference intervals, Clin. Biochem. Rev. 28 (2007) 115–121.
[8] F. Ceriotti, R. Hinzmann, M. Panteghini, Reference intervals: the way forward, Ann. Clin. Biochem. 2009 (46) (2008) 8–17.
[9] P. Rustad, P. Felding, A. Lahti, Proposal for guidelines to establish common biological reference intervals in large geographical areas for biochemical quantities measured frequently in serum and plasma, Clin. Chem. Lab. Med. 42 (2004) 783–791. [10] K. Ichihara, Y. Itoh, W.K. Min, et al., Diagnostic and epidemiological implications of
regional differences in serum concentrations of proteins observed in six Asian cities, Clin. Chem. Lab. Med. 42 (2004) 800–809.
[11]K. Ichihara, Y. Itoh, C.W. Lam, et al., Sources of variation of commonly measured serum analytes in 6 Asian cities and consideration of common reference intervals, Clin. Chem. 54 (2008) 356–365.
[12] K. Ichihara, Y. Ozarda, G. Klee, et al., Utility of a panel of sera for the alignment of test results in the worldwide multicenter study on reference values, Clin. Chem. Lab. Med. 51 (2013) 1007–1025.
[13] Y. Ozarda, K. Ichihara, J.H. Barth, et al., Protocol and standard operating procedures for common use in a worldwide multicenter study on reference values, Clin. Chem. Lab. Med. 51 (2013) 1027–1040.
[14] K. Ichihara, Y. Ozarda, J.H. Barth, et al., A global multicenter study on reference values: 2. Exploration of sources of variation across the countries, Clin. Chim. Acta (2016),http://dx.doi.org/10.1016/j.cca.2016.09.015.
[15] C.G. Fraser, Biological Variation: From Principle to Practice, AACC Press, 2001. [16]K. Ichihara, Y. Itoh, C.W.K. Lam, et al., Sources of variation of commonly measured
serum analytes among 6 Asian cities and consideration of common reference inter-vals, Clin. Chem. 54 (2008) 356–365.
[17] L. Xia, L. Qiu, X. Cheng, et al., Nationwide multicenter reference interval study for 28 common biochemical analytes in China, Medicine 95 (2016), e2915.
[18] K. Ichihara, F. Ceriotti, T.H. Tam, et al., The Asian project for collaborative derivation of reference intervals: (1) strategy and major results of standardized analytes, Clin. Chem. Lab. Med. 51 (2013) 1429–1442.
[19] A. Borai, K. Ichihara, A. Masoud, et al., Establishment of reference intervals of clinical chemistry analytes for adult population in Saudi Arabia: a study conducted as a part of the IFCC global study on reference values, Clin. Chem. Lab. Med. 54 (2016) 843–855. [20] Y. Ozarda, K. Ichihara, D. Aslan, et al., A multicenter nationwide reference intervals study for common biochemical analytes in Turkey using Abbott analyzers, Clin. Chem. Lab. Med. 52 (2014) 1823–1833.
[21] F. Schiele, M. Vincent-Viry, B. Fournier, M. Starck, G. Siest, Biological effects of eleven combined oral contraceptives on serum triglycerides,γ-glutamyltransferase, alka-line phosphatase, bilirubin and other biochemical variables, Clin. Chem. Lab. Med. 36 (1998) 871–878.
[22] L.D. Fisher, G.V. Belle, Descriptive statistics, Biostatistics: A Methodology for the Health Sciences, John Wiley & Sons, New York 1993, pp. 64–65.
[23] W.J. Dixon, Processing data for outliers, Biometrics 9 (1953) 74–89.
[24] J.W. Tukey, Exploratory Data Analysis, Addison-Wesley, Reading, MA, 1977 688. [25] M. Yamakado, K. Ichihara, Y. Matsumoto, et al., Derivation of gender and age-specific
reference intervals from fully normal Japanese individuals and the implications for health screening, Clin. Chim. Acta 447 (2015) 105–114.
[26] K. Ichihara, Y. Yamamoto, T. Hotta, et al., Collaborative derivation of reference inter-vals for major clinical laboratory tests in Japan, Ann. Clin. Biochem. 53 (2016) 347–356.
[27]P.S. Horn, A.J. Pesce, Reference Intervals: A User's Guide, AACC Press, Washington, DC, 2005.
13 K. Ichihara et al. / Clinica Chimica Acta xxx (2016) xxx–xxx