http://www.scirp.org/journal/jwarp ISSN Online: 1945-3108
ISSN Print: 1945-3094
A Simplified Method for the Assessment of
Groundwater Vulnerability to Contamination
Rida Al-Adamat
*, Abdel Al-Rahman Al-Shabeeb
Department of GIS and Remote Sensing, Institute of Earth and Environmental Sciences, Al al-Bayt University, Mafraq, Jordan
Abstract
In this study, an attempt was made to develop a new simplified groundwater vulnerability to contamination index (SGVI). Nine experts in the fields of groundwater, surface water, soil, landuse and GIS were interviewed to develop the new index. They were asked to agree on new parameters that could be used to investigate groundwater vulnerability. Data about such parameters must be affordable and inexpensive. Subsurface parameters were excluded due to the fact that most researchers might not have adequate data about them. The ex-perts agreed that depth to groundwater, soil texture, lineament density, rainfall, topographic slope, drainage density and landuse/land cover parameters should be included in the new vulnerability index. The experts were also asked to give a weight and the ratings for each parameter. The weights given by the experts were subjected to AHP analysis to determine the exact weight for each parame-ter. An area of 3200 km2 in the northern part of Jordan was selected to test the SGVI. The final map of the SGVI showed that most of the area (more than 96%) had moderate-low and moderate-high vulnerability to contamination. The new index was also subjected to statistical analysis, map removal test and map removal sensitivity analysis. The outcomes of these analyses showed that the new index was applicable and could be used in areas where subsurface data was limited or not available.
Keywords
SGVI, Groundwater, Vulnerability, Contamination, AHP
1. Introduction
The maps of Groundwater vulnerability to contamination are important tools used to assist the landuse planners in addressing the problems that groundwater might have as a result of changing the landuse in a certain area. It is also used to predict the pollutants movement in the soil. This will allow planners to modify the po-How to cite this paper: Al-Adamat, R. and
Al-Shabeeb, A.A.-R. (2017) A Simplified Method for the Assessment of Groundwa-ter Vulnerability to Contamination. Journal of Water Resource and Protection, 9, 305- 321.
https://doi.org/10.4236/jwarp.2017.93020
Received: January 29, 2017 Accepted: February 25, 2017 Published: February 28, 2017
Copyright © 2017 by authors and Scientific Research Publishing Inc. This work is licensed under the Creative Commons Attribution International License (CC BY 4.0).
tential harm to groundwater before serious impacts occur [1].
There are several methods used to assess the groundwater vulnerability inclu- ding process-based mathematical models, statistical methods and overlay and in- dexing.
The process-based mathematical models are analytical or numerical solutions of mathematical equations to predict the contaminant transport in both space and time, which distinguish them from the other methods. These methods are con-strained by the lack of data and the computational difficulties [2].
The statistical models are usually used in evaluating, determining, and quanti- fying the association between measures of vulnerability and various types of in-formation that could be related to vulnerability. The use of statistical methods is limited by the requirement for high quality data, cost and time constrains [2].
The overlay and index methods are used for combining maps of parameters considered to be important in contaminant, where each attribute is assigned a numerical score based on its perceived importance [2] [3]. The overlay and index methods rely on simple mathematical representations of expert opinion rather than process representation or empirical data. Their major negative aspect is the fact that assigning numerical values to the descriptive entities and relative weights for the different attributes is subjective.
Examples of the developed overlay and index methods include the following (Table 1):
1. DRASTIC ([4]-[11]). 2. GOD ([12] [13] [14]). 3. EPIK ([15] [16] [17]). 4. SINTACS ([18] [19] [20]). 5. PI ([21]).
6. COP ([11], [17] and [22] [23]).
[image:2.595.206.539.524.750.2]It appears from Table 1 that these methods require subsurface data including
Table 1. Methods and used parameters for groundwater vulnerability assessment.
Parameters Methods
GOD DRASTIC SINTACS EPIK PI COP
Topographic slope
Stream network
Soil
Net recharge
Unsaturated zone
Depth to water
Hydrogeological features
Aquifer hydraulic conductivity
Aquifer thickness
the unsaturated zone (GOD, DRASTIC, SINTACS, EPIK, PI and COP), hydraulic conductivity (DRASTIC and SINTACS) and aquifer thickness (SINTACS). Also, these methods require data about net recharge (DRASTIC, SINTACS, EPIK, PI and COP). These data requirement might restrict researchers and lead them either to estimate or exclude one or more of these parameters. [9] excluded the hydrau- lic conductivity and estimated the net recharge based on an equation derived by [8].
This research is an attempt to derive a Simplified Groundwater Vulnerability Index (SGVI) based on experts’ opinions using available and inexpensive data to assist researchers in assessing groundwater vulnerability as a part of their Envi-ronmental Impact Assessment (EIA).
2. Methodology
2.1. Index Development
The adopted methodology for developing a simplified groundwater vulnerability index (SGVI) was based on the Analytical Hierarchy Process (AHP). AHP is ba- sed upon the construction of a series of Pair-Wise Comparison Matrices (PCMs), which compare each criterion to one another. The scale of PWC is divided from 1 to 9 for PCM elements to estimates the relationship between the criteria on the scale (9, 7, 5, 3, 1) where the value of 1 suggests that the criteria are equally im-portant and a value of 9 leads one to infer that the criterion under consideration is extremely important in relation to the other criterion with which the compa- rison is made [24] (Table 2).
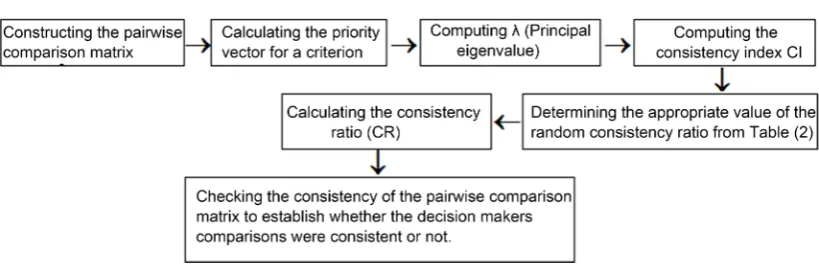
The processes of pairwise comparison matrix that are computed to achieve and check the pairwise comparison matrix is acceptable or not are illustrated in Figure 1 ([25] [26] [27]).
Based on [25] [26] [27], the following Equations were used to calculate λmax, CI, and CR
(
)
max 1 1 . .
n i
n AW W
λ
=∑
= (1)λ represents the sum of consistency vectors divided by number of the consis-tency vector.
[image:3.595.208.539.602.735.2]Where A is the known judgment matrix and n is the order of the matrix B.
Table 2. Scale of relative importance [24].
Intensity of
importance Definition Intensity of importance Definition 1 Equal importance 6 Strong to very strong importance
2 Equal to moderate importance 7 Very strong importance
3 Moderate importance 8 Very to extremely strong
4 Moderate to strong importance 9 Extreme importance
Figure 1. The processes of pairwise comparison matrix.
(
)
1.
CI
=
λ
−
N
n
−
(2)CI represents the consistency index based on the observations of λ.
Where λmax is the average value of the consistency vector, and n is the number of criteria.
The consistency Ratio (RI) is calculated using Equation (3): .
CR=CI RI (3)
Table 3 lists the consistency index of a randomly generated pairwise compa- rison matrix [27] [28].
In this research, nine experts from various Jordanian universities and organisa-tions in the fields of groundwater, surface water, soil, landuse and GIS were inter-viewed to suggest a Simplified Groundwater Vulnerability Index (SGVI) that re-quires inexpensive data. The experts agreed that the following parameters should be included in the groundwater vulnerability index:
Depth of Groundwater (DG): Depth determines the depth which a contami-nant must travel before reaching the aquifer.
Soil Texture (ST): Soil has a significant impact on the amount of recharge wa-ter which infiltrates into the groundwawa-ter.
Lineament Density (LD): Higher values of lineament density might pose more
threat to groundwater by allowing contamination to reach the water table.
Rainfall (RF): Rainfall is the major carrier of contamination to groundwater
through infiltration.
Topographic Slope (TS): Slope controls the likelihood that a pollutant will run off or remain on the surface long enough to infiltrate.
Drainage Density (DD): Drainage density is a useful measure for runoff poten-tial. High drainage density means higher potential for runoff and hence less in-filtration.
Land Use/Land Cover (LL): Landuse/Land cover affect the potential for
groundwater recharge and hence impact the groundwater vulnerability to con-tamination.
Table 3. Average random consistency indices (RI) for different number of criteria.
N RI N RI N RI N RI N RI
1 0.0 4 0.90 7 1.32 10 1.49 13 1.56
2 0.0 5 1.12 8 1.41 11 1.51 14 1.57
3 0.58 6 1.24 9 1.45 12 1.54 15 1.59
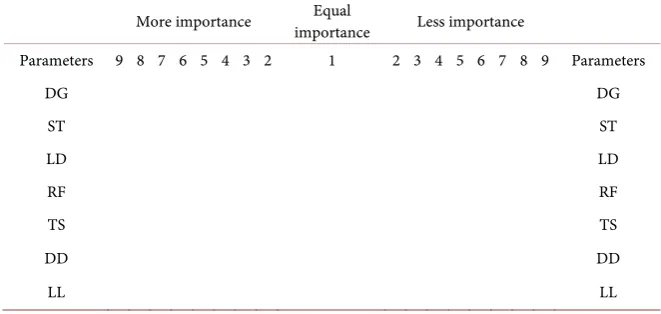
Table 4. A sample of the questionnaire used to determine the relative importance of in-dex parameters.
More importance importance Equal Less importance
Parameters 9 8 7 6 5 4 3 2 1 2 3 4 5 6 7 8 9 Parameters
DG DG
ST ST
LD LD
RF RF
TS TS
DD DD
LL LL
also asked to suggest the ratings for each parameter based a scale 1 (Lowest) to 4 (Highest). Table 7 summarises the ratings and weights for the Simplified Groundwater Vulnerability Index parameters. The final classification of the SGVI is listed in Table 8. Figure 2 illustrates the methodology adopted to calculate the final weights for the SGVI parameters based on the experts’ opinions.
2.2. Investigated Area
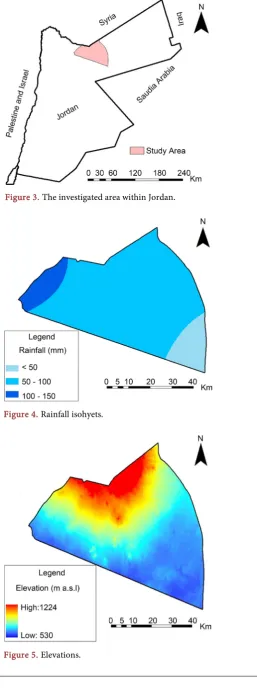
In order to test the SGVI, an area in the Northern part of Jordan was selected as shown in Figure 3.
The investigated has an area of 3200 km2 which comprises 3.59% of the total area of Jordan. The climate within the investigated area is characterised by hot dry summers and wet cold winters. Rainfall varies between 50 mm in the South East to 150 mm in the North West (Figure 4).
Elevation in the area varies between 530 m above sea level in the South and South East to 1224 m above sea level in the North near the Syrian border (Figure 5).
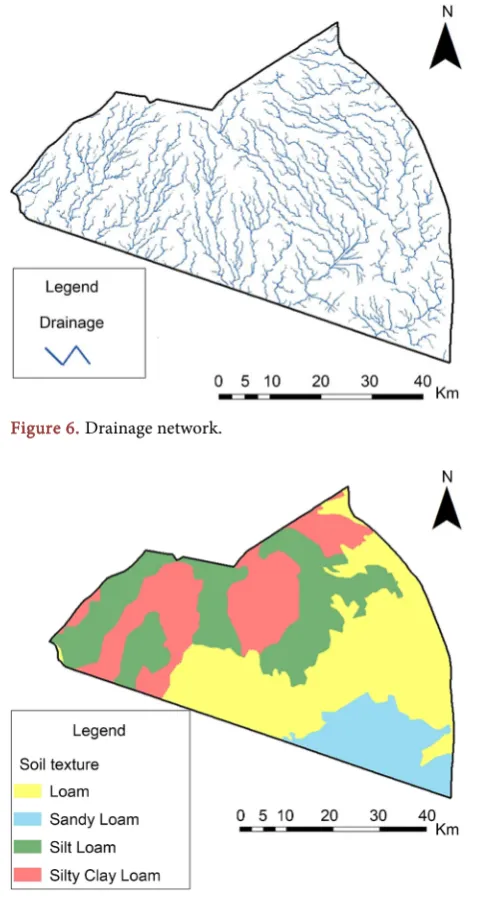
Surface water flows from the North towards the South and South West. Most of the Drainages is coming from Syria and flow towards the Azraq Oasis to the South of the investigated area (Figure 6).
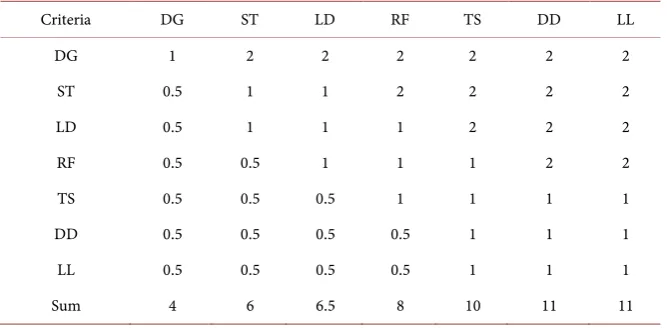
[image:5.595.207.538.205.362.2]Table 5. The pair-wise comparison matrix of the experts opinions.
Criteria DG ST LD RF TS DD LL
DG 1 2 2 2 2 2 2
ST 0.5 1 1 2 2 2 2
LD 0.5 1 1 1 2 2 2
RF 0.5 0.5 1 1 1 2 2
TS 0.5 0.5 0.5 1 1 1 1
DD 0.5 0.5 0.5 0.5 1 1 1
LL 0.5 0.5 0.5 0.5 1 1 1
[image:6.595.206.539.298.405.2]Sum 4 6 6.5 8 10 11 11
Table 6. The computed values of weights (priority vector), CI, RI and CR for experts opi-nions.
Parameters DG ST LD RF TS DD LL
Weights (priority vector) 0.244 0.18 0.162 0.136 0.099 0.09 0.09
λmax 8.071
CI 0.179
RI 1.32
[image:6.595.208.537.439.617.2]CR 0.1
Table 7. Ratings and weights for the SGVI.
Parameters Weight Ratings
1 2 3 4
DD (m) 0.244 >150 100 - 150 50 - 100 0 - 50 ST 0.18 Loam Silt Clay Loam Silt Loam Sandy Loam LD (km/km2) 0.162 0 - 1.5 1.5 - 2.5 2.5 - 3.5 >3.5
RF (mm) 0.136 <50 50 - 100 100 - 300 >300
TS (%) 0.099 >8 4 - 8 2 - 4 0 - 2
DD (km/km2) 0.09 >2.25 1.5 - 2.25 0.75 - 1.5 0 - 0.75
LL (Class) 0.09 and Urban Bare Rock Bare Soil Marab Agricultural and natural vegetation
Table 8. Simplified Groundwater Vulnerability Index Classification.
Class No Risk Low Moderate-Low Moderate-High High Very High Range 1 - 1.5 1.5 - 2 2 - 2.5 2.5 - 3 3 - 3.5 3.5 - 4
Figure 3. The investigated area within Jordan.
[image:7.595.265.523.72.770.2]Figure 4. Rainfall isohyets.
Figure 6. Drainage network.
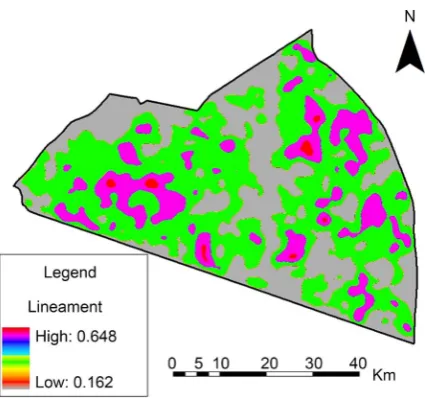
Figure 7. Soil texture.
2.3. Data Collection
The data needed for this research were collected at no cost from various resources within Jordan and from internet resources. Table 9 lists the data used in this re-search and their sources.
3. Data Analysis and Results
The following flowchart (Figure 8) shows the methodology adopted within GIS environment to calculate the SGVI. This Figure illustrates the GIS data and tools used to map the final SGVI.
ST values varied between 0.18 to 0.72.
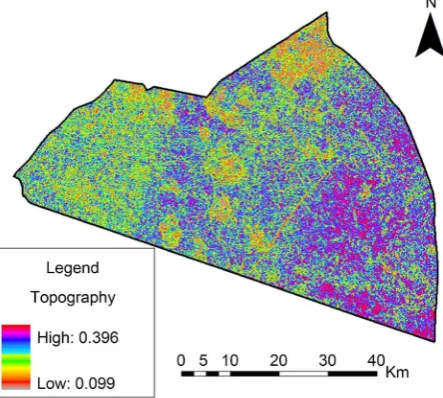
The density function in ArcGIS was used to calculate the lineament density for the investigated area, which then classified according to Table 7. The outcome of this operation was then multiplied by the parameter weight (Figure 10). LD varied between 0.162 to 0.648.
The rainfall isohyets map shown in Figure 4 was subjected to GIS manipulation by adding the appropriate ratings according to Table 7. The rainfall isohyets map was then converted into raster format and multiplied by the parameter weight (Figure 11). RF values varied between 0.136 to 0.408.
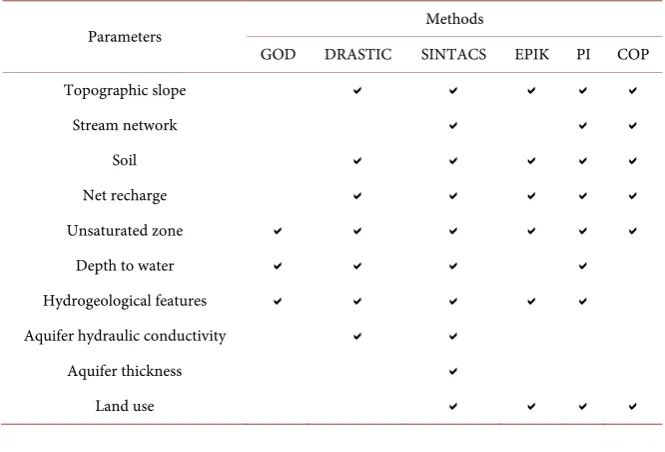
The slope map for the investigated area was extracted from the ASTER DEM (30 m) for the investigated area (Figure 5). The slope was classified according to Table 7 and multiplied by the parameter weight (Figure 12). TS values varied be-tween 0.099 to 0.396.
[image:9.595.57.540.338.726.2]ASTER DEM was used to generate the drainage map for the investigated area (Figure 6) using the Flow Direction and Flow Accumulation tools in ArcGIS. The density function in ArcGIS was then used to calculate the drainage density for the
Table 9. Used data and their sources.
Data Type Source
Depth to
Groundwater Water Authority of Jordan (Excel format) Soil Texture Jordan Ministry of Agriculture (1:250,000)
Lineament Natural Resources Authority based on Landat ETM (30 m) Rainfall Department of Meteorology (Excel format) Topographic
Slope ASTER (Advanced Spaceborne Thermal Emission and Reflection Radiome-ter) DEM (30 m) Drainage Extracted from the ASTER DEM using Flow Direction and Flow Accumu-lation tools
Landuse/Land
Cover Extracted from Landsat 8 imagery (30 m) of August, 2016
Figure 9. Soil texture parameter.
Figure 10. Lineament density parameter.
[image:10.595.264.482.525.713.2]Figure 12. Topographic slope parameter.
investigated area, which then classified according to Table 7. The outcome of this operation was then multiplied by the parameter weight (Figure 13). DS values va- ried between 0.09 in to 0.36.
Landsat 8 imagery (30 m) of August 2016 was used to generate the landu- se/land cover map for the investigated area using unsupervised classification tech-nique. The resulted map was subjected to GIS manipulation by adding the appro-priate ratings according to Table 7. The landuse/land cover map was then con-verted into raster format and multiplied by its weight (Figure 14). It appears that LL values varied between 0.09 in most of the investigated area to 0.36 in sporadic patches in the North and North West of the investigated area. Most of the investi-gated area where given 0.09 due the fact that the dominant land cover in the area is basaltic rocks.
The final SGVI map (Figure 15) is the result of adding all parameters in GIS and then classifying the output based on Table 8. The summary of the SGVI for the investigated area (Table 10) showed that the area with moderate-low vulner-ability has an area of 1929.7 km2 (60.3% of the total area), while the low vulner-ability area has an area of 1161.42 km2 (36.3% of total area). The remaining parts of the investigated area are 102.3 km2 (3.2% of total area) as a moderate-high vul-nerability and 6.58 km2 (0.2% of total area) has no risk.
4. Sensitivity Analysis of the SGVI
4.1. Statistical Analysis of the SGVI Parameters
The statistical analysis for the SGVI parameters (Table 11) indicated that ST and LL parameters contribute the highest risk of contamination with high mean values of 0.384 and 0.358 respectively. The parameters DG, LD, RF, TS and DD contribute moderate risk of contamination with mean values of 0.244, 0.298, 0.269, 0.277 and 0.277 respectively.
Figure 13. Drainage density Parameter.
Figure 14. Landuse/land cover Parameter.
[image:12.595.265.481.512.716.2]Table 10. A summary of the SGVI outcome for the investigated area.
Class Area (km2) % of total area
No Risk 6.58 0.2
Low 1161.42 36.3
Moderate-Low 1929.70 60.3
Moderate-High 102.30 3.2
Total 3200 100
Table 11. The statistical summary of the SGVI parameters.
DG ST LD RF TS DD LL
Min 0.244 0.18 0.162 0.136 0.098 0.09 0.09
Max 0.244 0.72 0.648 0.408 0.392 0.36 0.36 Mean 0.244 0.384 0.298 0.269 0.277 0.255 0.358
SD 0 0.192 0.113 0.057 0.091 0.05 0.025 CV(%) 0.00 50.00 37.92 21.19 32.85 19.61 6.98
50%. The DG parameter has no variation within the investigated area as it has only a single value for the entire area (0.244). LD, TS, RF and DD are moderately vari-able with CV values 37.92% and 32%, 21.19% and 19.61% respectively. The LL co- ver parameter is the least variable parameter (CV = 6.98%). The sensitivity is cal-culated based on the rating and weights designated to the feature classes of each parameter.
4.2. Map Removal Analysis
The statistics on the removal of one statistically significant parameter on the SGVI values (Table 12) showed that the most important parameters to contamination were DG, DD, RF and TS followed by LD, LL, and ST. The highest values were as-sociated with DG (1.84), DD (1.829), RF (1.815) and TS (1.807). The parameter (ST) showed the lowest sensitivity value (1.701).
4.3. Map Removal Sensitivity Analysis
Map removal sensitivity analysis is a test developed by [29]. This test was used in this research to identify the sensitivity of each parameter in the SGVI map. [29] developed an equation (Equation (4)) to calculate the sensitivity index (S) for the parameters used in the vulnerability index.
(
)
xi .S= V N −V n (4)
With: S is the sensitivity index of the parameter.
V is the intrinsic vulnerability index of the method; N is the total number of pa-rameters used to calculate V; Vxi represents the intrinsic vulnerability index ob-tained after removal of the parameter X.
[image:13.595.207.539.228.332.2]sen-sitivity index was calculated for each parameter of the SGVI (Table 13). Table 13 indicates that all parameters except the DG parameter have a strong influence on the SGVI map. DG with respective sensitivity index of 0.009 has the lowest impact on the SGVI. This is due to the fact that the entire investigated area was given a fixed number of 0.244 to represent this parameter (Depth to groundwater > 150 m).
5. Conclusions and Recommendations
Based on experts’ opinions, a new simplified groundwater vulnerability index was developed to investigate groundwater vulnerability to contamination. Seven parameters including depth to groundwater, soil texture, lineament density, rainfall, topographic slope, drainage density, and landuse/land cover were sug-gested by the experts. The common factor between these parameters is inexpen-sive data sources to build each one of them. This is in contradiction to the parame- ters found in other groundwater vulnerability indexes such as GOD, DRASTIC, SINTACS, EPIK, PI and COP.
Based on the outcomes of this research and the statistical tests conducted on the SGVI parameters, it is established that:
[image:14.595.208.539.391.531.2] Soil texture and landuse/land cover contribute the highest risk of contamina-
Table 12. The partial index calculated by removing one parameter of the SGVI.
Parameter Removed Mean Min Max SD
DG 1.84 0.983 2.666 0.226
ST 1.701 1.047 2.28 0.156
LD 1.786 1.065 2.352 0.217
RF 1.815 0.966 2.638 0.227
TS 1.807 1.128 2.514 0.208
DD 1.829 1.047 2.64 0.225
LL 1.726 1.001 2.55 0.225
Table 13. Sensitivity index according to the map removal sensitivity analysis test for SGVI vulnerability map.
Parameters Sensitivity Index
S Minimum S Average S Maximum Standard Deviation (SD)
DG 0.000 0.009 0.029 0.005
ST 0.134 0.234 0.313 0.023
LD 0.148 0.248 0.332 0.032
RF 0.130 0.253 0.370 0.033
TS 0.152 0.252 0.357 0.030
DD 0.145 0.255 0.371 0.032
[image:14.595.207.538.575.738.2]tion to groundwater while depth to groundwater, lineament density, rainfall, topographic slope and drainage density contribute moderate risk of contami- nation.
Depth to groundwater, drainage density, rainfall and topographic slope have
the highest importance in the index.
All parameters have strong impacts on the index except the depth to ground-
water.
Based on that, it is concluded that the new simplified groundwater vulnerabil-ity index (SGVI) is applicable to investigate groundwater vulnerabilvulnerabil-ity to conta- mination in areas where subsurface data is limited or not available.
Based on this conclusion, it is recommended to test the SGVI in combination with other indexes such DRASTIC, SINTACS or EPIK especially in areas where data for these indexes are available to compare its outcomes with their outcomes. It is also recommended to look for other parameters that might contribute to groundwater vulnerability to contamination under the condition which these pa-rameters are affordable and inexpensive.
Acknowledgements
The authors of this research would like to acknowledge and appreciate the contri-bution of the Jordanian experts who assisted the research team in the development of the SGVI index.
References
[1] Murray, K.S. and Rogers, D.T. (1999) Groundwater Vulnerability, Brownfield Rede- velopment and Land Use Planning. Journal of Environmental Planning and Mana- gement, 42, 801-810.https://doi.org/10.1080/09640569910830
[2] Evans, T.A. and Maidment, D.R. (1995) A Spatial and Statistical Assessment of the Vulnerability of Texas Groundwater to Nitrate Contamination. Center for Research in Water Resources, Bureau of Engineering Research, Doctoral dissertation, Univer- sity of Texas, Austin.
[3] NRC (National Research Council) (1993) Ground Water Vulnerability Assessment: Contamination Potential under Conditions of Uncertainty. National Academy Press, Washington DC.
[4] Aller, L., Lehr, J.H., Petty, R. and Bennett, T. (1987) DRASTIC—A Standardized Sy- stem to Evaluate Groundwater Pollution Potential Using Hydrogeologic Setting.
Journal of the Geological Society of India, 29, 23-37.
[5] Evans, B.M. and Myers, W.L. (1990) A GIS-Based Approach to Evaluating Regional Groundwater Pollution Potential with DRASTIC. Journal of Soil and Water Conser- vation, 45, 242-245.
[6] Stark, S.L., Nuckols, J.R. and Rada, J. (1999) Using GIS to Investigate Septic System Sites and Nitrate Pollution Potential. Journal of Environmental Health, 61, 15-20. [7] Fritch, T.G., et al. (2000) An Aquifer Vulnerability Assessment of the Paluxy
Aqui-fer, Central Texas, USA, Using GIS and a Modified DRASTIC Approach. Environ-mental Management, 25, 337-345. https://doi.org/10.1007/s002679910026
http://www.water.nsw.gov.au/__data/assets/pdf_file/0008/549377/quality_groundw ater_castlereagh_map_notes.pdf
[9] Al-Adamat, R.A., Foster, I.D. and Baban, S.M. (2003) Groundwater Vulnerability and Risk Mapping for the Basaltic Aquifer of the Azraq Basin of Jordan Using GIS, Remote Sensing and DRASTIC. Applied Geography, 23, 303-324.
https://doi.org/10.1016/j.apgeog.2003.08.007
[10] Abdullah, T., Ali, S. and Al-Ansari, N. (2016) Assessing the Vulnerability of Groundwater to Pollution Using DRASTIC and VLDA Modelsin Halabja Saidsadiq Basin, NE, Iraq. Journal of Civil Engineering and Architecture, 10, 1144-1159. [11] Abdullah, T., Ali, S., Al-Ansari, N. and Knutsson, S. (2016) Groundwater Vulnera-
bility Using DRASTIC and COP Models: Case Study of Halabja Saidsadiq Basin, Iraq. Engineering, 8, 741-760. https://doi.org/10.4236/eng.2016.811067
[12] Foster, S. (1987) Fundamental Concepts in Aquifer Vulnerability, Pollution Risk and Protection Strategy: International Conference, 1987, Noordwijk Aan Zee, the Netherlands Vulnerability of Soil and Groundwater to Pollutants. Netherlands Or-ganization for Applied Scientific Research,The Hague, 69-86.
[13] Neukum, C. and Hötzl, H. (2007) Standardization of Vulnerability Maps. Environ-mental Geology, 51, 689-694.
[14] Alvarado, A., Esteller, M.V., Quentin, E. and Expósito, J.L. (2016) Multi-Criteria Decision Analysis and GIS Approach for Prioritization of Drinking Water Utilities Protection Based on Their Vulnerability to Contamination. Water Resources Man-agement, 30, 1549-1566. https://doi.org/10.1007/s11269-016-1239-4
[15] Doerfliger, N., Jeannin, P. and Zwahlen, F. (1999) Water Vulnerability Assessment in Karst Environments: A New Method of Defining Protection Areas Using a Multi- Attribute Approach and GIS Tools (EPIK Method). Environmental Geology, 39, 165-176.https://doi.org/10.1007/s002540050446
[16] Vias, J., Andreo, B., Perles, M. and Carrasco, F. (2005) A Comparative Study of Four Schemes for Groundwater Vulnerability Mapping in a Diffuse Flow Carbonate Aquifer under Mediterranean Climatic Conditions. Environmental Geology, 47, 586-595.https://doi.org/10.1007/s00254-004-1185-y
[17] Hamdan, I., Margane, A., Ptak, T., Wiegand, B. and Sauter, M. (2016) Groundwater Vulnerability Assessment for the Karst Aquifer of Tanour and Rasoun Springs Catchment Area (NW-Jordan) Using COP and EPIK Intrinsic Methods. Environ-mental Earth Sciences, 75.https://doi.org/10.1007/s12665-016-6281-2
[18] Corniello, A., Ducci, D. and Monti, G.M. (2004) Aquifer Pollution Vulnerability in the Sorrento Peninsula, Southern Italy Evaluated by SINTACS Method. Geofisica Internacional-Mexico, 43, 575-581.
[19] Kumari, S., Jha, R., Singh, V., Baier, K. and Sinha, M.K. (2016) Groundwater Vulne- rability Assessment Using SINTACS Model and GIS in Raipur and Naya Raipur, Chhattisgarh, India. Indian Journal of Science and Technology, 9, 1-6.
[20] Al-Shatnawi, A.M., El-Bashir, M.S., Khalaf, R.M.B. and Gazzaz, N.M. (2016) Vulne- rability Mapping of Groundwater Aquifer Using SINTACS in Wadi Al-Waleh Catchment, Jordan. Arabian Journal of Geosciences, 9, 67.
https://doi.org/10.1007/s12517-015-2080-4
[21] Goldscheider, N., Klute, M., Sturm, S. and Hötzl, H. (2000) The PI Method—A GIS- Based Approach to Mapping Groundwater Vulnerability with Special Consideration of Karst Aquifers. Zeitschrift für Angewandte Geologie, 46, 157-166.
340-345.https://doi.org/10.1007/s10040-001-0185-1
[23] Goldscheider, N. and Popescu, I. (2004) The European Approach. Vulnerability and Risk Mapping for the Protection of Carbonate (Karst) Aquifers. Final Report COST Action, 620, 17-21.
[24] Saaty, T.L. (1980) The Analytic Hierarchy Process: Planning, Priority Setting, Re-sources Allocation. Mcgraw-Hill, New York.
[25] Saaty, T.L. (1990) How to Make a Decision: The Analytic Hierarchy Process. Euro-pean Journal of Operational Research, 48, 9-26.
https://doi.org/10.1016/0377-2217(90)90057-I
[26] Malczewski, J. (1996) A GIS-Based Approach to Multiple Criteria Group Decision Making. International Journal of Geographical Information Systems, 10, 955-971.
https://doi.org/10.1080/02693799608902119
[27] Saaty, T. and Vargas, L.L.G. (2001) Models, Methods, Concepts, and Applications of the Analytic Hierarchy Process. Kluwer Academic Publishers, Dordrecht.
[28] Saaty, T.L. (1977) A Scaling Method for Priorities in Hierarchical Structures. Jour-nal of Mathematical Psychology, 15, 234-281.
https://doi.org/10.1016/0022-2496(77)90033-5
[29] Lodwick, W.A., Monson, W. and Svoboda, L. (1990) Attribute Error and Sensitivity Analysis of Map Operations in Geographical Information Systems: Suitability Ana- lysis. International Journal of Geographical Information Systems, 4, 413-428.
https://doi.org/10.1080/02693799008941556
Submit or recommend next manuscript to SCIRP and we will provide best service for you:
Accepting pre-submission inquiries through Email, Facebook, LinkedIn, Twitter, etc. A wide selection of journals (inclusive of 9 subjects, more than 200 journals)
Providing 24-hour high-quality service User-friendly online submission system Fair and swift peer-review system
Efficient typesetting and proofreading procedure
Display of the result of downloads and visits, as well as the number of cited articles Maximum dissemination of your research work
Submit your manuscript at: http://papersubmission.scirp.org/
![Table 2. Scale of relative importance [24].](https://thumb-us.123doks.com/thumbv2/123dok_us/7778436.720406/3.595.208.539.602.735/table-scale-of-relative-importance.webp)