ISSN Online: 2156-8561 ISSN Print: 2156-8553
Spatial-Temporal Analysis of Territorial
Transformations in the State of Sinaloa Mexico
Using Geographic Information Systems
Wenseslao Plata Rocha
*, Gabriela Corrales Barraza, Geovanna Guadalupe Hinojoza Castro,
Sergio Alberto Monjardin Armenta, Jose Carlos Beltrán González,
Héctor Enrique Rodríguez Lozoya
Faculty of Earth and Space Sciences, Autonomous University of Sinaloa, Culiacán, Mexico
Abstract
In the last years the whole planet has been suffering remarkable changes, in-cluding the land use and cover, and that this is one of the many components of the global change. The present study has as main objective described the changes of land use and cover occurred in the State of Sinaloa during the pe-riod 1976-2011. For this, we used 4 maps of land use and vegetation of 1976, 1993, 2007 and 2011. This analysis was carried out applying statistical tech-niques and Geographic Information Systems (GIS). The methodology is based on the analysis of the cross-tabulation matrix or change matrix, from which it is possible to obtain indicators of change for each time interval analyzed (1976-1993, 1993-2007 and 2007-2011), as well as the gain and loss of each of the 10 categories contained in the maps. To raise the level of details in the analysis were studied the annual changes considering for this the intensity of the gains and annual losses. Also we elaborated graphs and maps that allow us describing and identifying the magnitude and spatial distribution of the changes. The results obtained show a deterioration in the rainforest, important changes in the irrigated and seasonal agriculture and the spatial exchanges in the forest areas, as well as a considerable increase in the urban areas.
Keywords
Change, Use, Intensity, GIS, Mexico
1. Introduction
In the last years, important and significant changes have been produced in the world, due to the conversion of the use and land cover, influencing global
sus-How to cite this paper: Rocha, W.P., Barraza, G.C., Castro, G.G.H., Armenta, S.A.M., González, J.C.B. and Lozoya, H.E.R. (2017) Spatial-Temporal Analysis of Territorial Transformations in the State of Sinaloa Mexico Using Geographic Infor-mation Systems. Agricultural Sciences, 8, 171-182.
https://doi.org/10.4236/as.2017.82012
Received: October 6, 2016 Accepted: February 18, 2017 Published: February 21, 2017
Copyright © 2017 by authors and Scientific Research Publishing Inc. This work is licensed under the Creative Commons Attribution International License (CC BY 4.0).
W. P. Rocha et al.
tainability and the quality of life of the population [1].
These changes are produced by the interaction between the human and natu-ral environment, are important factor in economic development but also in the environmental impact of different ecosystems [2]. In such a way that it is recog-nized at worldwide level the importance of study and understand the dynamics of the land use and land cover and its effects and impacts on the structure and functioning of the ecosystems [3].
Under this concern many of research initiatives were promoted at global, re-gional and local level, acknowledging that an important part of the global envi-ronmental system and a precursor cause of global climate change, to the dynam-ics of land uses. Based on this research initiative was conformed, “Analysis of the change of use and land cover” (LUCC, for its acronym in English “Land Use and Cover Change”), where they have been framed and developed a large number of projects and studies in this discipline, which has promoted the new science of land use and land cover changes.
The main advances in this science is to study the observation and monitoring of the dynamics of land use, to understand the causes, impacts and consequences of these changes in our territory and its population [4][5][6][7][8].
Mexico does not escape from these global trends, presenting important changes processes of land use and land cover in its nearly two million square ki-lometers. In general a lot of changes that are beyond the world average in terms of deforestation rates, increased areas of cultivation and grazing, urban sprawl are observed among many others [9][10][11][12].
Likewise, specific works were performed in various parts of the country that have been identified and quantified the impacts caused by alteration processes and deforestation in forest communities [13][14][15][16].
In this regard, Sinaloa is a region with a significant and varied biodiversity and with a lot of livestock, agriculture, aquaculture, industrial, commercial, tourism, forest resources among others; which present a dynamic that has changed the landscape and fragmented state, affecting the sustainability of the territory.
Given this problem, our main objective is to study and describe the dynamics of land use and land cover in the state of Sinaloa between 1976 and 2011 using the method proposed by Pontius, Aldwaik and others [17][18].
For this, we use the maps of land use and land cover of the years 1976, 1993, 2007 and 2011 obtained from the National Institute of Ecology and Climate Change (INECC by its acronym in Spanish) and National Institute of Statistics and Geography (INEGI by its acronym in Spanish), Geographic Information Systems (GIS), vector and raster processing and analysis of geospatial informa-tion.
2. Study Area and Data
2.1. Study Area
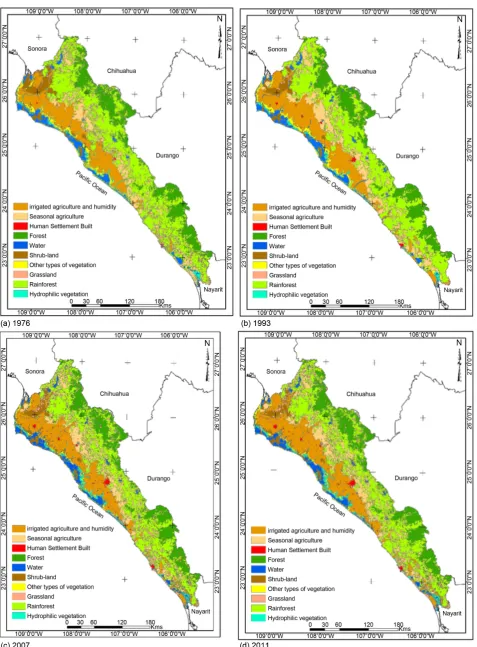
environ-ment, landscape, natural areas, mainly as a result of the economic and demo-graphic dynamics, which impacts on the ecosystems, that are under a lacking and inadequate territorial planning. This dynamic is due to the geographical lo-cation of the state, which is situated northwest of the country between the coor-dinates 27˚02' and 22˚29' north latitude and 105˚24' and 109˚27' west longitude. The state bounds North with the states of Sonora and Chihuahua, South to the state of Nayarit and the Pacific Ocean, East with Chihuahua, Nayarit and Du-rango and to the West with the Pacific Ocean (Figure 1).
The total area of the state of Sinaloa is 57,365 square kilometers, which represents the 2.9% of the total area of the country. According to INEGI, the state has experienced an increase in the population from 1,266,528 inhabitants in 1970 to 2,767,761 by 2010.
2.2. Data
For this analysis were used 4 maps of land use and land cover of the years 1976, 1993, 2007 and 2011, designed to the scale 1:250,000, which can show the state of vegetation in the entire territory, maintaining an acceptable degree of detail for the characteristics of our country.
3. Methodology
A comprehensive, robust and detail study of the dynamics of land use and land cover must have an analysis of stationary changes during time intervals besides of the annual intensity per time period and the real intensity by category, also its relation with the uniform intensity change.
To perform this study, first were collected all the official maps of land use and land cover, and then was necessary to reclassify, standardize and validate them, in order to have maps with a correct equivalence in legend and no topology er-rors. In this way were obtained 4 different maps with a total of 10 categories and with a level of detail to check the processes of change in land use statewide
(Figure 1).
To do the change analysis the method used was the one created by Pontius
[18], which get part of the results of a matrix of cross-tabulation between the land use maps from the different dates (1976-1993, 1993-2007 and 2007-2011).
The annual rate of change per time period was also obtained, and the intensity of gains “Equation (1)” and intensity of losses “Equation (2)” for each category
[17].
[
1]
[
1]
1
area of gross gain of category during , duration of ,
100% area of category at the time
t t t t
tj
t
j Y Y Y Y
G
j Y
+ +
+
= ⋅ (1)
[
1]
[
1]
area of gross loss of category during , duration of ,
100% area of category at time
t t t t
ti
t
i Y Y Y Y
L
i Y
+ +
= ⋅ (2)
W. P. Rocha et al.
1
1 2
1
1 1
n s s t
s
−
= − −
(3)
where t is the exchange rate (to express in % it is necessary to multiply by 100);
S1 is the surface at Time 1; S2 is the surface at Time 2 and n is the number of
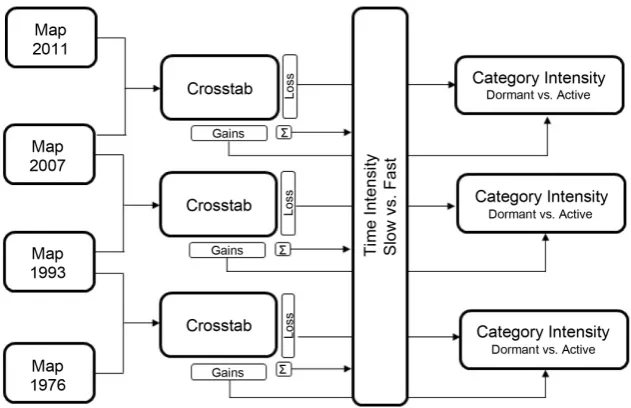
years between the two dates. Finally, the analysis was performed using the soft-ware IDRISI and Land Change Modeler module, based on the methodological framework displayed in Figure 2.
4. Results
4.1. Quantitative Analysis
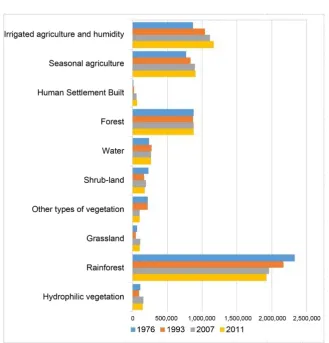
At first instance, the analysis found that the categories that represents the largest areas are mainly; rainforests (up 40%), irrigated agriculture and humidity (up to 19%), forests (15%) and seasonal agriculture (up 15.9%). It was also found that rainforest has decreased by more than 5%, while forests maintain their surface. Irrigated agriculture increased 4% and seasonal agriculture increased 2%. Meanwhile, human settlements increased 1%, which seems little, but it means a significant change compared to its initial surface which increased in 10 times
(Figure 3).
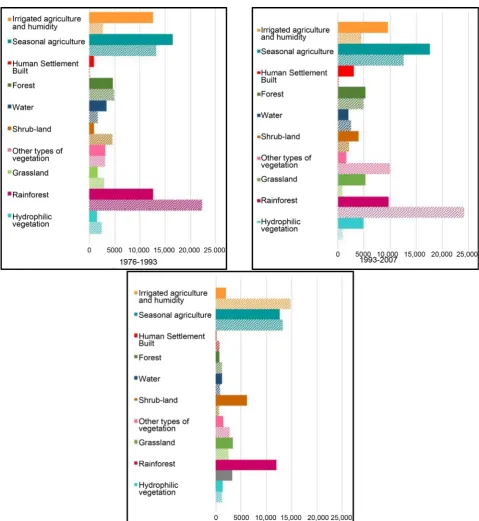
Analyzing the changes between the time intervals (1976-1993, 1993-2007 and 2007-2011) it can be seen that seasonal and irrigated agriculture and rainforests are those that had the highest annual gains, while forests is the one with the big-gest annual loss, followed by seasonal agriculture. Here, it was found that there is a very strong exchange in the categories of seasonal agriculture and rainforests, since both tend to win and lose, and if we pay attention to forests these practi-cally lose and gain the same area in both periods (Figure 4).
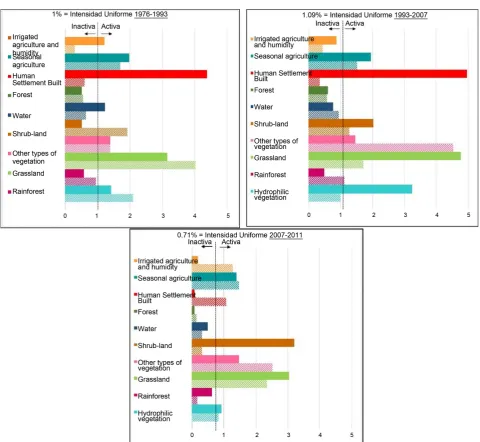
[image:5.595.215.531.501.705.2]Now, if are examine the gains and losses but from the point of view of uni-form intensity (Figure 5), it was found that the increase in human settlements
Figure 2. Methodological framework for the analysis of changes in land use and land
W. P. Rocha et al.
Figure 3. Surface of the 10 categories in the years 1976, 1993, 2007 and 2011.
makes it the category that grew with a greater annual intensity in the first two periods, decreasing in the third interval. It also shows that the loss and gain of grasslands had a very annual active intensity in the three-time intervals analyzed. Likewise, was determined that even if rainforest was the category with the most significant gains and losses in the three periods of time, its annual intensity change is considered inactive with respect to the uniform in each time interval, because of its large extension of surface in the state of Sinaloa. This is not the case for seasonal agriculture, which was also one of the categories with the big-gest changes, and which has an active annual intensity over the uniform intensi-ty in each period.
4.2. Spatial Analysis of the Most Significant Changes
Figure 4. Gains (solid color) and loss (hatched color) per year between the three time intervals analyzed.
The population growth by the economic height which has led to a rapid process of urbanization throughout the state, increasing the number of urban areas and the concentration of population in the cities, having 78% of the total state population in urban areas and 22% in rural areas according to INEGI.
W. P. Rocha et al.
Figure 5. Annual intensity presented at the three time intervals for gains (solid color) and loss (hatched color).
their territories of economic influence, which favors the territorial operation of the cities on the basis of urban metropolitan type processes.
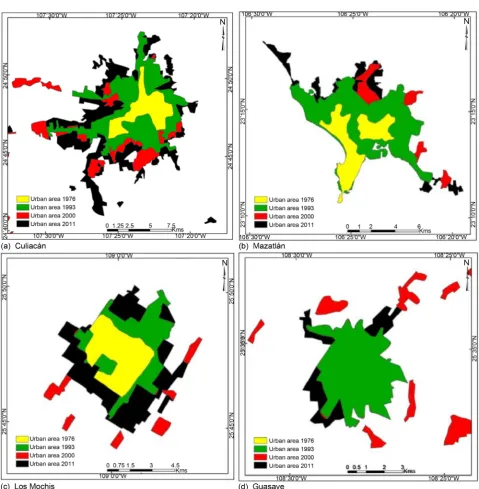
The municipality of Culiacan decisively involved in the process of the state development, not only because of its privileged geographical location but also because the city of Culiacan is the capital of the state of Sinaloa. The main urban trends that characterize the entity are manifested with a solid growth between 1976 and 1993, continuing with the urban sprawl away from the area consoli-dated. This growth appears since the 90 s up to the present, result of the devel-opment of residential and areas that were designed cities with different urban centers with all the services (Figure 7).
4.3. Annual Rates of Change
Figure 6. Changes in irrigated and seasonal agriculture, rainforests and human settlements between 1976 and 2011.
vegetation for the different periods of time, the rates of changes were calculated according to the equation used by FAO.
From Table 1, it can be understood that the category with the highest rate is human settlements, with more than 7% in the first two periods and grasslands in the second period. The other categories that show positive rates are the two agriculture, water and other types vegetation, while shrub-land and grassland rates show significant losses in the first and third periods.
Another important change in this period is presented in grasslands, with a significant gain, because in this type of surface was cultivated for cattle raising, mainly at the north of the state. The rest of the categories do not show signifi-cant changes.
The categories with the most significant changes are rainforest, with a nega-tive rate, and the agriculture and human settlements, with posinega-tive rates. These categories modified the landscape, by changing the territory of the state de Sina-loa, the coastal and mountain ecosystems, along with the social, environmental and economic indicators.
5. Conclusions
W. P. Rocha et al.
Figure 7. Urban growth of the main cities of the state of Sinaloa, Mexico.
of State, which enable the irrigation systems that have been given increase to the intensive agriculture in the region.
Likewise, it was possible to determine the impact of the loss of rainforests (400,000 ha.) and the increase of urban areas (human settlements) (56,000 ha.) in the landscape of Sinaloa. Even though forest exceeds 10 times the increase in urban areas, it was resolute that the annual intensity of urban area is very active while the forest is inactive, mainly due to the type of surfaces involved in each category in the state.
Table 1. Annual exchange rates.
CATEGORÍAS 1976-1993 1993-2007 2007-2011 1976-2011 Irrigated agriculture and humidity 1.05 0.47 1.13 0.83
Seasonal agriculture 0.41 0.58 0.08 0.44
Human Settlement Built 7.64 8.48 1.02 7.19
Forest −0.03 0.04 0.07 0.01
Water 0.69 −0.21 −0.19 0.22
Shrub-land −1.77 0.98 −3.05 −0.83
Other types of vegetation 0.02 −5.37 1.15 −2.04
Grassland −2.21 6.11 −0.77 1.20
Rainforest −0.43 −0.70 −0.45 −0.54
Hydrophilic vegetation −0.96 3.32 −0.11 0.83
territory, both in terms of quantity and intensity.
It is important to emphasize the fact that by generalizing the 4 maps of land use in 10 homogeneous categories some of the changes were lost between some categories that mark the dynamics of the territory in the state, for example, the types of forests and types of agriculture. It is also necessary to study the dynam-ics of human settlements in more detail, however, in these maps this category is mapped in a single category.
Finally, it is verified by the fact that the state of Sinaloa, Mexico has great agricultural potential, which in the past 4 decades reached a surface higher than 2,000,000 hectares, and has a great environmental and productive value with re-spect of forest areas, having in 2011 with more than 3,000,000 hectares.
Acknowledgements
This work was carried out in the framework of PROFAPI 2014/160: Simulation of 3 scenarios (Trend, Crisis and Sustainability) of land use, through multi-criteria evaluation techniques and GIS. Case of study: the State of Sinaloa, Mexico.
References
[1] Vitousek, P., Mooney, H., Lubchenco, J. and Melillo, J. (1997) Human Domination of Earth’s Ecosystems. Science, 277, 494-499.
https://doi.org/10.1126/science.277.5325.494
[2] Mustard, J., Fisher, T. and Moran, E. (2004) Land-Use and Land-Cover Change Pathways and Impacts, in Land Change Science: Observing, Monitoring and Un-derstanding Trajectories of Change on the Earth’s Surface. Kluwer Academic Pub-lishers, Dordrecht.
[3] Lambin, E., Helmut, J. and Lepers, E. (2003) Dynamics of Land-Use and Land-Cover Change in Tropical Regions. Annual Review of Environment and Resources, 28, 205-241.https://doi.org/10.1146/annurev.energy.28.050302.105459
[4] Huang, J., Pontius Jr., R.G., Li, Q. and Zhang, Y. (2012) Use of Intensity Analysis to Link Patterns with Processes of Land Change from 1986 to 2007 in a Coastal Wa-tershed of Southeast China. Applied Geography, 34, 371-384.
W. P. Rocha et al.
[5] Liu, Y., Feng, Y. and Pontius Jr., R.G. (2014) Spatially-Explicit Simulation of Urban Growth through Self-Adaptive Genetic Algorithm and Cellular Automata Model-ling. Land, 3, 719-738. https://doi.org/10.3390/land3030719
[6] Romero-Ruiz, M.H., Flantua, S.G.A., Tansey, K. and Berrio, J.C. (2012) Landscape Transformations in Savannas of Northern South America: Land Use/Cover Changes since 1987 in the Llanos Orientales of Colombia. Applied Geography, 32, 766-776. https://doi.org/10.1016/j.apgeog.2011.08.010
[7] Turner, B., Lambin, E. and Reenberg, A. (2007) The Emergence of Land Change Science for Global Environmental Change and Sustainability. Proceedings of the National Academy of Sciences of the United States of America, 104, 266-271. https://doi.org/10.1073/pnas.0704119104
[8] Zhou, P., Huang, J., Pontius, R.G.J. and Hong, H. (2014) Land Classification and Change Intensity Analysis in a Coastal Watershed of Southeast China. Sensors,14, 11640-11658. https://doi.org/10.3390/s140711640
[9] Guevara, S., De la Torre, A.J. and Rivera, P. (2001) Pobreza y degradación ambiental. Un enfoque de acervos. INE-SEMARNAT, México, D.F.
[10] Mas, J., Velásquez, J., Alcántara, C., Bocco, G., Castro, R. and Fernández, T. (2004) Monitoreo de los recursos forestales de México en las tres últimas décadas. Aplicaciones de geotecnologias para la ingeniería forestal. Memorias del VI seminario de actualización en Sensores Remotos y SIG aplicados a la ingeniería forestal, editado por A.A. Disperati y J.R. dos Santos, 41-49.
[11] Mas, J., Velásquez, J., Bocco, G. and Fernández, T. (2004) Monitoreo de los recursos forestales de México en las tres últimas décadas. Aplicaciones de geotecnologias para la ingeniería forestal. Memorias del VI seminario de actualización en Sensores Remotos y SIG aplicados a la ingeniería forestal., 44-49.
[12] Sánchez, S. and Velázquez, A. (2008) Estado y transformación de los ecosistemas terrestres por causas humanas. II Estudio de país, México.
[13] Castillo, S., García, G., March, J., Fernández, J. and Osorio, M. (1988) Diagnóstico geográfico y cambios de uso del suelo en la Selva El Ocote, Chiapas. U.S. AID: In-forme Final. El Colegio de la Frontera Sur-Word Wildlife Found-México, Biodiver-sity Support Program.
[14] Guerra, M. and Ochoa, G. (2006) Evaluación espacio-temporal de la vegetación y uso del suelo en la Reserva de la Biosfera Pantanos de Centla, Tabasco (1990- 2000). Investigaciones Geográficas, Boletín del Instituto de Geografía, UNAM., Num. 59, 7-25.
[15] Mendoza, M., Bocco, G., López, E. and Bravo, M. (2002) Implicaciones hidrológicas del cambio de la cobertura vegetal y uso del suelo: una propuesta de análisis espacial a nivel regional en la cuenca cerrada del lago de Cuitzeo, Michoacán. Investiga- ciones Geográficas, Boletín del Instituto de Geografía, UNAM., Núm. 49, 92-117. [16] Reyes, G., García, G. and Castillo, A. (2001) Uso del suelo y transformación de
selvas en un ejido de la Reserva de la Biosfera Calakmul, Campeche, México.
Investigaciones Geográficas,44, 39-53.
[17] Aldwaik, S. and Pontius, R. (2012) Intensity Analysis to Unify Measurements of Size and Stationarity of Land Changes by Interval, Category, and Transition. Landscape and Urban Planning, 106, 103-114.
https://doi.org/10.1016/j.landurbplan.2012.02.010
Submit or recommend next manuscript to SCIRP and we will provide best service for you:
Accepting pre-submission inquiries through Email, Facebook, LinkedIn, Twitter, etc. A wide selection of journals (inclusive of 9 subjects, more than 200 journals)
Providing 24-hour high-quality service User-friendly online submission system Fair and swift peer-review system
Efficient typesetting and proofreading procedure
Display of the result of downloads and visits, as well as the number of cited articles Maximum dissemination of your research work
Submit your manuscript at: http://papersubmission.scirp.org/