ISSN Online: 2165-4018 ISSN Print: 2165-400X
Effects of Different Genotypes of Switchgrass
as a Bioenergy Crop on Yield Components
and Bioconversion Potential
Doohong Min
1*, Yadhu N. Guragain
2, Vara Prasad
1, Praveen V. Vadlani
2, Jungeun Lee
21Department of Agronomy, Kansas State University, Manhattan, KS, USA
2Department of Grain Science & Industry, Kansas State University, Manhattan, KS, USA
Abstract
Switchgrass (Panicum virgatum L.) is a native warm-season grass and it is one of potential bioenergy crops. The objectives of this study were to: 1) assess the best performing switchgrass genotype suitable for Kansas soil and climatic condition in the USA, 2) determine the correlation between plant height or tiller numbers per plant and dry biomass of various switchgrass genotypes, and 3) assess a bioconversion efficiency of certain varieties of switchgrass. Twenty-two different genotypes of seedlings were allowed to grow in cones for 30 days under controlled environments. The genotype Cave-in-Rock was the shortest among the genotypes. Significant difference in number of tillers per plant was observed among the genotypes. The genotypes Alamo recorded the highest numbers of tiller plant−1 and the genotype Cave-in-Rock had the lowest numbers of tiller plant−1 compared with other genotypes. The geno-types Alamo, NL 94 C2-2, NL 94 C2-3, NSL 2009-1 and NSL 2009-2 had in-creased above ground biomass compared with other genotypes. The correla-tion study indicates that there was a significant positive correlacorrela-tion between number of tillers per plant and per plant dry weight (R2 = 0.93), number of tillers per plant and plant height (R2 = 0.94), and plant height and per plant dry weight (R2 = 0.82). Based on the biomass composition, the SWG 2007-2 genotype was the promising switchgrass line for the bioconversion through the sugar platform route due to high carbohydrate and low lignin content. On the other hand, the high biomass yield per unit area of field in NL 94 C2-1 led this genotype with the highest total carbohydrate yield per unit area of field despite the lowest total carbohydrate content in the genotype. These results are pertinent for crop breeders to develop the most promising switchgrass line with high biomass yield and high bioconversion efficiency to produce biofuel through the sugar platform route.
How to cite this paper: Min, D., Guragain, Y.N., Prasad, V., Vadlani, P.V. and Lee, J. (2017) Effects of Different Genotypes of Switchgrass as a Bioenergy Crop on Yield Components and Bioconversion Potential. Journal of Sustainable Bioenergy Systems, 7, 27-35.
https://doi.org/10.4236/jsbs.2017.71003
Received: February 14, 2017 Accepted: March 6, 2017 Published: March 9, 2017
Copyright © 2017 by authors and Scientific Research Publishing Inc. This work is licensed under the Creative Commons Attribution International License (CC BY 4.0).
Keywords
Switchgrass, Genotype, Bioenergy Crop, Plant Height, Tiller Numbers, Yield, Bioconversion
1. Introduction
Biomass is a term for all organic material that comes from plants such as trees and crops. Biomass has always been a major source of energy for mankind and is presently estimated to contribute to the order 10% - 14% of the world’s energy supply [1]. Due to increasing fuel costs and the uncertainty of fossil fuel supply on the planet, developing bioenergy crop from biomass such as switchgrass might play an important role in terms of diversifying energy sources and in-creasing energy sustainability. There are many potential bioenergy crops and switchgrass is one of them. Switchgrass is a warm-season perennial plant native to North America that has wide range of adaptation. Since switchgrass is peren-nial life cycle, it doesn’t require annual establishment and fewer chemical inputs such as pesticides and fertilizer. Its traditional uses were native range plants as pasture, roadside plants for erosion control, and a component of conservation reserve program (CRP). As one of the main goals of the Department of Energy (DOE)’s Bioenergy Feedstock Development Program (BFDP), switchgrass was chosen as the main herbaceous plant because of its high biomass, perennial na-ture, its adaptability to poor soils and marginal cropland [2]. Switchgrass has al-so been selected as model herbaceous crop for the Oak Ridge National Labora-tory, Biofuels Feedstock Program [3]. In recent years, switchgrass has become the most popular and advanced herbaceous perennial feedstock [4]. The Biofuel Analysis Meta-Model energy model predicted that switchgrass could produce greater than 700% more output than input energy [5]. Not many research was conducted what traits (phenotype and bioconversion) in switchgrass are impor-tant as potential feedstock. The objectives of this study were to: 1) assess the best performing switchgrass genotype suitable for Kansas soil and climatic condition in the USA, 2) determine the correlation between plant height or tiller numbers per plant and dry biomass of various switchgrass genotypes, and 3) assess a bio-conversion efficiency of certain varieties of switchgrass as a bioenergy crop.
2. Materials and Methods
trans-planted in 2010.
Soils for transplanting were prepared, tilled and leveled to good soil for easy transplantation and establishment. Transplanting was done manually in May, 2010. After transplantation, field was irrigated using sprinklers for 7 days. All the accessions were established well. Sixty kilograms of nitrogen fertilizer per ha was applied about 15 d after establishment. Each plot consists of 6 columns (south to north direction), and a spacing between two neighboring columns is 30 cm. Ten plants were included in each column. A spacing between two neighboring plants in a column is 30 cm. Plot size was 5.4 m2 (6 column × 0.3 m × 10 plants per column × 0.3 m).
Switchgrass samples were measured and collected in late October in 2011 and 2012. Plant height and number of tillers per plant were measured in five ran-domly selected plants from each replication. Single plant was hand-harvested and dried in air-forced oven at 50˚C for 7 days and dry weight was recorded and dry weight was expressed as dry matter g plant−1. Switchgrass was harvested with 15 cm stubble height.
h and measured the dry weight of residual biomass. The dry crucible was heated at 575˚C in muffle furnace for around 24 h and measured the weight of ash. The difference between dry weight of residual biomass and ash was the measure of acid-insoluble lignin.
Average temperature and monthly precipitation are listed in Table 1. Year 2012 was overall drier than year 2011, particularly from May to July. Tempera-ture pattern was consistent with precipitation and year 2012 was on average hotter than year 2011.
Fisher’s protected LSD was used for multiple comparisons (α = 0.05) [7]. An experimental design was a randomized complete block with four replications. Data on plant height, tiller numbers per plant, and above ground biomass were collected and analyzed using PROC MIXED in SAS [8].
3. Results and Discussion
3.1. Growth and Yield Components of Switchgrass
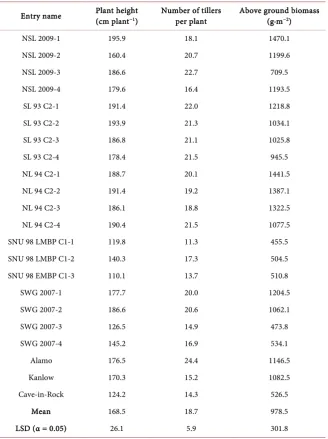
[image:4.595.208.538.421.731.2]Significant difference in plant height was observed among the genotypes (Table 2) in 2011 (a year after transplanting) and plant height of switchgrass accessions ranged from 124.2 to 193.9 cm. Although a genotype SL 93 C2-2 was the tallest, there was no significant difference between SL 93 C2-2 and NL 94 C2-1, NL 94 C2-2, NL 94 C2-3, NL 94 C2-4, NSL 2009-1, NSL 2009-3, NSL 2009-4, SL 93
Table 1. Monthly 30-year temperature and precipitation averages and departures from average for 2011 and 2012 in Manhattan, Kansas.
Item 30-Year Departure from average
Month Average 2011 2012
Temperature, ˚C March 6.4 +0.3 +8.3
April 12.5 +0.8 +3.0
May 18.4 −0.4 +2.1
June 23.6 +1.5 +3.3
July 26.6 +3.2 −1.0
August 25.5 +1.7 −0.8
September 20.4 −1.3 −0.8
October 13.6 +1.4 +2.7
Precipitation, mm March 63.3 −29.5 +6.6
April 80.5 −17.3 −30.7
May 129.3 +1.8 −102.1
June 144.8 −23.6 −60.9
July 112.3 −59.4 −97.5
August 104.7 −45.5 +2.3
September 87.1 −50.0 −45.5
Table 2. Growth and yield components of various switchgrass genotypes grown in Man-hattan, Kansas in 2011.
Entry name Plant height (cm plant−1) Number of tillers per plant Above ground biomass (g∙m−2)
NSL 2009-1 195.9 18.1 1470.1
NSL 2009-2 160.4 20.7 1199.6
NSL 2009-3 186.6 22.7 709.5
NSL 2009-4 179.6 16.4 1193.5
SL 93 C2-1 191.4 22.0 1218.8
SL 93 C2-2 193.9 21.3 1034.1
SL 93 C2-3 186.8 21.1 1025.8
SL 93 C2-4 178.4 21.5 945.5
NL 94 C2-1 188.7 20.1 1441.5
NL 94 C2-2 191.4 19.2 1387.1
NL 94 C2-3 186.1 18.8 1322.5
NL 94 C2-4 190.4 21.5 1077.5
SNU 98 LMBP C1-1 119.8 11.3 455.5
SNU 98 LMBP C1-2 140.3 17.3 504.5
SNU 98 EMBP C1-3 110.1 13.7 510.8
SWG 2007-1 177.7 20.0 1204.5
SWG 2007-2 186.6 20.6 1062.1
SWG 2007-3 126.5 14.9 473.8
SWG 2007-4 145.2 16.9 534.1
Alamo 176.5 24.4 1146.5
Kanlow 170.3 15.2 1082.5
Cave-in-Rock 124.2 14.3 526.5
Mean 168.5 18.7 978.5
LSD (α = 0.05) 26.1 5.9 301.8
C2-1, SL 93 C2-3 and SWG 2007-2. The Cave-in-Rock is one of the oldest switchgrass variety bred in Illinois in 1958 and it showed the shortest height among the genotypes of switchgrass.
Significant difference (P < 0.05) in number of tillers per plant was observed among the genotypes ranging from 14.3 to 24.4. The genotype Alamo recorded the highest numbers of tiller plant−1 (24.4) which was on par with NL 94 C2-1, NL 94 C2-4, NSL 2009-2, NSL 2009-3, SL 93 C2-1, SL 93 C2-2, SL 93 C2-3, SL 93 C2-4, SWG 2007-1 and SWG 2007-2. The genotype Cave-in-Rock had the lowest numbers of tiller plant−1 (14.3) compared with other genotypes. Cave-in-Rock variety had a phenotype of both shortest height and lowest numbers of tillers compared to other genotypes.
had increased above ground biomass compared with other genotypes. The ge-notypes SWG 2007-3, SNU 98 LMBP C1-2, SNU 98 EMBP C1-1, Cave-in-Rock and SWG 2007-4 had significantly (P < 0.05) lower above ground biomass than other genotypes of switchgrass. On average, a genotype NL 94 C2 that also had both taller plant and more tillers per plant had significantly higher above ground biomass than other genotypes (Table 2).
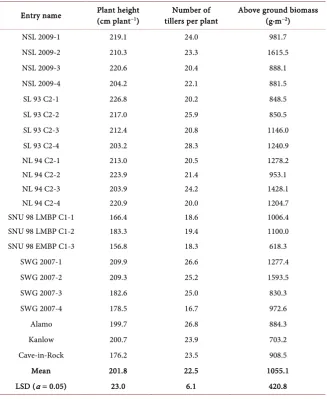
In 2012 (two years after transplanting), plant height was taller than those in 2011 by on average 17%. A genotype SNU 98 LMBP C1 (av. 168 cm) showed significantly shorter than NSL 2009 (213 cm), SL 93 C2 (214 cm), NL 94 C2 (215 cm), and SWG 2007 (195 cm). A variety Cave-in-Rock was significantly shorter than other genotypes such as NSL 2009, SL 93 C2, NL 94 C2, SNU 98 LMBP, and SWG 2007. However, no difference in height was found in Alamo, Kanlow, and Cave-in-Rock. Number of tillers per plant in 2012 ranging from 16.7 to 28.3 was significantly higher than those in 2011 by on average 17%, which is very similar to a height change from 2011 to 2012. A genotype SL93 C2 (28.3) had the highest tiller numbers per plant and SWG 2007-4 (16.7) the lowest. Switchgrass biomass was found to be related to number of phytomers per tiller and rate of phytomer development [9].
Aboveground biomass ranging from 703 to 1615 g∙m−2 in 2012 (Table 3) was significantly higher than those in 2011 by on average 7.3% (978 g per m−2 in 2011 vs. 1055 g per m−2 in 2012), which was a similar trend to both plant height and tiller numbers per plant. Number of tillers per plant and above ground biomass in 2012 appeared to be greater than year 2011.
This indicates that as time went by, switchgrass plant size became bigger. Switchgrass has rhizomes, which might have resulted in more tillers and higher above ground biomass. Although Kanlow and Alamo are lowland ecotypes, their average yields over 2011 and 2012 were higher than Cave-in-Rock (highland ecotype). Lowland ecotypes also require a longer growth period [10], a more bunch-type growth and more adapted to wetter sites [11].
The correlation study (data not shown) indicates that there was a significant positive correlation between number of tillers per plant and per plant dry weight (R2 = 0.93), number of tillers per plant and plant height (R2 = 0.94), and plant height and per plant dry weight (R2 = 0.82). This study might help bioenergy crop breeders develop certain genotypes that can have high biomass with both high number of tillers per plant and taller plant characteristics.
3.2. Composition of Selected Switchgrass Genotypes
Figure 1 shows that total carbohydrate, total lignin and total extractives content
Figure 1. Composition of five selected switchgrass genotypes. Vertical bars indicate standard errors.
Table 3. Growth and yield components of various switchgrass genotypes grown in Man-hattan, Kansas in 2012.
Entry name Plant height (cm plant−1) tillers per plant Number of Above ground biomass (g∙m−2)
NSL 2009-1 219.1 24.0 981.7
NSL 2009-2 210.3 23.3 1615.5
NSL 2009-3 220.6 20.4 888.1
NSL 2009-4 204.2 22.1 881.5
SL 93 C2-1 226.8 20.2 848.5
SL 93 C2-2 217.0 25.9 850.5
SL 93 C2-3 212.4 20.8 1146.0
SL 93 C2-4 203.2 28.3 1240.9
NL 94 C2-1 213.0 20.5 1278.2
NL 94 C2-2 223.9 21.4 953.1
NL 94 C2-3 203.9 24.2 1428.1
NL 94 C2-4 220.9 20.0 1204.7
SNU 98 LMBP C1-1 166.4 18.6 1006.4
SNU 98 LMBP C1-2 183.3 19.4 1100.0
SNU 98 EMBP C1-3 156.8 18.3 618.3
SWG 2007-1 209.9 26.6 1277.4
SWG 2007-2 209.3 25.2 1593.5
SWG 2007-3 182.6 25.0 830.3
SWG 2007-4 178.5 16.7 972.6
Alamo 199.7 26.8 884.3
Kanlow 200.7 23.9 703.2
Cave-in-Rock 176.2 23.5 908.5
Mean 201.8 22.5 1055.1
LSD (α = 0.05) 23.0 6.1 420.8
0 10 20 30 40 50 60
NSL 2009-2 NL 94 C2-1 NL 94 C2-3 SWG 2007-2 Kanlow
C
om
p
os
it
ion
(
%
w
/w
)
Switchgrass genotype
Carbohydrates
Lignin
[image:7.595.212.540.340.740.2]amount of total lignin, thereby making this genotype the least favorable feeds-tock for biofuel production through sugar platform route.
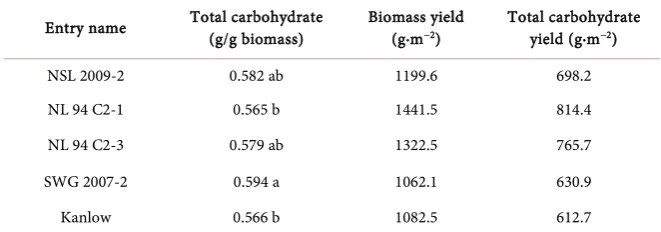
If the biomass composition data in Figure 1 is combined with the biomass yield per unit area of field (Table 2), total carbohydrate yield per unit area of field can be calculated as shown in Table 4. Table 4 shows that the NL 94 C2-1 genotype had the highest total carbohydrate yield per unit area of field despite the lowest total carbohydrate content in the biomass because of the high biomass yield per unit area of field in this genotype.
In addition, the NL 94 C2-1 genotype had the highest amount of extractives (14.8% w/w); more than 50% of which were non-structural sugars (glucose, su-crose and fructose). If the non-structural sugar content was included in the total carbohydrate yield per unit area of field calculation, this genotype would have even higher yield. However, further study is needed to confirm the best genotype for bioconversion of switchgrass to produce biofuels.
It is because the bioconversion efficiency depends on a number of factors in addition to gross composition of biomass, including crystallinity of cellulose, lignin structure, and type of linkages among and within the biopolymers (cellu-lose, hemicellulose and lignin) [12].
4. Conclusion
[image:8.595.208.539.617.733.2]The genotypes, SL 93 C2-2 was the tallest and Cave-in-Rock the shortest among the 22 genotypes. The genotypes Alamo recorded the highest numbers of tiller plant−1 and a genotype Cave-in-Rock had the lowest numbers of tiller plant−1. The genotypes Alamo, NL 94 C2-2, NL 94 C2-3, NSL 2009-1 and NSL 2009-1 had increased above ground biomass compared with other genotypes. The ge-notypes SWG 2007-3, SNU 98 LMBP C1-2, SNU 98 EMBP C1-1, Cave-in-Rock and SWG 2007-4 had lower above ground biomass than other genotypes of switchgrass. The correlation study indicates that there was a significant positive correlation between number of tillers per plant and per plant dry weight (R2 = 0.93), number of tillers per plant and plant height (R2 = 0.94), and plant height and per plant dry weight (R2 = 0.82). The SWG 2007-2 genotype switchgrass had the highest amount of total carbohydrate polymers and the lowest amount of to-tal lignin; therefore, this genotype is the most promising switchgrass line for the bioconversion to produce biofuel through sugar platform route. On the other
Table 4. Total carbohydrate yield per unit area of field.
Entry name Total carbohydrate (g/g biomass) Biomass yield (g∙m−2) Total carbohydrate yield (g∙m−2)
NSL 2009-2 0.582 ab 1199.6 698.2
NL 94 C2-1 0.565 b 1441.5 814.4
NL 94 C2-3 0.579 ab 1322.5 765.7
SWG 2007-2 0.594 a 1062.1 630.9
hand, the Kanlow genotype had the lowest amount of total carbohydrate poly-mers and highest amount of total lignin. This study helps bioenergy crop breed-ers develop certain genotypes that can have high biomass with both high num-ber of tillers per plant and tall plant characteristics and high bioconversion level in switchgrass.
References
[1] McKendry, P. (2002) Energy Production from Biomass (Part 1): Overview of Bio-mass. Bioresource Technology, 83, 37-46.
https://doi.org/10.1016/S0960-8524(01)00118-3
[2] Bouton, J. (2007) Molecular Breeding of Switchgrass for Use as a Biofuel Crop.
Current Opinion in Genetics and Development, 17, 553-558. https://doi.org/10.1016/j.gde.2007.08.012
[3] McLaughlin, S. (1996) Evaluating Physical, Chemical and Energetic Properties of Perennial Grasses as Biofuels. Proceedings of the BIOENERGY, Nashville, TN, Sep-tember 1996, USA, 1-8.
[4] Mitchell, R., Vogel, K.P. and Uden, D.R. (2012) The Feasibility of Switchgrass for Biofuel Production. Biofuels, 3, 47-59. https://doi.org/10.4155/bfs.11.153
[5] Farrell, A.E., Plevin, R.J., Turner, B.T., Jones, A.D., O’Hare, M. and Kammen, D.M. (2006) Ethanol Can Contribute to Energy and Environmental Goals. Science, 311, 506-508. https://doi.org/10.1126/science.1121416
[6] Sluiter, A., Hames, B., Ruiz, R., Scarlata, C., Sluiter, J. and Templeton, D. (2007) Determination of Structural Carbohydrates and Lignin in Biomass. National Re-newable Energy Laboratory (NREL) Laboratory Analytical Procedures (LAP) for Standard Biomass Analysis.
[7] Steele, R. and Torrie, J. (1980) Principles and Procedures of Statistics: A Biometrical Approach. 2nd Edition, McGraw-Hill, New York.
[8] SAS Institute (2011) SAS/STAT Users Guide 9.3. SAS Inst., Cary, NC.
[9] Boe, A. (2007) Variation between Two Switchgrass Cultivars for Components of Vegetative and Seed Biomass. Crop Science, 46, 636-642.
https://doi.org/10.2135/cropsci2006.04.0260
[10] Moser, L.E. and Vogel, K.P. (1995) Switchgrass, Big Bluestem, and Indiangrass. In: Barnes, R.F., Miller, D.A., Nelson, C.J., Eds., Forages, An Introduction to Grassland Agriculture, 5th Edition, University Press, Ames, IA, 409-420.
[11] Sanderson, M.A., Reed, M.L., McLaughlin, S.B., Conger, S.D., Parrish, D.J., Wolf, D.D., Taliaferro, C., Hopkins, A.A., Ocumpaaugh, W.R., Hussey, M.A., Read, J.C. and Tischler, C.R. (1996) Switchgrass as a Sustainable Bioenergy Crop. Bioresource Technology, 56, 83-93. https://doi.org/10.1016/0960-8524(95)00176-X
[12] Guragain, Y.N., Ganesh, K.M., Bansal, S., Sathish, R.S., Rao, N. and Vadlani. P.V. (2014) Low-Lignin Mutant Biomass Resources: Effect of Compositional Changes on Ethanol Yield. Industrial Crops and Products, 61, 1-8.
Submit or recommend next manuscript to SCIRP and we will provide best service for you:
Accepting pre-submission inquiries through Email, Facebook, LinkedIn, Twitter, etc. A wide selection of journals (inclusive of 9 subjects, more than 200 journals)
Providing 24-hour high-quality service User-friendly online submission system Fair and swift peer-review system
Efficient typesetting and proofreading procedure
Display of the result of downloads and visits, as well as the number of cited articles Maximum dissemination of your research work