DETERMINANTS OF DROPPING OUT OF SCHOOL: THE CASE OF VIETNAM
by
THI NHAT PHUONG LE
B.A, Hanoi National Economics University, 2006
A THESIS
submitted in partial fulfillment of the requirements for the degree
MASTER OF ARTS
Department of Economics College of Arts and Sciences
KANSAS STATE UNIVERSITY Manhattan, Kansas
2008
Approved by: Major Professor Dr. William F. Blankenau
Copyright
THI NHAT PHUONG LEAbstract
This paper describes the socioeconomic determinants of school dropout for Vietnamese children aged 11-18. It seeks to answer the following two questions: 1) What is the magnitude of the dropout rate for children between the ages of 11-18 and how does this figure change over time? 2) What are the determinants that affect the decision to drop out of school? This paper is based largely on the two Vietnam Living Standard Surveys (VLSS) conducted in 2004 and 2006. A probit model is used to ascertain the major determinants affecting the probability to drop out of school. The decision to drop out of school is affected by key factors including the child’s demographic characteristics (such as age, gender, ethnicity, and regions where they are living) and the child’s household’s situation (such as income per capita, cost of schooling, household size, and parental education). In particular, age and household size have significantly positive effects on the dropout probability. The dropout rate is also shown to vary between girls and boys, but this gender gap has narrowed substantially. Minority girls face more obstacles in staying school than minority boys. The school dropout rate is also very sensitive to changes in the household’s income and cost of schooling. However, the cost of schooling has different impacts on families in different quintiles. Region is another determinant affecting child’s decision to drop out of school. Vietnam’s population is unequally distributed in 8 regions with different socio-economic conditions, and hence the dropout situation is also regionally specific. Moreover, the parents’ perception of the value of education may increase the child’s probability of school retention. Since it is difficult to measure parental attitude to schooling, the paper uses parents’ education level instead, assuming that parents who have more education will appreciate
Table of contents
List of Tables and Figures... v
Acknowledgements ... vi
CHAPTER 1 - Introduction ... 1
CHAPTER 2 - A Literature Review ... 3
CHAPTER 3 - VIETNAMESE EDUCATION SITUATION ... 6
1 An overview of Vietnamese education system ... 6
2 The policy of education universalization in VIetnam ... 8
3 The school dropout situation in Vietnam ... 9
4 Qualitative causes of school dropout ... 15
CHAPTER 4 - EMPIRICAL ANALYSIS ON SCHOOL DROPOUTS OF CHILDREN ... 20
1 Database ... 20
2 Estimation model ... 21
3 Estimation results ... 25
CHAPTER 5 - CONCLUSION ... 31
List of Tables and Figures
Table 1: Tuition of general education in 1998………... 8
Table 2: Dropout rates over years……….. 10
Table 3: Dropout rates among age groups………. 11
Table 4: Dropout distribution among education levels……….. 12
Table 5: Regions and income quintile distribution in 2006………... 14
Table 6: Dropout rates among regions………... 15
Table 7: Dropout rate among income quintiles……….. 16
Table 8: Schooling costs among regions……… 17
Table 9: Dropouts and parental education……….………. 17
Table 10: Summary of children aged 11-18………. 21
Table 11: Estimation for the cost of education………. 23
Table 12: Marginal effects of major determinants on the probability of dropping out… 25 Figure 1: The Vietnamese education system………... 8
Acknowledgements
I would like to express my gratitude to all those who gave me the possibility to complete this thesis. I want to thank the Department of Economics, Kansas State University for giving me permission to commence this thesis. I have furthermore to thank Dr. William F. Blankenau, Dr. Dr. James F. Ragan Jr., and Dr. Florence Neymotin from the Department of Economics, who gave and confirmed this permission and encouraged me to go ahead with my thesis.
I am deeply indebted to my supervisor Dr. William F. Blankenau whose help, stimulating suggestions and encouragement helped me in all the time of researching and writing this thesis. I would like to thank many professors who have helped me build numerous valuable skills to complete this research. I also want to thank the Ph.D. candidate Canh Le from Kansas State University for his sharing the 2004 data and his explanations every time I had questions.
I wish to thank my best friends in Vietnam for their emotional supports, my best friends in Kansas State University for all the entertainment and caring they provided, and a special friend for his love and encouragement for me.
Lastly, and most importantly, I wish to thank my family for providing a loving environment for me. I owe my loving thanks to my parents, who bore me, raised me, taught me, supported me, and loved me. To them I dedicate this thesis.
CHAPTER 1 - Introduction
In response to the economic reforms associated with a transition to a market economy, which have been implemented since 1986, Vietnam’s education system has been required to make reforms in order to prepare students for the current and future labor markets. According to the World Bank (2003), education produces the highest rate of return on investment in Third World countries such as Vietnam. Being aware of the principle that an investment in education is an investment in economic development, the Vietnamese government has been increasing its expenditure for education in its budget in an attempt to change the face of the education system (Table of General Education, edu.net.vn).
In September 2000, along with 188 other nations, the Government of Vietnam approved the Millennium Declaration, in which Vietnam committed to accomplish eight Millennium Development Goals (MDGs) (United Nations Country Team Viet Nam, 2005). Two of MDGs guarantee that the country will achieve universal primary education by 2015 and eliminate the gender inequality in primary and secondary education by 2010 and at all levels by no later than 2015. In the process of meeting these MDGs, the government of Vietnam has included some educational goals in its Comprehensive Poverty Reduction and Growth Strategy (CPRGS), requiring that the net enrollment ratio is set to increase to 99% in primary school and 90% in lower secondary school by 2010, and the gender gap in primary and secondary education will be eliminated by 2010. These MDGs commitment will be a driving force pushing the educational development in Vietnam. Since the Renovation was implemented in 1986 and the market-oriented reform was launched in 1989, the education system has experienced dramatic changes.
The general adult literacy rate had increased to about 91% in 2004, according to the 2004 VLSS, even though more than 95% of the adult population was illiterate in 1945. The education sector has been socialized nationwide. Many educational institutions have been established not only in the private sector but also in the public sector. The education system has become more diversified and democratized (Nguyen et al., 1998). More children have benefited from a greater access to higher quality education. The Vietnamese education system, however, is still facing a number of major challenges. General education quality is not as high as expected. The education
children in ethnic minorities is limited. Teaching concentrates too much on knowledge in textbooks rather than on practical skills. While the government has been trying to convince parents to send their children to school, the phenomenon of dropping out of school still exists and has even shown an upward trend.
In recent years, with changes in the national curricula at all levels as well as changes in the form of entrance examinations, the Government of Vietnam has been struggling to figure out the right track for the educational reform. Although some achievements were seen in the early period of the improvement process, the pace of reform has been slowing (Duggan, 2001). A newly emerging situation is that some children are promoted but do not have the skills needed at higher levels of education. They are called wrong-class-sitting children. Going to class but unable to understand what the teachers are saying, these children do not receive enough encouragement to stay in class and are more likely to drop out of school (Vinh, vietnamnet.vn). After a period of decreasing, school dropout rates begun to increase since 2004, especially in primary and upper secondary levels (Budget of education and training, edu.net.vn).
Consequently, this paper tries to develop a deeper understanding of the dropout phenomenon in Vietnam and major factors affecting the probability of dropping out. The paper is structured as follows. Section II presents a literature review of determinants affecting the probability of school dropout. An overview of the Vietnamese education system and the dropout situation in Vietnam during the period 2000-2006 is presented in section III. In this section, the paper also attempts to describe some qualitative causes of dropping out of school, including measurable and unmeasurable causes. Section IV introduces the estimations based on the probit model to examine some determinants affecting the children’s choice of dropping out of school.
CHAPTER 2 - A Literature Review
The choice to drop out of school has been a concern of scholars from many countries. While numerous researchers have focused on the school dropout situation for higher education, many others have analyzed dropouts for post-compulsory education (Bradley and Lenton, 2007). Post-compulsory education is an important period for young people since post-compulsory education is a good opportunity for them to acquire necessary skills, which determine their further education and lifetime income. While the concept of compulsory education applies to children up to the age of 16 in some countries such as the United State, United Kingdom, Australia, or New Zealand (Maani et.al), this is not the case in Vietnam, where education is compulsory solely for primary grades of five years. The existing literature on dropout behavior has concentrated mostly on the influence of personal characteristics, family background, and other variables.
Numerous papers consider the ethnic differences in dropout rates. In a bivariate model using U.S. data, attending Catholic school has been found to increase the probability of finishing high school and entering college by thirteen percentage points compared to studying in public school (Evans, 1995). Attendance at Catholic high schools was also observed to improve math test scores and increase high school graduation rate in the U.K. (Nguyen et.al, 2006). Although Vietnam’s ethnic minorities have different traits, this paper still considers the role of ethnic differences on the probability of dropping out of school. Whereas the differences in socio-economic development is small among ethnic groups in the U.S.A. or the U.K., the gap between the major ethnic group and the other ethnic groups in Vietnam is quite remarkable in terms of development as well as the way education is perceived among these groups. According to several international organizations such as Oxfam or Save the Children U.K., which are working to improve the conditions for ethnic minorities, Vietnam’s ethnic minority children are generally the most disadvantaged and least well-educated, suffering the poorest health and the highest mortality and school dropout rates (Oxfam report, 2006). The decision to drop out of school is really affected by ethnicity.
Family economic conditions have a significant effect on children’s educational attainment (Duncan et al., 1998). Household income has been especially proven to have a
families. Moreover, Duncan et al. affirm that the effect of income on children is different at different points of time. In particular, household income has a larger effect on children’s academic performance in the childhood years than it has in the teenage years.
The mother’s and the father’s educational attainment strongly affect their offspring’s educational achievement (Ermisch et al., 2001). In particular, if the father’s education is at O-level, which means he has no qualification or his qualification is lower than the General Certificate of Secondary Education, the chance of a child obtaining more education than his father is only 48%. An increase in the father’s education, however, will likely enhance the educational attainment of his child. Moreover, the paper explains how a young adult’s educational attainment is affected by family and economic situation. According to Ermisch et al., children who are raised by single parents and who come from families in the bottom income quartile are less likely to be successful at school. Those whose parents are homeowners, however, are more likely to succeed.
Given production techniques in rural areas, gender will partly influence the probability a child will continue schooling (D. Li and Tsang, 2002). In many Asian countries, such as China and Vietnam, boys have higher educational expectation than girls. D. Li and Tsang also point out that the decision to continue schooling has been gender differentiated in China. Girls are typically required to perform more housework than boys, especially in rural areas. Given this attitude, the marginal cost of girls’ time will be higher than boys’. Therefore, demand for education for girls will be lower, and girls will face a higher chance of being withdrawn from school.
A school’s structural characteristics have also been used in predicting the likelihood of dropping out of school. Larger schools have lower dropout rates than smaller schools, and urban schools have lower dropout rates than suburban schools (Rumberger and Thomas, 2000). The reasons for leaving school are reported to be different for urban, suburban, and rural areas (McCaul, 1989). Students from urban areas withdrew from school because of poor grades or having moved to other areas, while students from suburban areas stated that they were expelled from school or simply that they did not get into the program. For those students living in rural areas, the common reasons for them to leave school were supporting their families or getting married and pregnancy.
The cost of education has become a core factor in household’s decision to maintain schooling. In Becker’s human capital model (1964), a relationship between earnings, investment cost, and rates of returns to education was derived. The decision to leave school depends on how a household compare the cost of schooling to the return on education. According to the human capital model, the expected return on education is measured by future earnings while the cost of schooling includes the opportunity cost of schooling and the direct cost for tuition and learning materials. A decision about enrolling a child in school will be made if the present value of expected return on education outweighs the current cost of schooling. However, an emerging question is why young people enroll school and then drop out from school. Bradley and Lenton (2007) suggested that young people might either overestimate the expected return on education or underestimate the cost of schooling. Thus, when they realize that the net benefit from education is less than they expected, they decide to withdraw from school.
School quality was shown to be an important factor in making educational policies in the third-world countries (Hanushek et al., 2006). A panel data on Egyptian children in primary school showed that low education quality makes student less motivated to remain in school. The explanation was that children who achieve higher skills from school will have more incentives to stay in school while lower skilled students are more likely to leave school early. Hanushek et al. also looked at the trade-off between quality and access to schooling. The return on education is always overestimated if the school quality is ignored. This means expanding the number of poor schools will never attain the desired return on education.
CHAPTER 3 - Vietnamese Education System
1.
An Overview of Vietnamese Education System
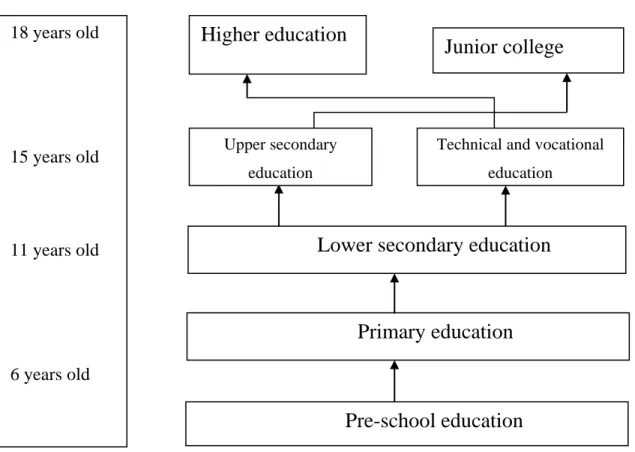
According to the Vietnam Education Law (2005), the national education system is made up of a 5-4-3-4 structure, which means 5 years for primary education, 4 years for lower secondary, 3 years for upper secondary and 4 years for higher education. Primary education has a nominal duration of 5 years with an official entry age of 6 years old. Primary education has become universal in Vietnam since 2000. The issue of universal education beyond this level is discussed in the next part of this paper.
Figure 1: The Vietnamese education system
Source: The Vietnam Ministry of Education and Training
Children continue lower secondary education from grades 6 to 9. In previous years, students had to pass the Intermediate Graduation Examination (IGE) presented by the local Department of Education and Training, and the result of this exam was used to be admitted to
Lower secondary education
Primary education
18 years old 15 years old 11 years old 6 years old 18 months oldPre-school education
Higher education
Junior college
Upper secondary educationTechnical and vocational education
high schools. In 2006, the IGE was abolished. The academic achievements for the whole period of 9 years have been used as a criterion for entering high school since 2006.
After being admitted to a high school, students continue with upper secondary education, which consists of grades 10, 11, and 12. In 3 years, students are expected to acquire all knowledge necessary for the graduation test and university entrance test, which are standardized all over the country. The graduation test consists of 6 subjects differently selected each year but having to contain the 3 compulsory subjects: mathematics, literature, and foreign language (usually English). In the university entrance test, candidates can choose one or more in 4 fixed groups of subjects. Group A includes mathematics, physics, and chemistry. Group B contains mathematics, biology, and chemistry. Group C is a combination of literature, history, and geography. Group D includes literature, foreign language, and mathematics. Each university selects one or two fixed groups of subjects as a criterion for admission.
In 2007, nearly one million Vietnamese students took the University Entrance Test, but on average only 1 out of 5 candidates succeeded (Vietnam National University, College of Economics website). The Vietnamese government intends to merge the graduation test with the university entrance test in 2010 in order to reduce the costs for the society as well as to reduce the pressure placed on students.
For those students who completely finish their lower secondary education and will not continue upper secondary education, vocational and technical education is an alternative choice. Vocational and technical education are of three main types: senior vocational education (3-4 years) is opened to lower secondary graduates and sometimes also to primary graduates, secondary technical education (or professional secondary education) lasts 2-4 years, and short programs (less than two years) are open to graduates from primary and lower secondary schools. The tuition for public institutions in national education system is a contribution from the government and families to ensure education activities. According to the Education Law that has been enforced since 1998, primary-level education is free. For other levels, tuition is waived for those who are from ethnic minority groups, are having financial difficulties, or are from poor families or are orphaned. The tuition is based on education level and geography, which is shown in the table 1 below.
Table 1: Tuition of general education in 1998 (VND/month/child)
Primary Lower secondary Upper secondary
Urban areas 0 4,000-20,000 8,000-35,000
Rural areas 0 3,000-10,000 6,000-25,000
Low mountainous areas 0 2,000-8,000 4,000-15,000
Source: Education Law, 1998
The current VND/USD exchange rate is 16,800
The tuition level in each school is decided by each local government and school based on the above tuition guidelines, geographic characteristics, and educational development strategy of each region. According to the Living Standard Survey conducted by the General Statistics Office of Vietnam in 1999, Vietnam’s monthly income per person was VND 295,000 in 1998, which means spending on lower secondary tuition occupied only a small portion of personal income. For high-income families, who are willing to pay more for their children’s education, many schools offer better teaching quality with much higher fees to satisfy the need for high-quality education.
2. The policy of education universalization in Vietnam
The universalization of education has been a challenge to Vietnam since 1990. According to the Vietnam Ministry of Education and Training (MOET), more than 2.1 million children aged 6-14 dropped out or did not attend school in 1990. Acknowledging that primary education is the principal basis for children to become good citizens, the National Assembly adopted the Primary Education Universalization Law in 1991 in order to make the education situation better. Under this law, the State provides universal primary education for children between the ages of 6 and 14. Parents and guardians have an obligation to register their children in school, create conditions encouraging children to complete their primary education, and participate with schools in the education of their children. Furthermore, to be considered as achieving universalization of primary education, a district is required to have 90% of children at the age of 6 enrolling in school and 80% of children at the age of 14 completing primary education. Similarly, to be considered as accomplishing universalization of primary education, a province is required to
have 90% of its districts achieving universalization of primary education. The universalization of primary education was a national goal that had to be completed by 2000.
To meet the goal by 2000, the government has spent VND 400-2,000 billion on education annually for the past ten years (Table of Budget of Education and Training, edu.net.vn). With significant support from international organizations, facilities for primary education were upgraded. Teaching staffs have improved in both quantity and quality. Furthermore, the national curricula were diversified and people in poor areas were encouraged to go to school.
In 1995, Vietnam declared it completed the universalization of primary education, 20 years ahead of the world schedule. All 64 provinces and cities had reached the standards with more than 90 percent children at the age of 14 completing primary-school education.
Based on previous achievements in universal education, Vietnam has been targeting lower secondary level. A campaign for the universalization of lower secondary education was launched in 2000. According to the Vietnamese government, the educational sector was asked to renovate education programs to ensure that 80% of Vietnam’s people would finish lower secondary school before the age of 18 by 2010. Districts with 95% of primary graduates enrolling in lower secondary schools and at least 80 percent of children at the age of 18 completing their lower secondary education will be recognized as meeting national standards for the universalization of lower secondary education. For regions of extreme hardship, the rates have to be 80% and 70%, respectively.
3. The school dropout situation in Vietnam
According to the Ministry of Education and Training (MOET), the enrollment rate has varied in recent years in all levels. Table 2 below presents the dropout rate over years. The dropout rate for children at the age of primary education decreased from 3.67% in 2000 to 2.63% in 2003, and then increased to 3.83% in 2004. For the children at the age of lower secondary schooling, 2001 witnessed a large decrease in dropout rate from 7.3% to 5.91%. For three subsequent years, the dropout rate kept decreasing, but at a slower pace. The dropout rate for children at the age of upper secondary schooling has varied through the years. It increased from 6.35% in 2000 to 8.18% in 2001, decreased to 7.19% in 2002, and then increased again in the next two years, 7.71% in 2003 and 8.29% in 2004. Notice that the dropout rate is much higher
for the children at the age of upper secondary schooling compared to the dropout rates for the children at the age in lower secondary and primary schools.
Table 2: Dropout rates over years
2000 2001 2002 2003 2004
Total (thousand) 17,850 17,950 17,850 17,550 17,250
Primary (thousand) 9,750 9,350 8,900 8,350 7,800
Promotion rate (%) 94.04 95.12 95.63 96.36 95.28
Dropout rate (%) 3.67 3.13 3.13 2.63 3.83
Lower secondary (thousand) 5,900 6,250 6,500 6,600 6,650
Promotion rate (%) 91.22 93.04 93.16 93.44 93.93
Dropout rate (%) 7.30 5.91 5.90 5.72 5.12
Upper secondary (thousand) 2,200 2,350 2,450 2,600 2,800
Promotion rate (%) 92.47 90.61 91.56 90.95 90.31
Dropout rate (%) 6.35 8.18 7.19 7.71 8.29
Source: Vietnam Ministry of Education and Training
From the perspective of MOET, children are viewed as dropouts if they did not continue their schooling in a given year after enrolling for at least part of the year. One shortcoming of this definition is that it does not take into account those who have finished a given grade but do not continue to enroll in school at higher grade. Therefore, this definition seems to underestimate the dropout rates.
In this paper, children aged 11-18 are considered to be dropouts if they have not attended school in the 12 months prior to the survey. Since children need at least 12 years to finish grade school education, which includes primary, lower secondary, and upper secondary education, those under 18 are assumed to be of school age. If child’s age is less than 18 and he or she is not enrolled school, he or she is a dropout. For those whose ages are 18 at the time of the survey, the paper considers their highest education level. If they have finished the upper secondary education, they are not dropouts. Although this definition still has the shortcoming of including a small number of children who had to postpone their education and intended to come back to school in the coming years, it provides a more precise measurement of the dropout rate in Vietnam.
Using the 2004 and 2006 VLSS, this paper finds that the school dropout rate varied across various age groups and time. Table 3 shows that the dropout rate for all children aged 11 to 18 had fallen from 20.44% in 2004 to 19.65% in 2006.
Table 3: Dropout rate among age groups
Age 2004 2006 All children (%) Girls (%) Boys (%) All children (%) Girls (%) Boys (%) 11-18 20.44 22.69 19.70 19.65 20.97 18.29 11 3.99 4.37 3.65 4.18 5.50 3.01 12 5.19 5.78 4.59 5.01 4.60 5.38 13 9.55 10.54 8.71 8.94 8.38 9.47 14 14.36 15.29 13.45 12.91 14.81 11.00 15 21.32 22.69 20.14 19.14 20.26 17.85 16 29.51 30.36 28.73 28.89 29.29 28.46 17 37.19 40.04 34.64 33.30 36.07 30.17 18 46.08 49.53 42.92 41.07 40.82 41.36
Source: Author’s calculation using VLSS 2004 and 2006
Most of the age groups saw a decline in the dropout rate except for the age of 11, which increased slightly increase from 3.99% in 2004 to 4.18% in 2006. The eighteen-year-olds had the largest decline in dropout rates, nearly 5.01 percentage points, from 46.08% in 2004 to 41.07% in 2006. It can be seen in each year that the dropout rate has gradually increased as a child becomes older. In 2004, only more than 3.99% of children aged 11 reported that they had not enrolled in school in 12 months prior to the survey. The percentage increased to 5.19%, 29.51%, and 46.08% for children whose ages are 12, 16, and 18, respectively. The dropout rates were slightly lower in 2006 with 5.01%, 28.89%, and 41.07% for children who are 12, 16, and 18 years old, respectively. Older children have higher dropout rates because the opportunity cost of schooling increases with age. Assuming that the older children attend higher grades, one expects the schooling cost to be more expensive for those studying in higher grades, and hence the cost of education increases as a child becomes older. In addition, older children are more able to help their family in housework or even in earning money. The more expensive the schooling costs, the less likely children are to attend schools.
The dropout rate has gone down faster for girls than for boys. The gender gap has narrowed from 2.99% in 2004 to 2.68% in 2006. The dropout rate has gone down by 1.72 percentage points for girls and 1.41 percentage points for boys in 2 years. Especially at the age of 18, school dropout rate has lessened impressively for girls.
Table 4: Dropout distribution among education levels
2004 2006
Dropout in Primary Level 45.86% 41.32%
Dropout in Lower Secondary 51.44% 53.29%
Dropout in Upper Secondary 2.7% 5.39%
Source: Author’s calculation using VLSS 2004 and 2006
Table 4 displays the dropout distribution among education levels in 2004 and 2006. A considerable number of children dropping out chose to quit school after finishing their lower secondary education or attending in some grades at this level. This figure increased from 51.44% in 2004 to 53.29% in 2006. Meanwhile, many others chose to quit school without any lower secondary education. A small proportion decided to drop out of school when they were currently in their upper secondary grades. In 2004, only 2.7% of the children dropping out left school when studying in the upper secondary grades. This proportion increased to 5.39% in 2006.
Dropout rates varied across different regions. Vietnam has 8 distinct regions: the Red River Delta (encompassing Hanoi, the capital city), the Northeast, the Northwest, the North Central, the South Central, the Central Highlands, the Southeast (encompassing Ho Chi Minh City, the largest city), and the Mekong River Delta. However, economic development is uneven in these regions. According to the National Statistics, Ho Chi Minh City accounted for 17% of national output, 30% of foreign investment, and 40% of exports in 2006. This has made the Southeast the most prosperous and dynamic region in the country, followed by the Red River Delta. The regions with the highest relative poverty rates are the Northwest and North Central, where ethnic minorities are concentrated.
265,690 317,090 379,860 390,180 414,860 471,070 488,180 832,970 0 100,000 200,000 300,000 400,000 500,000 600,000 700,000 800,000 900,000 A v e ra g e m o n th ly i n c o m e V N D p e r c a p it a Nor thw est Nor th C entra l Nor thea st Cen tral H ighl ands Sout h C entra l Meko ng R iver Del ta Red Riv er D elta Sout heas t
Figure1: Average monthly income per capita by regions in 2004
Source: The National Statistics
Based on 2006 VLSS, Table 5 demonstrates the income quintile distribution in each region. More than 40% of the Northwest’s households have the income belonging to the poorest group, while 43.53% of the Southeast’s households have incomes that lie in the top 20% of highest income in 2006. The economic disparities have been largest in these two regions. The Northeast and North Central regions also had a large proportion falling in the poorest group. The yearly severe weather was one of the main reasons keeping these two regions from being prosperous. The Central Highlands and Mekong River Delta regions had a similar quintile distribution while Red River Delta regions had a quite even distribution. Calculations from 2004 and 2006 VLSS show that households in the top 2 quintiles had annual gross incomes exceeding VND 24,315 for 2004 and VND 30,718 for 2006. Furthermore, households in 2 lowest quintiles had gross incomes below VND 18,199 in 2004 and VND 22,523 in 2006.
Table 5: Regions and income quintile distribution in 2006 Poorest Near Poorest Middle Near Richest Richest
Red River Delta 16.70% 22.96% 22.81% 22.04% 15.49%
Northeast 28.57% 23.00% 20.04% 15.63% 12.76% Northwest 42.38% 25.39% 15.89% 10.82% 5.52% North Central 33.20% 21.17% 20.45% 15.83% 9.35% South Central 14.76% 22.87% 19.81% 23.14% 19.42% Central Highlands 15.54% 15.69% 22.73% 20.67% 25.37% Southeast 5.58% 11.69% 15.62% 23.58% 43.53%
Mekong River Delta 14.79% 18.58% 20.17% 22.94% 23.52%
Source: Author’s calculation using VLSS 2006
Regional diversities in specific characteristics and socio-economic development caused various differences in dropout rates and paces of change in enrollment from regions to regions over two years. Table 6 displays the school dropout rates for 2004 and 2006 across Vietnam’s eight regions. In 2004, the Red River Delta region experienced the lowest dropout rate, 13.7%, while the lowest enrollment could be observed in the Northwest and Mekong River Delta regions, 33% and 32.83% respectively. In 2006, the dropout rates declined in some regions and slightly increased in others. The Northwest, a poor mountainous region, recorded a surprisingly high reduction in the dropout rate in two years. Meanwhile, the Southeast, a region that possesses more advantageous conditions for development, was unsuccessful in enhancing the enrollment when its dropout rate increased from 20.99% in 2004 to 23.16% in 2006. The gap between boys’ and girls’ dropout rates was seen to be the largest in the Northwest region in 2004 with 20.16 percentage points in difference. And this gap was narrowed to 12.23 percentage points in 2006. Boys could be seen to withdraw from school more than girls in Southeast region, which was demonstrated by a steep increase in boys’ dropout rates in 2006. The Southeast region, the most prosperous region with more than 50% contribution to the state budget in 2006 (Official fiscal report in 2006 by the Ministry of Finance of Vietnam at its official website) had fairly high dropout rates. The widening economic disparity can be one of explanatory reasons.
Table 6: Dropout rates among regions Monthly per capita income (Thousand VND) 2004 2006
All Girls Boys All Girls Boys
Northwest 265,690 33.00 43.44 23.28 29.84 36.21 23.98
North Central 317,090 14.94 18.59 11.79 13.46 15.61 11.13
Northeast 379,860 14.77 15.65 13.89 13.84 14.26 13.39
Central Highlands 390,180 19.97 19.57 20.36 20.38 25.01 15.45 South Central 414,860 15.11 18.21 12.11 15.43 17.25 13.65 Mekong River Delta 471,070 32.83 32.98 32.69 32.81 32.87 32.75 Red River Delta 488,180 13.70 14.63 12.88 10.92 11.99 9.80
Southeast 832,970 20.99 17.73 24.00 23.16 18.05 28.02
Source: The National Statistics andauthor’s calculation using VLSS 2004 and 2006
Although only 5.58% of the Southeast population lies in the poorest group and up to 43.53% belong to the richest group, those fractions were not successful in addressing the poverty feature within the Southeast region. Because of the particular traits in economic development, different poverty standards must have been used for different regions. Some poor households living in the Southeast region still had their income greater than some rich households living in the other regions, but they still could not afford the high expenses when living in one of the most dynamic regions.
4. Qualitative causes of school dropout
Several factors may explain why children drop out of schools. Those factors can be grouped into three categories: a family’s economic situation, a child’s characteristics and other factors at the macro level.
Household income is considered a core determinant of the probability of dropping out of school. Theoretically, household income and the likelihood of dropping out of school vary in opposite directions. Dropping out of school occurs more often among children whose families have financial difficulties. Since households in different quintiles reflect the differing economic
Table 7: Dropout rate among income quintiles
2004 2006
Poorest Group 25.37% 24.84%
Near Poorest Group 24.20% 20.46%
Middle Group 20.16% 21.11%
Near Richest Group 19.24% 19.08%
Richest Group 13.23% 12.81%
Source: Author’s calculation using VLSS 2004 and 2006
A household’s economic situation was another important determinant affecting the probability of dropping out of school. Children whose families were in the poorest group were the most likely to leave school, while children in the richest group had the lowest dropout rate. The middle group was the only one whose dropout rate increased in 2006. Since households in the middle group usually have unstable source of income, they are most liable to either to fall to the near poorer group or rise into a wealthier group. Therefore, the gaps between 3 groups in the middle were unremarkable. The next section of this paper examines the magnitude of this effect and whether this conclusion is statistically accurate.
The cost of education is another factor which had a strong affect on the choice to drop out of school. According to table 8, For those children whose ages are 11-18 and are pursuing lower or upper secondary education, the cost of education really matters since these children’s tuition fees are not waived. Although many children in ethnic minorities have received the tuition reduction, many of them were unable to go to school because they still have to pay for their textbooks, uniforms, educational materials, school construction, and maintenance expenses. The Northwest was the region where the cost of schooling was the lowest, but the highest dropout rate also occurred in this region. Most importantly, Northwest region is a mountainous area with a large number of ethnic minorities and is the poorest region with a large portion of its population belonging to the lowest income quintile. Consequently, one assumes that the cost of schooling affects households with different incomes in different ways.
Table 8: Schooling costs among regions (Thousand VND/year)
2004 2006
Red River Delta 406.31 621.15
Northeast 263.77 451.96 Northwest 123.86 213.51 North Central 382.26 566.44 South Central 433.81 656.08 Central Highlands 381.10 575.43 Southeast 578.40 792.48
Mekong River Delta 311.52 505.22
Source: Author’s calculation using VLSS 2004 and 2006
Parental education is another factor affecting children’s decision to drop out of school since better-educated parents are more aware of the possible returns on their children’s education. More highly educated parents tend to equip their children with necessary learning skills, which yield the higher returns on education, while more poorly educated parents are hardly able to find the information and social networks that would help their children succeed. Moreover, better educated parents could assist their children to cope with schooling by developing their motivation and studying abilities. Table 9 shows the correlation between dropout rates and parental education.
Table 9: Dropouts and parental education
Years of education
Mother’s education Father’s education
2004 2006 2004 2006
No education 44.13 % 39.83 % 46.22 % 42.16 %
1-5 years 27.87 % 30.12 % 33.69 % 31.89 %
6-9 years 13.96 % 11.58 % 16.20 % 14.95 %
10-12 years 4.99 % 5.71 % 7.36 % 6.1 %
More than 12 years 1.08 % 1.64 % 1.14 % 1.79 %
the country. Some families, however, still have more than two children because of the lack of availability of birth-control methods or preference to have a son. Having more children means parents have to spend less money for each child.
The table shows that 44.13% of those whose mothers had no education and 46.22% of those whose fathers had no education did drop out of school in 2004. For those children whose mothers or fathers had no more than 5 years in schooling, 27.87% and 33.69% of them left school prematurely in 2004, respectively. The more years a child’s parents spent in schools, the less likely that child was to drop out. A similar interpretation of the data can be applied to the father’s education level for 2006. The dropout rate decreased by 16.26 and 12.53 percentage points when the mother and father increased their schooling from no education to no more than 5 years in schooling in 2004, respectively, which means the increase in the number of schooling years of the mothers reduced the dropout rates more than the fathers’ did. The quantitative effects of parental education on the choice to drop out of school are addressed further in the later sections of this paper.
In addition, other factors at the macro level also impact the decision to drop out of school. These include the quality of education and the society’s and families’ perception of the value of education. The quality of education is evaluated on several criteria such as curriculum and learning programs, teaching methods, teaching and learning facilities, or teacher qualifications. In Vietnam, the curriculum and learning programs have been criticized as excessively burdensome and still not providing enough knowledge necessary for children (Le, 2000). Although the government has made many changes in the program of study, many of these reforms remain controversial. The number of students dropping out because of an unduly burdensome curriculum has increased, especially among the tenth graders, at the start of upper secondary level education (Glewwe et al., 2004).
At the primary level of education, unqualified students have still been promoted in some rural areas (Le, 2000). This occurs because schools are not expected to have repeaters, which would lead to cutting off financial assistance from the government. To ensure that students are evaluated correctly, teaching and learning standards have been made more rigorous nationwide by the MOET. The more burdensome curriculum and the stricter standards made children for whom the program had become too difficult drop out of school. Teaching methods have been
participation in the learning process, in short making them bored. Not only the quality of teachers has been proven to be inadequate, but also their numbers. In addition, many schools in rural areas still have poor facilities and a shortage of teachers creating over-crowded classrooms. As reported by the MOET in 2007, there were on average 35.5 children per class in primary schools, 41.6 per class in lower secondary schools, and 48.4 per class in upper secondary schools. In mountainous, isolated and remote areas, there remain 3-shift classes and bamboo-thatched classrooms. Facilities and equipment supporting teaching and learning in these areas are poor and outdated.
The perception of the value of education value is another exogenous factor affecting school dropouts. In rural areas, production technologies are still simple and do not require highly skilled labor. Therefore, pursuing higher education levels is only necessary for those who want to escape from the village. Higher education is less meaningful in rural areas than in urban ones. In addition, a household’s financial difficulties drive students, who do not insist on schooling, to consider the option of giving up. Since some parents do not recognize the returns on education, they believe that letting their children work brings more benefit than schooling. Although people in difficult living conditions are provided free-of-charge textbooks and study aids by the government, the limited perception of the value of education prohibits children from continuing their schooling.
Many factors including some that are measurable (i.e., household income, schooling cost, age) and others that are not (i.e., education quality and parents’ perception of the value of education) affect the probability to drop out of school. Since the VLSS does not provide information on the education quality, this paper will not be able to go further in determining the quantitative effect of this factor. In term of parents’ perception, a measure of that factor might be inferred from their level of education. One may assume that better educated parents attach a greater value to education.
CHAPTER 4 - EMPIRICAL ANALYSIS ON SCHOOLING
DROPOUTS OF CHILDREN
1. Database
This paper uses data from the 2004 and 2006 VLSS as the main resources for quantitative analysis. The 2004 survey considers 9,189 households and includes data on 40,440 persons ranging in age from 0-102 while the one in 2006 includs data about 39,071 persons from 9189 households. All the households participating in VLSS 2004 and 2006 are from the 64 provinces, which are grouped into 8 regions based on their similarities in geography and natural conditions. Those 8 regions are the Red River Delta, Northeast, Northwest, North Central Coast, South Central Coast, Central Highlands, Southeast, and Mekong River Delta.
The VLSS uses 2 questionnaires: a household questionnaire and a commune questionnaire. The household questionnaire contains 8 main sections: Education; Health; Income; Expenditure; Fixed Assets and Durable Goods; Participation in the Poverty Reduction Program; Agriculture, Forestry and Aquiculture Production; and Non-Farm Activities. Each observation in each file is determined by 5 codes: province code, district code, commune code, enumerator code, and household code, which are used for merging variables among data files. The information about each observation’s sex, date of birth, or relationship with the household head can be found in Household Roster.
In the education section, questions ask about whether the household member can read or write, the highest diploma he/she has achieved (including education and professional training), whether he or she currently attends school, which grade, and what type of school (public or private). Depending on the answers, the surveyors would continue asking for more details about school expenditures including tuition, contributions (construction fund, parent’s association), uniforms, textbooks, other education equipment, and extra learning (including foreign languages and computers). People are also asked about whether they received exemptions or reductions in fees. If they did, they are asked to explain why and the size of the reduction.
This paper focuses on the dropout rate among children aged 11-18. The reason for choosing such an age range was determined by the effort to universalize secondary education by 2010. This policy encourages all children aged from 11 to 18 to continue lower secondary
than 11 and older than 18 are omitted and all regressions in this paper are applied on the remaining data. The following table displays the data characteristics for those children aged 11-18.
Table 10: Summary of children aged 11-18 Variable Number of observations
2004 Number of observations 2006 Aged 11-18 7824 7649 Male 4064 3872 Ethnicity of Kinh 6202 6040 School dropout 1703 1503 Rural 1581 1564
Source: Author’s estimation based on VLSS 2004 and 2006
2. Estimation model
In this section, a probit model is used to examine the effects of the main determinants on the probability of dropping out of school in 2004 and 2006 for children aged 11-18 at the time they were interviewed. The dependent variable (DROPOUTi) has the value of 1 if the child i did
not enroll school in the last 12 months prior to the survey, otherwise it has the value of 0 where P ( DROPOUTi = 1 | x ) = P (εi≤ xiβ| x )
In the above equation, β is a vector of parameters, xi is a vector of independent variables,
and the error term εi is normally distributed. The probability of dropping out is assumed to be
dependent on the child’s characteristics (age, gender, and ethnicity) and family characteristics (household size, parental education level, household per capita income, the cost of education).
Male: The gender of a child affects the opportunity cost of studying and thus affects the child’s demand for education. This variable has value of 1 if the child is male and of 0 if the child is female.
Majority: Vietnam has a total of 54 ethnic groups but Kinh is the majority group comprising 86% of the population in the 1999 census, according to the General Statistical Office of Vietnam. Vietnamese minor ethnic groups mainly live in mountainous areas and under difficult conditions. In this paper, the Majority variable is a dummy variable, which has a value
of 1 if the child has the majority ethnicity, Kinh, and has value of 0 if the child belongs to other ethnic minorities.
Household size: Household size is believed to influence the probability of a child’s dropping out. Coming from a larger household may increase a child’s probability of dropping out. Vietnam’s two-child policy, which was launched 15 years ago, has reduced the family size all over the country. According to this policy, all parents who are currently working in the public sector are prohibited from having more than 2 children. Some families still have three or more children, which is particularly a tendency in poorer families who desire larger families to increase their labor supply. However, having more children means parents have less money to spend for each child.
Father’s education and mother’s education: In this paper, the father’s education and mother’s education are considered separately due to the assumption that each has different marginal effects on a child’s education. The parent’s education is measured by the number of years of schooling a parent has completed. Parents who have finished their upper secondary education would have had 12 years of schooling. Those having a Bachelor’s, Master’s, or PhD degree would have had 16, 18, or 20 years of schooling respectively.
Log of household’s income: Household income is the gross income combined from the members’ earning. Log of income refers the percentage change in household income.
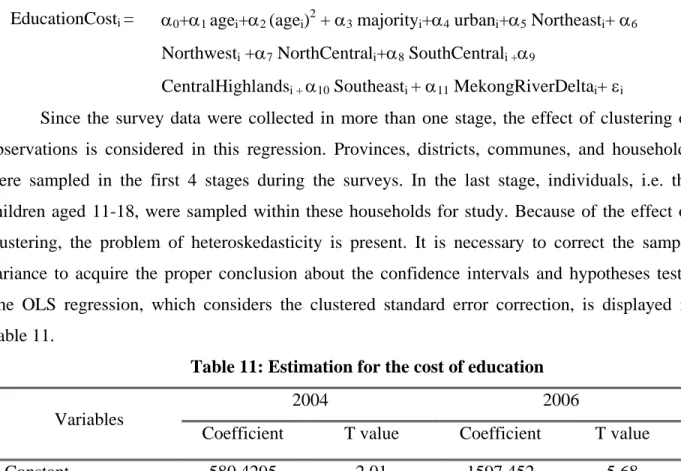
Log of education cost: The education cost includes the tuition fee, the contribution fee1, the cost of a uniform, and the cost for textbooks. Since the real education cost for children who already dropped out of school is zero, this paper estimates their education cost with the assumption that dropouts have the same basic cost as enrolled children, who are at the same age, from the same ethnic group, and live in the same areas. To estimate the education cost for dropouts, two steps must be performed. The first step is to find a relationship between the cost of education and its determinants, which are region, ethnic group, and age. This step is implemented only on those who were aged 11-18 and currently enrolled in schools. In the second step, using the real value of region, ethnicity, and age of dropouts, the paper computes their estimated education costs. The education costs that will be used for the probit model later are the real education costs for those were enrolled in school and the estimated education costs for dropouts.
EducationCosti = α0+α1 agei+α2 (agei)2 + α3 majorityi+α4 urbani+α5 Northeasti+ α6
Northwesti +α7 NorthCentrali+α8 SouthCentrali +α9
CentralHighlandsi + α10 Southeasti + α11 MekongRiverDeltai+ εi
Since the survey data were collected in more than one stage, the effect of clustering of observations is considered in this regression. Provinces, districts, communes, and households were sampled in the first 4 stages during the surveys. In the last stage, individuals, i.e. the children aged 11-18, were sampled within these households for study. Because of the effect of clustering, the problem of heteroskedasticity is present. It is necessary to correct the sample variance to acquire the proper conclusion about the confidence intervals and hypotheses tests. The OLS regression, which considers the clustered standard error correction, is displayed in Table 11.
Table 11: Estimation for the cost of education
Variables
2004 2006
Coefficient T value Coefficient T value
Constant 580.4295 2.01 1597.452 5.68
Age -108.8985 -2.60 -275.2338 -6.44
Age2 5.545815 3.56 12.5861 7.94
Majority 179.718 9.46 267.4302 7.72
Urban 207.5338 5.11 279.2318 5.67
Red River Delta Reference Reference
Northeast -43.57495 -1.03 -21.45325 -0.33 Northwest -108.9237 -2.49 -131.0674 -2.48 North Central 12.71358 0.35 -7.251123 -0.18 South Central 33.50441 0.80 26.03526 0.54 Central Highlands 25.00852 0.49 37.65942 0.63 Southeast 157.0775 1.89 154.0777 1.50
Mekong River Delta -53.96154 -1.54 -68.86546 -1.65
Source: Author’s estimation based on VLSS 2004 and 2006
cost of education is fairly high for children at the early age since it requires well equipped facilities and greater number of teachers. In the 2004 regression, the cost of education decreases as the age increases and has a minimum value at the age of 9.82, and then it has an upward trend as a child gets older. In the 2006 regression, the cost of schooling is minimized at the age of 10.93. The t-values on α1 and α2 which equals 29.65 in both 2004 and 2006 regression, indicates
that the variable Age and Age2 enter the regression with high significance.
The coefficient value of the variable Majority means that if a child belongs to the majority ethnic group, Kinh ethnicity, his/her education cost would be VND179.718 thousand higher than the education cost for ethnic minorities in 2004. The reason for this disparity is that children in minor ethnic groups received exemptions and/or subsidies for their education. The variable Red River Delta is used as a reference in interpreting the dependence of the cost of education on regional variables. The coefficient α4 has a value of -43.57 which means that a
child living in the Northeast area pays VND 43.57 thousand less than a child living in the Red River Delta. The t-statistic values in both regressions show that the variable for the Northeast is insignificant in both 2004 and 2006. It can be seen that children in the Northwest pay the lowest cost for education although this area also has the highest dropout rate among other regions. However, as noted previously, the living standard in the Northwest is far below that in other regions, and thus, the cost of education accounts for large portion of the household’s gross income.
Regions: As mentioned previously, Vietnam has 8 regions, which are represented by dummy variables. To eliminate the correlation caused by dummy variables, only 7 dummy variables were created. The Northeast has a value of 1 if the child is living in the Northeast area; otherwise, it has a value of 0. Similarly, the Northwest has a value of 1 if the child is living in the Northwest area; otherwise, it has a value of 0. The North Central has a value of 1 if the child is living in the North Central Coast area; otherwise, it has a value of 0. The South Central has a value of 1 if the child is living in the South Central Coast area; otherwise, is has a value of 0. The Central Highlands has a value of 1 if the child is living in the Central Highlands area; otherwise, it has a value of 0. The Southeast has a value of 1 if the child is living in the Southeast area; otherwise, it has a value of 0. The Mekong River Delta has a value of 1 if the child is living in the Mekong River Delta area; otherwise, it has a value of 0. The Red River Delta is used as
Since some indicator variables interact with each other to create a greater effect, this paper allows for interaction effects in its evaluation. Interactions involve the products of indicator variables. The Male*Minority interaction, which includes the gender dummy and minority dummy, has a value of 1 if a child is a minority boy. The interaction quintile2* Log of
education cost, a product of the quintile 2 dummy and log of education cost, implies the effect of
education cost if a child is from a family whose income is in the near poorest group. There are similar implications for 3 other interactions quintile3* Log of education cost, quintile4* Log of
education cost, and quintile5* Log of education cost.
3. Estimation results
As noted in previous sections, numerous major determinants of the probability of dropping out of school were defined and are presented in this section. Due to the limited availability of data, the paper is unable to consider qualitative effects in the probit model. The results of the probit model estimation for determinants of probability of a child dropping out of school in 2004 and 2006 are presented in Table 12.
Table 12: Marginal effects of major determinants on the probability of dropping out
Variables 2004 2006 dF/dx P>z dF/dx P>z Age .05250 0.000 .03485 0.000 Urban -.03414 0.053 -.18422 0.002 Majority -.02075 0.003 -.04481 0.004 Male -.02513 0.011 -.02030 0.003 Male*Minority -.03071 0.004 -.03831 0.014 Male*Rural -.03442 0.197 -.06960 0.557 Log of income -.05622 0.041 -.06461 0.008 Log of estimated schooling cost .08786 0.000 .06889 0.000 Quintile2* Log of education cost .00345 0.311 .00415 0.759 Quintile3* Log of education cost -.01091 0.818 -.02185 0.479 Quintile4* Log of education cost -.02047 0.860 -.03012 0.157 Quintile5* Log of education cost -.03452 0.690 -.03133 0.137
Number of adults in household .01296 0.513 .02001 0.281 Father’s education -.01499 0.000 -.01314 0.000 Mother’s education -.01763 0.000 -.01511 0.000 Northeast -.01961 0.238 -.01744 0.025 Northwest .07943 0.086 .05717 0.456 North Central -.03678 0.008 -.04373 0.859 South Central -.05909 0.000 -.07333 0.052 Central Highlands -.03254 0.087 -.02688 0.615 Southeast -.02055 0.123 .01721 0.041
Mekong River Delta .03298 0.071 .03531 0.000
Pseudo R2 0.3104 0.3123
Number of observations 6823 6506
Log Likelihood -2478.350 -2242.491
Source: Author’s estimation based on VLSS 2004 and 2006
The child’s age plays a significant role in the household’s decisions. Other things being equal, a child who is one year older is more likely to drop out of school by 5.25 percentage points in 2004 and by 3.48 percentage points in 2006. This is shown to be statistically significant in both regressions, which means that child’s age has a considerable role in the probability of his/her dropping out although its effect has decreased over years. The group with the highest probability is cohort in lower secondary level, as shown in Table 4. That means the majority of dropouts are children in the age group of 11-15, who currently study in lower secondary or have just finished primary schools.
All other things being equal, urban children are less likely to drop out of school than those in rural areas since urban families have stronger financial foundations and their children do not have to participate in economic activities or house work as frequently as rural children. The fact that the marginal effect increased in 2006 implies an expanding education gap between children in rural and urban areas. Despite recent substantial improvements in rural living standards, the difference between urban and rural regions has widened. In 2004, the poverty rate in rural areas was 25% while the urban poverty rate was only 3.6% (Nguyen et al., 2006). The growing poverty gap between urban and rural areas has contributed to the expanding education
The regression shows a significant correlation between a child’s ethnicity and the likelihood he or she will quit school. There are 54 ethnic groups in Vietnam, in which Kinh is the majority ethnic group, comprising 86% of the population (General Statistical Office, 2004). According to the estimation results, children from the majority group, Kinh, are less likely to dropout of school than those in other ethnic minorities by 2.05 percentage points in 2004 and 4.48 percentage points in 2006. Household poverty, again, was the main reason for the widening gap in dropout rates among ethnic groups. Poverty levels among ethnic minority communities were significantly higher than among the majority Kinh (Baulch et al., 2002). Baulch’s work showed that while Kinh people and Northern Highland minorities have benefited from economic growth in the 1990s, the Central Highland minorities were largely being left behind by the growth process. Such varied socioeconomic development level helps explain the expanding gap in dropout rates among ethnic groups.
The estimation shows that boys were less likely to drop out of school than girls by nearly 2.5 percentage points in 2004 and 2.03 percentage points in 2006. Over time the decline in the probability of dropping out was more pronounced for girls than boys and the gender effects were significant. Despite Vietnam’s effort to improve access to education for every child, girls continued to be less likely to complete their schooling (Liu, 2004). Influenced by the Chinese occupation, women were considered lower status than men both within their family and in society. The gender biases and son-preference attitudes influenced parent's decisions regarding school attendance (Liu, 2004). It is believed that a girl's place is in the home and on the farm, thus reducing the girls’ likelihood a girl will stay in school.
Minority girls are more likely to drop out of school than minority boys, which is shown in the interaction term Gender*Minority. Boys in minority groups had a (2.51% + 3.07%) lower probability of dropping out compared to minority girls in 2004. An expanding gap between girls and boys in minority groups was estimated in 2006 with a (2.03%+3.83%) higher probability for girls. Several reasons were cited as the main barrier keeping minority girls from being educated. According to a new study conducted by the MOET, the UNICEF, and the UNESCO in 2008, “The transition of ethnic minority girls in Vietnam from primary to secondary education”, economic and financial barriers are the crucial factors influencing the probability of minority girls dropping out during the transition from primary to secondary education. These girls often
during the harvest seasons. It was also pointed in the study that language is another barrier for ethnic girls. Girls from minority groups tend to know less Vietnamese, which is different from their native languages, since girls spend more time with their mothers, who have fewer opportunities to participate in social and communal activities that lead to the acquisition of Vietnamese.
Household income is associated with child’s schooling. The estimates indicate that the probability of dropping out is negatively associated with household income. The probability of dropping out decreases significantly as the household’s income increases. The probability of dropping out fell by 5.62% in 2004 and 6.46% in 2006 as the household’s income increased by 1%. The fact that the impact of household’s income on the likelihood of dropping out in 2006 was larger than it was in 2004 implies a growing effect of household income. Economic growth in Vietnam has been increasing rapidly, but income disparity is widened as the economic growth rate accelerates (Nguyen et.al 2006). High-income households have more resources and better access to quality education than low-income families. Therefore, household poverty remains a major barrier keeping children from continuing their education.
The difficulty encountered by some households in financing the education for their children seems an important cause of dropping out of school. The estimates indicate that an increase in the cost of education significantly enhances the likelihood of dropping out of school. The probability of dropping out as the education cost increased 1% for 2004 and 2006 was 8.79% and 6.89% respectively. The cost of education is the fourth highest expenditure item after food consumption, durable goods purchase, and housing costs (Henaff, 2005). In a study conducted by the MOET, the UNICEF, and the UNESCO in 2005, a girl from an ethnic minority described how the lack of school supplies affected her ability to study: “I did not have books; my parents did not have money to buy them. I have some notebooks; the teacher gave them to me. I used the front pages of the notebook for one subject, the middle pages for other subject. The teacher loaned me a pen. I study in the morning, my older sister studies in the afternoon, and we both share this one pen.”
The interaction between household income and the cost of education provides a deeper understanding of their influences on the chance to drop out. Income and expenditure directly affect a household’s welfare, and thus, they affect the decision to drop out of school. When
school. The estimates indicate that, other things being equal, a quintile-five child had 3.45% in 2004 and 3.13% in 2006 lower probability of dropping out of school than a quintile-one child as the cost of education increased 1%. Similar interpretations can be applied to other quintile groups. Children in the upper quintiles are less affected by the cost of education than those in the lower quintiles. Therefore, children in poor families, especially children in ethnic minorities are more likely to drop out of school when paying school expenses places a greater burden on their families, who cannot afford the extra expense.
Living in a larger family may increase the probability of dropping out of school. Having one more child in the family increased this probability by 3.37 percentage points and 2.19 percentage points in 2004 and 2006 respectively. Both of these impacts are statistically significant. Some studies in Africa have documented a negative effect of household size on children’s educational achievement since other family members can either provide alternative labor for a child or contribute their earnings to child’s schooling (Sibanda, 2003). The number of adults in the household, however, also shows its positive relationship with the child’s choice to drop out of school. In Vietnam, the decision to drop out of school can be the result of increasing work responsibilities when the family has more members. At the younger ages, children still have to take care of their siblings in the absence of the parents or provide income for families due to an increase in expenditures (MOET, UNICEF, and UNESCO, 2005).
The regression results support the negative relationship between parental education and a child’s probability of dropping out. As the father increased his education one more year, the probability of dropping out was reduced by 1.49 percentage points in 2004 and 1.31 percentage points in 2006. Similarly, the mother’s education had a significant negative effect on the likelihood of dropout and the mother has greater effect than the father. A child is less likely to drop out of school by 1.76 percentage points in 2004 and 1.51 percentage points in 2006 if the mother had one more year of being in school. Since education takes longer to produce a return on investment, only better educated parents are able to perceive the value of education. Therefore, parents’ attitudes regarding an expectation for return on investment affect children’s school attendance and persistence in school (Zhang et al., 2007). Minority parents, who generally have less education than Kinh parents, do not perceive lower secondary education as necessary for girls because the number of jobs for girls is limited and because girls will marry out of the family