Finite Element Modeling of Crack Tip Blunting for
Estimation of Energy Release Rate Component of Mode I
Crack near a Strength Mismatched Interface
Sunil Bhat1*, Vijay G. Ukadgaonker2
1School of Mechanical and Building Sciences, VIT University, Vellore, India
2Department of Mechanical Engineering, Indian Institute of Technology, Mumbai, India
Email: *[email protected]
Received February 28, 2013; revised April 23, 2013; accepted April 30, 2013
Copyright © 2013 Sunil Bhat, Vijay G. Ukadgaonker. This is an open access article distributed under the Creative Commons Attri-bution License, which permits unrestricted use, distriAttri-bution, and reproduction in any medium, provided the original work is properly cited.
ABSTRACT
The paper presents finite element modeling of crack tip blunting for numerical estimation of fracture parameter of a Mode I crack, in weak alloy steel, which is near and normal to the interface of elastically identical but stronger marag-ing steel. The bimetallic body is subjected to monotonic load in K dominated regime. Crack tip yield zone across the interface, treated as Dugdale’s cohesive zone, is isolated from the bimetallic domain and is modeled alone under the action of respective cohesive stress over yield zones for obtaining the contribution of mismatch between yield strength of the steels in crack energy release rate component, . Effect of far field load on is found separately from a theoretical model. Numerical and theoretical results of are in good agreement.
interface
J Jinterface
interface
J
Keywords: Crack Tip Blunting; Interface; J Integral; Strength Mismatch; Mode I Crack
1. Introduction
The effect of strength mismatch between two un-identi-cal bodies is felt by the crack tip in parent body as it ap-proaches the interface body [1] due to crack tip plasticity or yield zone spreading over into the interface body. If plasticity is modeled by Dugdale’s hypothesis, then the part of yield zone in interface body is subjected to clos-ing cohesive stress different from that actclos-ing over the part of yield zone in parent body tip due to strength mis-match between the bodies. As such, the plasticity in-duced load transfer towards the interface or parent body, depending upon the direction of strength gradient across the interface, changes the stress field around the crack which induces shielding or amplification effects at its tip. This phenomenon has also been confirmed with the help of finite element analysis [2]. J integral over the path far away from the crack tip around the interface provides the applied value of J integral, applied, whereas the integral
over the path near the crack tip in parent body without crossing the interface results in J integral at the crack tip,
J
tip
J . Jtip is less or more than depending upon
the crack approaching a stronger or weaker material re-spectively. Difference in strength between the bodies results in non-homogeneity effect of the mismatched interface that is represented by, , or J integral at the interface, [3].
a Jpplied
inh
c interface
Previously, Bhat and Ukadgaonker [4], while adopting a different approach to simplify the analysis, isolated the Dugdale’s cohesive zone from the bimetallic domain of elastically identical but strength and plastically mis-matched steels viz., Mode I cracked ASTM 4340 alloy steel joined with ultra strong MDN 250 maraging steel and modeled it alone under the effect of cohesive stress over yield zones by finite element method. J integral, 1
J
J , over the path in yield zones around the interface was obtained from the numerical solution whereas J integral,
2
J , representing the effect of far field load at the inter-face was determined separately from a theoretical model. Evaluation ofJ2 in such a manner was justified by the
fact that finite element analysis of the crack under far field load is a common exercise which previously was undertaken by many researchers with their results matching closely with the theoretical estimations. J1
and J2 were superimposed to obtain Jinterface. The
that work although it was included in the analysis. Since blunting is of significance in the problem, this paper re-ports the methodology of its inclusion in evaluation of
interface for the crack that is near and normal to the
in-terface between the stated steels using Dugdale’s plastic-ity model. Numerical value of interface is found to be in
good agreement with that obtained from the theoretical model.
J
0v
J
2. Theoretical Model
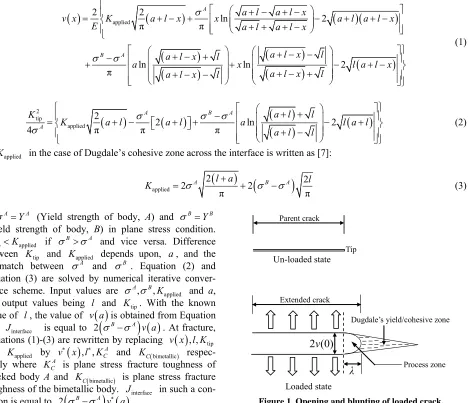
Refer Figure 1. As the crack in ductile homogenous body is subjected to monotonic far field load, its tip blunts by opening in load line direction by distance, , from the axis and by extending longitudinally by distance, . represents the size of, highly stressed, process or fracture zone at the crack tip in which the ma-terial degradation or damage occurs by nucleation of
ess zone. The value of is approximately of the order of 1.6 to 2 times the value of crack tip opening displace-ment (CTOD) or 3.2 to 4 times the value of v
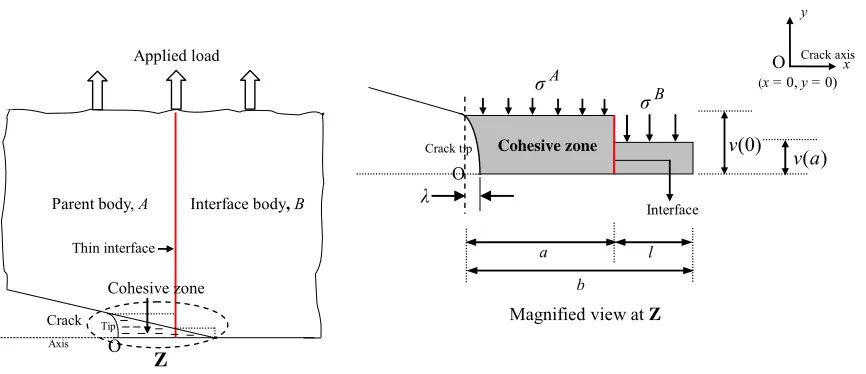
0 . The yield zone surrounds the process zone. The concept holds good for the crack in strength mismatched bi-material as well although the value of may not be exactly same as that in homogenous body.Refer Figure 2. The crack is in the parent body, A, with its tip at distance, a, from the interface body, B. Its cohesive zone has penetrated into the interface body by distance, l, with total length of cohesive zone, b, being equal to
a l
. The height of cohesive zone above the crack axis, v x
, and crack tip stress intensity parameter,tip
K , under the action of applied stress intensity parame-ter, , due to far field tensile load and cohesive stress appl
K ied
and
A B
over cohesive zones in parent and interface bodies respectively in small scale yielding (SSY) or K dominated regime are given as follows [6]:
applied
2 2
ln π
B A
K
ln 2
π π
ln 2
A a l a l x
v x a l x x a l a l x
E a l a l x
a l x l
a l x l
a x l a l x
a l x l
a l x l
(1)
2 tip
applied
2 2 ln 2
π 4
A B A
A
a l l
K
π π
K a l a l a l a l
a l l
(2)
applie
K d in the case of Dugdale’s cohesive zone across the interface is written as [7]:
applied
2 2
2 2
π π
A l a B l
K A
A
(3)
A
Y (Yield strength of body, A) and BYB
(Yield strength of body, B) in plane stress condition.
tip applied if
K K BA and vice versa. Difference
between Ktip and depends upon, , and the mismatch between applied
K
A a
and B . Equation (2) and
Equation (3) are solved by numerical iterative conver-gence scheme. Input values are applied and a,
the output values being and tip
, ,
A B K
l K . With the known value of , the value of is obtained from Equation (1). interface is equal to . At fracture,
Equations (1)-(3) are rewritten by replacing
l v a
J 2
BA
v a
, , tipv x l K and Kapplied by v x l
, , KCA and Cbimetallic respec-tively whereK
A C
K is plane stress fracture toughness of cracked body A and Cbimetallic is plane stress fracture toughness of the bimetallic body. int in such a con-dition is equal to .
K
2
BA
v a
J erface) 0 ( 2v
λ
Un-loaded state
Loaded state Tip
Dugdale’s yield/cohesive zone Parent crack
Extended crack
[image:2.595.72.546.327.730.2]Process zone
Crack axis
Parent body, A Interface body, B
Cohesive zone
Z
Tip
O Crack
Thin interface
Magnified view at Z
B σ
Cohesive zone
a
) (a v
Interface
x
(x = 0, y = 0)
y
O
) 0 ( v
Applied load
Axis
l
b A σ
λ
Crack tip
[image:3.595.75.508.85.272.2]O
Figure 2. Cohesive zone across the bimerallic interface.
3. Case Study
The stated theoretical model is applied to material com-bination of weak ASTM 4340 alloy steel, A, and strong MDN 250 maraging steel, B. Refer Table 1. The results presented as Case I and Case II, represent fracture data of alloy steel at different positions of crack near the inter-face of maraging steel when subjected to monotonic load in SSY regime under plane stress condition. Material and crack data are suitably selected. Refer Figure 3. Stress field at the interface of maraging steel in both the cases, defined conventionally by,
bimetallic
higher order terms 2π
C
K
f
a ,
reveals nil yielding of maraging steel at and beyond the interface. But on viewing the bimetallic domain in com-parison with the homogenous body of alloy steel, load is still transferred elastically to maraging steel due to its higher yield limit than that of alloy steel. Elastically strained zone in maraging steel under stress less than its yield strength is replaced by much smaller cohesive zone under the action of larger cohesive stress to make the application of the theoretical model possible. However, maraging steel shall also yield as the crack grows nearer towards the interface. Before undertaking the finite ele-ment analysis, the results of the selected cases are veri-fied in the following manner:
Case I
2
tip
2 bimetallic applied
interface
112.5 N mm
134.3 N mm
2 21.78 N mm
A C
C
B A
K J
E K J
E
J v a
Table 1. Results of case study.
5
700 MPa, 1800 MPa
2 10 MPa, 0.3
150 MPa m
A A B B
A B A B
A C
Y Y
E E E
K
Parameter CASE I CASE II
a (mm) 7.21 6.31
l (mm) 1.22 1.53
bimetallic
C
K
MPa m
163.9 167.8
v a (mm)
0.0099 0.01286
2
0 0.08
2
A C A A
K v
E
mm
Y: Yield strength; : Poisson’s ratio
E: Modulus of elasticity
A C
K : Plane stress fracture toughness of cracked body
bimetallic
C
K : Plane stress fracture toughness of bimetallic body Subscript A and B - Alloy steel and maraging steel respectively
Stress
Strain
Alloy steel Maraging steel
A
Y
B
Y
Strain at/beyond interface
[image:3.595.319.529.526.717.2]Load transfer
tip
applied
interface
112.5 N mm 140.78 N mm
28.3 N mm J
J J
A C
K of the alloy steel is assumed as 150 MPa m.
tip
K is considered as equal to A C
K in the theoretical model due to fracture conditions. The value of l is iteratively assumed in Equation (3) till the output applied
satisfies Equation (2). Final value of applied equals
K K bimetallic
C . Since the crack faces a stronger steel
(weak-strong interface), K
bimetal
C
K lic is greater than A C
K .
The Value of
KCbimetallicKCA
is more in Case II thanin Case I because the crack is nearer to the interface in Case II. The conservation of energy release rate criterion,
applied tip interface, is satisfied in both the cases. Due
to stronger interface, tip appl and has a
positive value in both the cases.
J J J
ied
J J Jinterface
4. Finite Element Analysis and Results
The cohesive zones of both the cases are modeled by finite element method. Half of the cohesive zone is only considered in each case due to symmetry. , at
frac-ture, tapers from
v x
0v at crack tip to at the interface, finally reducing to zero at the tip of the cohe-sive zone. As cohecohe-sive zone has minimal lateral dimen-sions when compared to its length, its height is assumed constant as
v a
0v over distance, a, in alloy steel and over distance, l, in maraging steel to facilitate modeling.
v a
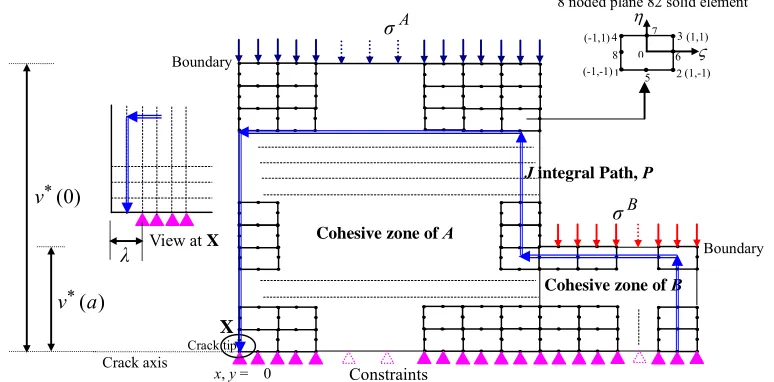
Refer Figure 4. 2D, 8 noded quadrilateral plane 82 elements are chosen for meshing. Cohesive stress, A
and B, are applied as pressure in -ve y direction over
respectively. Plane stress with thickness option is adopted. Since the blunting zone is unsupported and the value of is not exactly known, nodes ahead of the crack tip, up to the distance of , are initially left unconstrained. Remaining nodes on crack axis are constrained in y direction. The mesh model is displayed in Figure 5.
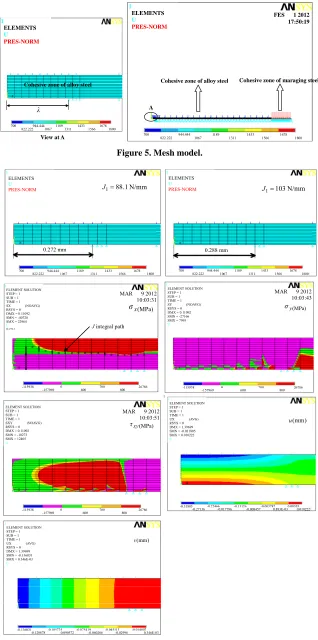
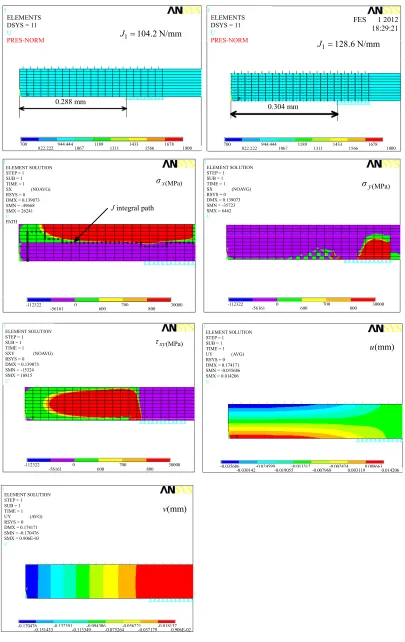
3.2v 0Using the post-processor displacement and stress solu-tions, the required values are mapped over chosen path, P, around the interface to obtain J integral, J1, from the ex-
pression, 1 ed x d y P
u v
d
J W y T s T s
x x
[8], wheree
W is the strain energy density, Txx xn xy yn and
y y y xy x
T n n are the traction components with nx
and ny representing unit vectors in x and y directions and u
and v as displacements in the stated directions. Since co-hesive stress has a closing or compressive effect over the crack that opposes the effect of far field tensile load, the value of J1 is taken with a negative sense. Sample stress
and displacement plots near the crack tip in cohesive zone of alloy steel in Case I and Case II are presented in Figure 6 and Figure 7 respectively. The plots at the in-terface are available elsewhere [4]. Since the material properties employed in the analysis are linear in nature, very high stresses are found to develop at certain top locations in the cohesive zone due to bending caused by the unsupported part. This however can be eliminated by using the actual elastic-plastic properties of alloy steel. However, to avoid these hypothetical values, J integral paths are made to pass only through those areas that are elastically stressed. Different cyclic paths are tried. Ap-propriate value of J1 is obtained on path P that reaches
right up to the crack tip where displacement values are
8 noded plane 82 solid element
Boundary
Cohesive zone of A
Constraints
Crack axis
1 2
3 4
5 6 7
8
x, y = 0
0,
Boundary
(-1,-1)
(-1,1) (1,1)
(1,-1)
B σ A
σ
X
λ View at X
Crack tip
Cohesive zone of B
) 0 (
v
) (a v
[image:4.595.91.478.523.714.2]J integral Path, P
λ A
View at A
Cohesive zone of alloy steel Cohesive zone of alloy steel Cohesive zone of maraging steel
1
ELEMENTS
U
1
ELEMENTS
U FES 1 2012 17:50:19
PRES-NORM
PRES-NORM
822.222 1067 1311 1566 1800
700 944.444 1189 1433 1678
822.222 1067 1311 1566 1800
[image:5.595.138.456.84.724.2]700 944.444 1189 1433 1678
Figure 5. Mesh model. ) mm ( v N/mm 1 . 88 1 J (MPa) y σ ) mm ( u ) mm ( v N/mm 103 1 J (MPa) x σ σy(MPa) (MPa) xy τ J integral path 1 ELEMENTS U 1 ELEMENTS U PRES-NORM PRES-NORM 0.272 mm 0.288 mm MAR 9 2012 10:03:43 822.222 1067 1311 1566 1800
700 944.444 1189 1433 1678
822.222 1067 1311 1566 1800
700 944.444 1189 1433 1678
1 ELEMENT SOLUTION STEP = 1 SUB = 1 TIME = 1 SY (NOAVG) RSYS = 0 DMX = 0.11092 SMN = -27166 SMX = 7995 U 1 ELEMENT SOLUTION STEP = 1 SUB = 1 TIME = 1 SX (NOAVG) RSYS = 0 DMX = 0.11092 SMN = -40728 SMX = 22964 U MAR 9 2012 10:03:31 PATH -115938 0 700 26786 -115938 0 700 26786
-157969 600 800 -157969 600 800
1 ELEMENT SOLUTION STEP = 1 SUB = 1 TIME = 1 UX (AVG) RSYS = 0 DMX = 1.39699 SMN = -0.031805 SMX = 0.010222 U 1 ELEMENT SOLUTION STEP = 1 SUB = 1 TIME = 1 SXY (NOAVG) RSYS = 0 DMX = 0.11092 SMN = -10273 SMX = 12405 U MAR 9 2012 10:03:51 -0.31805 -0.22466 -0.13126 -0.003787 0.00553 -0.27136 -0.017796 -0.008457 0.883E-03 0.010222 -115938 0 700 26786
-157969 600 800
1
ELEMENT SOLUTION STEP = 1 SUB = 1 TIME = 1 UX (AVG) RSYS = 0 DMX = 1.39699 SMN = -0.136031 SMX = 0.346E-03
U
-0.136031 -0.105725 -0.075419 -0.045113 -0.014807 -0.120878 -0.090572 -0.060266 -0.02996 0.346E-03
(MPa)
x
σ
(MPa)
y
σ
J integral path
N/mm 2 . 104
1 J
N/mm 6 . 128
1 J ELEMENTS
DSYS = 11
U
ELEMENTS DSYS = 11
U
FES 1 2012 18:29:21
PRES-NORM PRES-NORM
0.288 mm 0.304 mm
822.222 1067 1311 1566 1800
700 944.444 1189 1433 1678
822.222 1067 1311 1566 1800
700 944.444 1189 1433 1678
1 ELEMENT SOLUTION STEP = 1 SUB = 1 TIME = 1 SX (NOAVG) RSYS = 0 DMX = 0.139073 SMN = -49668 SMX = 26241 U PAT 1 ELEMENT SOLUTION STEP = 1 SUB = 1 TIME = 1 SX (NOAVG) RSYS = 0 DMX = 0.139073 SMN = -35723 SMX = 6462 U H -112322 0 700 30000
-112322 0 700 30000
-56161 600 800
-56161 600 800
) mm ( u ) mm ( v (MPa) xy τ 1 ELEMENT SOLUTION STEP = 1 SUB = 1 TIME = 1 SXY (NOAVG) RSYS = 0 DMX = 0.139073 SMN = -15324 SMX = 18815 U -112322 0 700 30000
-56161 600 800
1
ELEMENT SOLUTION STEP = 1 SUB = 1 TIME = 1 UY (AVG) RSYS = 0 DMX = 0.174171 SMN = -0.035686 SMX = 0.014206 U
1
ELEMENT SOLUTION STEP = 1 SUB = 1 TIME = 1 UY (AVG) RSYS = 0 DMX = 0.174171 SMN = -0.170476 SMX = 0.906E-03 U
-0.035686 -0.024599 -0.013512 -0.002424 0.008663 -0.030142 -0.019055 -0.007968 0.003119 0.014206
[image:6.595.94.499.83.725.2]-0.170476 -0.132391 -0.094306 -0.056221 -0.018137 -0.151433 -0.113349 -0.075264 -0.037179 0.906E-02
higher. The size of or the number of unconstrained nodes is then increased and J1 is determined in each state
till J1 J2 . The iterative scheme is finally stopped when J1 J2 because interface has a positive value
in the present cases. Average of J1 obtained at all the
values of
J
provides its magnitude. Refer Equation (1). Contribution of far field load over, v a
, is determined by the term 2 bimetallic 2π
C
K l
E
. Integral,
2
J , is there- fore equal to
bimetallic
interface 1 24 2
, π
B A
C
K l J J J
E
In Case I, the condition, J1 J2 , is satisfied at and
beyond the of 0.288 mm. At of 0.256 mm and 0.272 mm, J1 is -67.54 N/mm and -88.10 N/mm
respec-tively. Average of J1 values is –77.82 N/mm. J2 is
ob-tained as +100.46 N/mm. Jinterface given by J1J2 is
equal to 22.64 N/mm. This value is close to +21.78 N/mm obtained from the theoretical model. Likewise in Case II, J1 J2 , is satisfied at and beyond of
0.304 mm. At of 0.256 mm, 0.272 mm, 0.288 mm, J1
is –65.0 N/mm, –87.1 N/mm and –104.2 N/mm respec-tively. Average of J1 values is –85.44 N/mm. J2 and
interface are equal to +115.18 N/mm and +29.74 N/mm
respectively. Value of interface is again in good
agree-ment with the theoretical value of +28.3 N/mm. J
J
J1 is not found to be path independent. As mentioned
earlier, appropriate values of this integral are obtained over paths reaching up to the crack tip nodes where dis-placements are higher. On paths terminating at con-strained nodes, the displacements are less that result in reduced value of the integral. As the result, is also not path independent. interface
J
5. Conclusion
Blunted crack tip near the interface of elastically identi-cal but strength and plastiidenti-cally mismatched bodies is modeled by finite element method to numerically obtain J integral, J1,that represents the contribution of mismatch
in yield strength between the bodies on crack energy re-lease rate component, interface. Numerical results are
well validated thereby supporting the feasibility of
iso-lating the cohesive zone from the bimetallic domain and modeling it alone under the dual action of un-identical cohesive stress over yield zones in parent and interface bodies. The approach is simple and reasonably accurate.
J
6. Acknowledgements
Support received from the School of Mechanical Build-ing Sciences, VIT University, Vellore, India durBuild-ing the course of this work is gratefully acknowledged.
REFERENCES
[1] S. Suresh, Y. Sugimura and E. K. Tschegg, “The Growth
of a Fatigue Crack Approaching a Perpendicularly-Ori-
ented, Bimaterial Interface,” Scripta Metallurgica et
Ma-terialia, Vol. 27, No. 9, 1992, pp. 1189-1194. doi:10.1016/0956-716X(92)90597-8
[2] Y. Sugimura, P. G. Lim, C. F. Shih and S. Suresh,
“Frac-ture Normal to a Bimaterial Interface: Effects of Plasticity
on Crack Tip Shielding and Amplification,” Acta
Metal-lurgica et Materialia, Vol. 43, No. 3, 1995, pp. 1157-
1169. doi:10.1016/0956-7151(94)00295-S
[3] J. Predan, N. Gubeljak and O. Kolednik, “On the Local
Variation of the Crack Driving Force in a Double Mis-
matched Weld,” Engineering Fracture Mechanics, Vol.
74, No. 11, 2007, pp. 1739-1757. doi:10.1016/j.engfracmech.2006.09.015
[4] S. Bhat and V. G. Ukadgaonker, “Dugdale Cohesive Zone
Modeling to Evaluate J Integral at the Interface of Strength
Mismatched Steels: A Simplified Numerical Approach,”
Finite Elements in Analysis and Design, Vol. 46, No. 7,
2010,pp. 601-610. doi:10.1016/j.finel.2010.02.007
[5] K. Hellan, “Introduction to Fracture Mechanics,”
Ma-Graw-Hill Book Company, 1985, p. 92.
[6] D. Wappling, J. Gunnars and P. Stahle, “Crack Growth
across a Strength Mismatched Bimaterial Interface,” In-
ternational Journal of Fracture, Vol. 89, No. 3, 1998, p. 238.
[7] F. O. Reimelmoser and R. Pippan, “The J-Integral at
Dugdale Cracks Perpendicular to Interfaces of Materials
with Dissimilar Yield Stresses,” International Journal of
Fracture, Vol. 103, No. 4, 2000, p. 404.
[8] J. R. Rice, “A Path Independent Integral and
Approxi-mate Analysis of Strain Concentration by Notches and
Cracks,” Journal of Applied Mechanics, Vol. 35, No. 2,