ISSN Online: 2327-5227 ISSN Print: 2327-5219
DOI: 10.4236/jcc.2018.611015 Nov. 19, 2018 155 Journal of Computer and Communications
Research on Suppression Method of Warhead
Infrared Image Background Based on Small
Area Filtering
Yehui Li, Shaohua Sun
Branch 30, Unit 91049, Qingdao, China
Abstract
In order to reduce the computational complexity of searching in massive in-formation in detecting of warhead targets, background removal is usually the first step of target detection algorithm in sequential frame images. In this pa-per, an adaptive multi-exposure time preserving star edge small area filtering background removal algorithm is proposed, which can suppress the back-ground and preserve the target and star edges. This algorithm not only en-sures the accuracy of centroid and orbit determination, but also reduces false alarm and improves tracking accuracy.
Keywords
Warhead, Infrared Image, Suppression Method
1. Introduction
In order to complete the warhead targets detection, it is necessary to pre-process the image before implementing the specific target detection algorithm. The pre-processing is the premise of target detection. The purpose is to suppress the noise in the image and improve the signal-to-noise ratio of the target [1]. In view of various complex background conditions, there are many kinds of image pre-processing methods for dim and small targets, and these methods have different characteristics. It is these differences that lead to differences in the applicability of research objects [2]. None of the existing methods can show the best prepro-cessing effect for all complex background. In application, different pretreatment methods should be chosen according to specific background conditions. Infrared image preprocessing mainly focuses on inducing of image noises and image en-hancement.
How to cite this paper: Li, Y.H. and Sun, S.H. (2018) Research on Suppression Me-thod of Warhead Infrared Image Back-ground Based on Small Area Filtering. Jour-nal of Computer and Communications, 6, 155-161.
https://doi.org/10.4236/jcc.2018.611015
DOI: 10.4236/jcc.2018.611015 156 Journal of Computer and Communications
Usually, a threshold is set in background removal. If the pixel is smaller than the threshold, it is considered as the background. If the threshold is larger than the threshold, it is considered as the target. Threshold setting methods include optimal threshold and local optimal threshold. Another method uses the back-ground modeling method to estimate the mean and standard deviation of the background, set a global threshold, and use the statistics of the neighborhood of the point to judge whether the background is or not. It is essentially a transfor-mation of the background and the target probability density function, making it more conducive to highlighting the target and suppressing noise. In this paper, a new algorithm based on small area filtering is proposed, which uses global thre-shold [3]. To some extent, the algorithm is not sensitive to threthre-shold. Under the same threshold, it can reduce 70% - 80% noise points compared with direct threshold segmentation.
2. Imaging Model for Space Targets
The exposure time of the experimental image data in this paper is 300 ms, 700 ms, 1100 ms and 1600 ms respectively, and the corresponding frames are 352, 217, 281 and 302. The image size is 1024 * 1024, and the pixel gray level is 16 bits. Figure 1 gives a typical image of exposure time of 4 files (only suitable gray level segments are displayed for easy observation) and its gray level histogram [4]. From the statistical results of a single frame histogram, the histogram is Gaus-sian distribution, and the probability density function is shown in Formula (1).
2 2 ( ( , ) ) / 1
( ( , )) 2
s x y u
p s x y e σ
πσ
− −
= (1)
( , )
s x y represents the gray value of points whose coordinates is ( , )x y , u and
σ
represents the mean value and standard deviation of the background respec-tively.According to a large number of statistics, most of the images belong to the background, where stars and targets only account for a small part. The ratio of stars and target pixels to total primes does not exceed 3%.
The signal of noise ratio (SNR) can be calculated according to the formula of SNR (2).
10
20log T B
SNR= σ− (2)
T denotes the mean value of targets, including background. B denotes mean value of the neighborhood background.
σ
represents the standard deviation ofneighborhood background, where the neighborhood takes the target centroid region to expand 10 pixels, excluding the target itself.
3. Estimation of the Mean Value and Variance of Background
with Least Squares Fitting Method
DOI: 10.4236/jcc.2018.611015 157 Journal of Computer and Communications
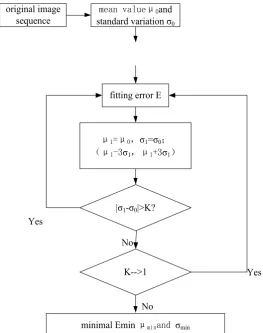
Gaussian distribution, and some stars have very high gray level. The procedure of least squares fitting for mean and variance of background clutter is shown in Figure 1.
Based on the above methods, the statistical distributions of mean and stan-dard deviation of background noise in 1152 frames of 300 ms, 700 ms, 1100 ms and 1600 ms are estimated as shown in Table 1.
4. Removal of Small Area Filter Background
[image:3.595.242.506.235.569.2]When the signal-to-noise ratio of the target is low, the gray value of the back-ground is partially interlaced, and cannot be separated by a global threshold. If
[image:3.595.208.540.627.731.2]Figure 1. Flow chart of least squares estimation for background clutter parameters.
Table 1. Statistics of mean and standard deviation of background noise.
exposure
time (ms) frames maximum background mean value background mean value minimum maximum background standard variation
300 352 187.132 175.943 10.182
700 217 228.115 237.360 10.716
1100 281 269.625 259.822 14.332
1600 302 382.4960 357.406 17.486
original image
sequence standard variation σmean valueμ0and 0
fitting error E
μ1=μ0,σ1=σ0;
(μ1-3σ1,μ1+3σ1)
|σ1-σ0|>K?
K-->1
minimal Emin μminand σmin
Yes Yes
No
DOI: 10.4236/jcc.2018.611015 158 Journal of Computer and Communications
the threshold is too small, it will leave a lot of noise and too large image edge; if the threshold is too large, it will filter out the small and weak targets, and the image edge is not completely maintained, thus affecting the centroid positioning accuracy [5]. If we combine other filtering methods on the basis of direct thre-shold segmentation, such as filtering out the outliers whose connected area is less than a certain threshold, it is not appropriate. Although most isolated noise points are filtered out, it is difficult to ensure that small targets smaller than this threshold are not filtered out.
If we consider other filtering method such as median filtering, mean filtering, low-pass filtering, wavelet noise reducing for processing, the effect is not ideal.
Then the usual approach is to select a fixed threshold, by selecting an optimal threshold, so that the probability of such false segmentation is minimized. As-suming that an image contains only two main gray value regions (target and background), its histogram can be regarded as an approximation of the gray value probability density function p z( ). This probability density function is actually the sum of the 2 unimodal density functions of the target and the back-ground. If the form of the probability density function is known, it is possible to select an optimal threshold to divide the image into two types of regions and minimize the error.
There are 1 images mixed with additive Gauss noise. Its mixed probability density equation can be expressed as:
1
1 1 2 2
2 2
1 2 2
2 2
1 2
1 2
( ) ( ) ( )
( ) ( )
exp[ ] exp[ ]
2 2
p z P p z P p z z
P µ P z µ
σ σ
πσ πσ
= +
− −
= − + − (3)
Among them, µ1 and µ2 denote the average gray value of the background
and the target area. σ1 and σ2 denote the mean square deviation of the mean
value. P1 and P2 denote the prior probability of the gray value of the
back-ground and the target area respectively. According to the definition of probabil-ity P P1+ 2=1, there are five unknown parameters in the mixed probability
den-sity. If these parameters can be obtained, the mixed probability density can be determined.
Figure 2(b), Figure 2(c) illustrates that, under the same threshold, the num-ber of false targets in the small region filter is 0, and T = +µ 2σ the direct threshold segmentation results in a large number of false targets; Figure 2(b), Figure 2(d) comparison shows that even if the segmentation threshold is one more standard deviation, there are still four false targets in the graph Figure 2(d), and the edges of the star image cannot be well preserved.
Figure 3 shows the trajectory of maximum projection after small-area back-ground filtering of multi-frame images, where the sequence contains dim and small targets with SNR which is close to 4.
DOI: 10.4236/jcc.2018.611015 159 Journal of Computer and Communications
(a) (b)
(c) (d)
Figure 2. Comparison of three background removal techniques. (a) Original; (b)
2
[image:5.595.236.515.67.361.2]T= +µ σ; (c) T= +µ 2σ; (d) T= +µ 3σ .
Figure 3. Segmentation results of dim and small target in three consecutive frames.
5. Algorithm Performance
5.1. Sensitivity
The algorithm sensitivity is measured by adding a simulated target with constant SNR in the image and using Monte Carlo simulation to calculate the segmenta-tion probability of the target when the threshold T = +µ 2σ is fixed.
[image:5.595.217.532.405.580.2]DOI: 10.4236/jcc.2018.611015 160 Journal of Computer and Communications Figure 4. The pixel value of the varies with the distance from the center point.
5.2. Time Consuming
Headings, or heads, are organizational devices that guide the reader through your paper. There are two types: component heads and text heads.
Component heads identify the different components of your paper and are not topically subordinate to each other. Examples include Acknowledgements and References and, for these, the correct style to use is “Heading 5”. Use “figure caption” for your Figure captions, and “table head” for your table title. Run-in heads, such as “Abstract”, will require you to apply a style (in this case, non-italic) in addition to the style provided by the drop down menu to differen-tiate the head from the text. In this paper, four groups of 1152 frames are used to verify the time-consuming algorithm. The computational complexity of the al-gorithm is mainly on Gaussian least square fitting to estimate the mean and va-riance of the background. The complexity of the algorithm is mainly time-consuming statistics. Table 2 is the algorithm time consuming statistical value. The algorithm is developed under VS2005, the processor's main frequency is 1.8 G, and the memory is 2G. Statistical results show that the algorithm has good real-time performance and meets engineering requirements.
From the statistical results, we can see that 300 ms, 700 ms, 1100 ms and 1600 ms have great differences, the main reason is that the least square fitting itera-tion times are different.
6. Conclusion
ra-DOI: 10.4236/jcc.2018.611015 161 Journal of Computer and Communications
tionality of the algorithm is discussed from the point of view of the optimal threshold segmentation and likelihood ratio. After analyzing the performance of the algorithm, Monte Carlo simulation is used to verify the segmentation limit of the dim and small targets that the algorithm can reach, and the time-consuming statistical algorithm is used to process the real images. The results show that the proposed algorithm is insensitive to the global thresholding. Compared with the direct thresholding method, the proposed algorithm can reduce 70% - 80% of the noise points when the thresholds are the same.
Conflicts of Interest
The authors declare no conflicts of interest regarding the publication of this pa-per.
References
[1] Chen, X.P. (2006) Russia Strengthens the Collection and Research of Characteristic Data. Target and Environmental Characteristic Management and Technical Re-search Reference, 07.
[2] Ping, et al. (2005) Study on Target Surface Temperature and Infrared Penetration. Aerospace Electronic Warfare, 21, 5-16.
[3] Li, K.L., Liu, Y.X. and Li, X. (2009) Target Recognition Simulation Research. Mod-ern Radar, 28, 12-14.
[4] Liu, T., Jiang, W.D., Li, X. and Lu, H.Z. (2009) Simulation and Calculation of Target Dynamic Infrared Radiation Characteristics. Infrared and Laser Engineering, 37, 955-958.

![[−2]proPSA versus ultrasensitive PSA fluctuations over time in the first year from radical prostatectomy, in an high-risk prostate cancer population: A first report](data:image/gif;base64,R0lGODlhAQABAIAAAP///wAAACH5BAEAAAAALAAAAAABAAEAAAICRAEAOw==)