OIL RECOVERY AND CHARACTERIZATION OF BOTTOM TANK OILY SLUDGE FROM BREGA OIL
REFINERY IN LIBYA BY SOLVENT EXTRACTION
1,*
El Kady, G. M.,
2El-Bassousy,
1
Department of Chemistry, Faculty of Science, Al
2
Department of Analysis and Evaluation, Egyptian Petroleum Research Institute (EPRI)
ARTICLE INFO ABSTRACT
The aim of this work is to recover and characterize oil from Bottom Tank Oily Sludge from Brega oil refinery in Libya. The
sludge and secondly to improve oil utilization efficiency as the sludge has a high content of valuable hydrocarbons. Oily sludge and recovered oil were characterized and key pa
including water content, light and heavy hydrocarbon content, solid content ash and salt content, carbon residue, density, specific gravity, API (American Petroleum Institute) gravity, viscosity, SARA analysis and gas chromatography.
from solid and semi
and solvent volume upon oil recovery were investigated. Within the range of the studied operating conditions herein, the maximum oil recovery obtained varied from 82.5
amount of oil within the sludge and the solvent efficiency used for extraction. A detailed study of the kinetics of solvent extraction based on oil recovery wa
Copyright © 2015 El Kady et al. This is an open access article distributed under the Creative Commons Att distribution, and reproduction in any medium, provided the original work is properly cited.
INTRODUCTION
The petroleum refining industry generates relatively large amounts of waste from various sources, including wastewater, tank bottoms, slop oil emulsion solids and various sludges from oil/water/solids separation. However, the accumulation of crude storage tank bottoms is a comparatively serious problem experienced by most refineries worldwide
and Al-Futaisi, 2007). The settling out of the sand, rust and heavy fractions in the crude oil results in a loss of ullage in refinery crude storage tanks, and can ultimately cause refinery problems when slugs of this material are introduced into the plant. Most refineries have managed the problem by accumulating these sludges in a few of their crud
Disposal of these wastes prior to the aggressive environmental regulation was relatively easy, simply by landfilling of solid wastes into a refinery's own landfarm or to commercial landfills. However, since 1990’s, the options available for the disposal of this material have been limited and economically prohibitive (ASTM, 2001, ASTM, 2012 and ASTM,
*Corresponding author: El Kady, G. M.,
Department of Chemistry, Faculty of Science, Al Cairo, Egypt.
ISSN: 0975-833X
Vol.
Article History:
Received 08th August, 2015
Received in revised form 06th September, 2015 Accepted 25th October, 2015
Published online 30th November,2015
Key words:
Petroleum cuts, solvent extraction, Petroleum sludge, shaking time, Oil recovery, SARA analysis and Gaschromatography.
Citation: El Kady, G. M., El-Bassousy, A. A., Elsayed M. Elnaggar and Walid Bin Shrrada Ibrahim.
characterization of bottom tank oily sludge from brega oil refinery in libya by solvent extraction
Research, 7, (11), 22397-22411.
RESEARCH ARTICLE
OIL RECOVERY AND CHARACTERIZATION OF BOTTOM TANK OILY SLUDGE FROM BREGA OIL
REFINERY IN LIBYA BY SOLVENT EXTRACTION
, A. A.,
1Elsayed M. Elnaggar and
2Walid Bin Shrrada Ibrahim
Chemistry, Faculty of Science, Al-azhar University, Cairo, Egypt
Analysis and Evaluation, Egyptian Petroleum Research Institute (EPRI)
ABSTRACT
The aim of this work is to recover and characterize oil from Bottom Tank Oily Sludge from Brega oil refinery in Libya. The benefits would be two-folds, firstly to reduce the environmental impact of oily sludge and secondly to improve oil utilization efficiency as the sludge has a high content of valuable hydrocarbons. Oily sludge and recovered oil were characterized and key pa
including water content, light and heavy hydrocarbon content, solid content ash and salt content, carbon residue, density, specific gravity, API (American Petroleum Institute) gravity, viscosity, SARA analysis and gas chromatography. Four different types of solvent were used to recover oil from solid and semi-solid sludge. The effect of various parameters namely shaking time, Temperature and solvent volume upon oil recovery were investigated. Within the range of the studied operating conditions herein, the maximum oil recovery obtained varied from 82.5
amount of oil within the sludge and the solvent efficiency used for extraction. A detailed study of the kinetics of solvent extraction based on oil recovery was carried out
is an open access article distributed under the Creative Commons Attribution License, which distribution, and reproduction in any medium, provided the original work is properly cited.
The petroleum refining industry generates relatively large amounts of waste from various sources, including wastewater, tank bottoms, slop oil emulsion solids and various sludges eparation. However, the accumulation of crude storage tank bottoms is a comparatively serious problem experienced by most refineries worldwide (Al-Futaisi, 2007
. The settling out of the sand, rust and results in a loss of ullage in refinery crude storage tanks, and can ultimately cause refinery problems when slugs of this material are introduced into the plant. Most refineries have managed the problem by accumulating these sludges in a few of their crude tanks. Disposal of these wastes prior to the aggressive environmental regulation was relatively easy, simply by landfilling of solid wastes into a refinery's own landfarm or to commercial landfills. However, since 1990’s, the options available for the sposal of this material have been limited and economically
and ASTM, 2013).
Department of Chemistry, Faculty of Science, Al-azhar University,
It has been recognized as a hazardous waste in many countries, and thus its improper management can adversely affect the environment and public health (
ASTM, 2001). Given the relatively high oil content in sludge, oil recovery could be the most desirable management option since it can not only generate profit but also reduce waste volume and pollutant concentration (
2012, ASTM, 2013). Driven by increasingly stringent
regulations which have banned the direct land dispo sludge, various physical (ASTM,
chemical (ASTM, 2001, 2001)
2007 and Zubaidy, 2010) methods have been developed for its
treatment.
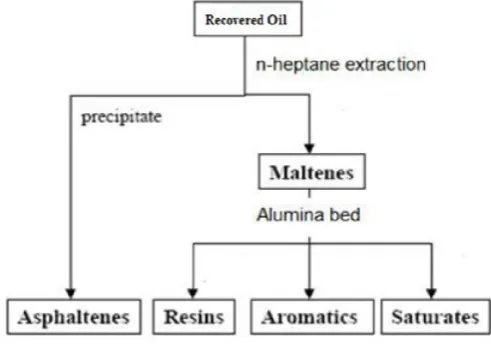
Among them, solvent extraction is a simple process by mixing oily waste and solvent in an appropriate proportion to ensure adequate miscibility of oil in solvent, while most water and solids are rejected as unwanted impurities which can be removed by gravitational settling or centrifugation. process diagram is depicted in Figure 1. A small amount of solvent is added to the selected hydrocarbon fluids as a carrier. The mixture is preheated to the predetermined temperature in a heater before being pumped to the sludges holding tank. The carrier fluid is circulated in the system continuously for certain time depending on the type of fluid.
International Journal of Current Research
Vol. 7, Issue, 11, pp.22397-22411, November, 2015
INTERNATIONAL
Bassousy, A. A., Elsayed M. Elnaggar and Walid Bin Shrrada Ibrahim.
characterization of bottom tank oily sludge from brega oil refinery in libya by solvent extraction”, International Journal of Current
OIL RECOVERY AND CHARACTERIZATION OF BOTTOM TANK OILY SLUDGE FROM BREGA OIL
Bin Shrrada Ibrahim
azhar University, Cairo, Egypt
Analysis and Evaluation, Egyptian Petroleum Research Institute (EPRI)
The aim of this work is to recover and characterize oil from Bottom Tank Oily Sludge from Brega oil folds, firstly to reduce the environmental impact of oily sludge and secondly to improve oil utilization efficiency as the sludge has a high content of valuable hydrocarbons. Oily sludge and recovered oil were characterized and key parameters were measured including water content, light and heavy hydrocarbon content, solid content ash and salt content, carbon residue, density, specific gravity, API (American Petroleum Institute) gravity, viscosity, Four different types of solvent were used to recover oil solid sludge. The effect of various parameters namely shaking time, Temperature and solvent volume upon oil recovery were investigated. Within the range of the studied operating conditions herein, the maximum oil recovery obtained varied from 82.5 – 86.6% depending upon the amount of oil within the sludge and the solvent efficiency used for extraction. A detailed study of the
s carried out
ribution License, which permits unrestricted use,
recognized as a hazardous waste in many countries, and thus its improper management can adversely affect the and public health (Al-Futaisi, 2007, 2007 and
. Given the relatively high oil content in sludge, most desirable management option since it can not only generate profit but also reduce waste me and pollutant concentration (Al-Futaisi, 2007, ASTM,
. Driven by increasingly stringent regulations which have banned the direct land disposal of oily
ASTM, 2012, ASTM, 2001, 2001)
), and biological (Ramaswamy,
methods have been developed for its
Among them, solvent extraction is a simple process by mixing oily waste and solvent in an appropriate proportion to ensure adequate miscibility of oil in solvent, while most water and solids are rejected as unwanted impurities which can be removed by gravitational settling or centrifugation. The depicted in Figure 1. A small amount of solvent is added to the selected hydrocarbon fluids as a carrier. The mixture is preheated to the predetermined temperature in a heater before being pumped to the sludges holding tank. The in the system continuously for certain time depending on the type of fluid.
INTERNATIONAL JOURNAL OF CURRENT RESEARCH
Bassousy, A. A., Elsayed M. Elnaggar and Walid Bin Shrrada Ibrahim. 2015. “Oil recovery and
No additional solvent is added to the re-circulating fluid. Liquid and solid samples are collected and analyzed. Solvent extraction can be both an effective and cost efficient process for separating hazardous contaminants from non-hazardous materials and concentrating the hazardous materials for further treatment. Because the contaminants are separated, the treatment selected can be targeted to the contaminant. As a result of solvent extraction, some contaminants may be recycled or reused in manufacturing, thus, minimizing disposal requirements (Environmental Protection Agency, United States, 1996).
MATERIALS AND METHODS
Chemical materials
Toluene 99% and Xylene 99% from El-Ameria Petroleum Company. All chemicals of technical grades.
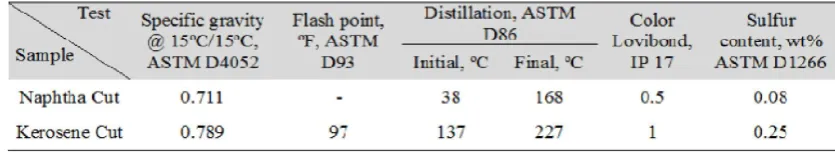
Naphtha cut (straight run naphtha), (Table 1).
Kerosene cut (straight run naphtha), (Table 1)
Two different types of solid and semi-solid sludge from Brega Oil Refinery in Libya.
Solvent extractions of samples
The solvents chosen in our study are toluene, xylene, naphtha cut and kerosene cut. Kinetic study was performed to estimate the ideal conditions of extraction.
Sampling Techniques
Representative samples from two different Brega crude oil tanks (TK-C1 & TK-C5) are collected during manual clean. Solid sample from TK-C5 and semi dried sample from TK-C1.
Characterization of Studied Oily Sludge
This type of sludge is a combination of hydrocarbons, sediments, paraffin and water. Typical composition of sludge is 10–12% solids, 30 –50% water and 30–50% by weight oil (Einar (2002), Saikia et al. (2003) and Silva et al. (1998)). The following fractions of sludge were assessed.
Water content
The American Society for Testing and Materials (ASTM) standard method D95 was used for measuring the water
content of the oily sludge. The oily sludge was heated with toluene (solvent) which co-distilled with the water in the sample in a fume cupboard. Condensed solvent and water were continuously separated in a trap, and the water settled as the bottom layer. The condensed liquid containing water and hydrocarbon was transferred to a graduated cylinder. A water layer with higher density was at the bottom of the cylinder. The volume of the water was then used in calculating the water content in the sample (using the density of water of 1 g/cm3).
Volatile hydrocarbon content
To determine the amount of light hydrocarbons inside the oily sludge, a sample of known mass was put in an oven (with ventilation) at 105°C for 24 h. The reduction in mass indicated the moisture and light hydrocarbon content in the sludge. As water content was measured previously, the light hydrocarbon content (in wt. %) was calculated as follows:
reduced mass, g
Light hydrocarbon = 100%
[image:2.595.106.490.191.366.2]mass of tested sample, g
Figure 1. A simplified solvent extraction process diagram
[image:2.595.89.507.416.492.2]Solid content
Dried samples (105 °C) were placed in a furnace at 550 °C for 120 min. The residue showed the solid content of the sludge as weight percent:
mass of residue remaning after burnin, g
Solid content = 100%
mass of tested sample, g
Nonvolatile hydrocarbon content
After measuring the water content, light hydrocarbon content, and solids content, the nonvolatile hydrocarbon content can be calculated in weight percent as follows:
Nonvolatile hydrocarbon = 100% - (light hydrocarbon in wt% + solid in wt% + water content in wt%)
NVH = 100% - VH + SC + WC
Ash Content
The American Society for Testing and Materials (ASTM) standard method D 482 was used for measuring the Ash content of the oily sludge.
The ash content is calculated as the following
Ash, mass % = (w/W) × 100 Where;
[image:3.595.163.424.160.347.2]w = mass of ash, g, and W = mass of sample, g.
Figure 2. Block diagram of the solvent extraction process with solvent recovery
[image:3.595.177.423.381.553.2]Figure 3. Flowchart of fractionation of a crude oil
Table 2. Characterization of the studied sludge sample
Sample Water content
(wt%)
Volatile hydrocarbons (at 105 oC, wt%)
Volatile hydrocarbons (at 105 oC, wt%)
Solid content (at 600oC, wt%)
Ash content Carbon
residue
TK-C1 9.7 21.17 30.69 38.44 1.2 2.1
[image:3.595.83.519.607.650.2]Carbon Residue
The American Society for Testing and Materials (ASTM) standard method D189 was used for measuring the carbon residue of the oily sludge. The residue remaining is calculated as a percentage of the original sample, and reported as Conradson carbon residue.
Carbone residue of the tested sample is calculated as the following:
(A 100) Carbon residue, % =
W
Where:
[image:4.595.39.285.285.364.2]A = carbon residue, g, and W = sample used, g.
Table 3. Hydrocarbons recovery from sludge TK-C1 at various volumes of the studied solvents (time 45 min., T = 70 oC)
Solvent Xylene Toluene Kerosene Cut Naphtha Cut
Sludge/solvent
1 : 2 38 34 38.7 43.3
1 : 4 44.7 40.0 46.3 50.3
1 : 6 46.0 41.7 67.3 79.8
1 : 8 53.7 44.4 73.3 86.8
1 : 9 53.7 50.3 73.3 86.6
1 : 10 -- 50.3 -- --
Table 4. Hydrocarbons recovered from solid sludge TK-C5 at various volumes of the studied solvents (time 75 min., T = 70 oC)
Solvent Sludge/solvent
Xylene Toluene Kerosene Cut Naphtha Cut
1 : 2 39.3 36.7 38.0 41.3
1 : 4 41.3 39.3 55.0 62.5
1 : 6 44.0 42.7 62.8 82.5
1 : 8 50.3 44.6 62.8 82.5
1 : 9 50.3 44.6 -- --
Solvent Extraction
The solvent extraction process is illustrated in Figure 2. Samples of 15 g of sludge was added to specified amounts of
solvent. Different mass ratios of solvent-to-sludge were used, varying from 1:1 to 10:1. The sludge–solvent mixture was stirred at room temperature, 25–27 oC, using a magnetic stirrer with constant speed for 45 min. During this process, the container was covered with parafilm to prevent solvent loss. After the mixing step, the sludge-solvent mixture was centrifuged then gravity-filtered using filter paper (Whatman, medium-fast). The semi-solid material was then dried in a furnace at 70◦C for 24h to remove any solvent, and then weighed. The filtrate was distilled using a batch simple distillation apparatus. Solvent was recovered as distillate until the flow of distillate dramatically decreased.
Characterization of Recovered Oil
Saturate, Aromatic, Resin and Asphaltene (SARA) analysis
A SARA separation system was developed to characterize crude oils of interest. The asphaltene fraction was precipitated from the corresponding crude oil using n-heptane. To obtain the asphaltene, a slightly modified SARA fractionation procedure was used Figure3. A total of 30 ml of n-heptane/oil was added. The precipitated portion was filtered and dried under inert gas flow. The sample (with the filter) was extracted with 300 ml of n-heptane until no color changes were observed. The re-dissolved asphaltene fraction was rotary-evaporated and afterward, dried under a continuous stream of nitrogen. The extracted solution (maltenes fraction) was rotovapped until a stable mass was achieved. The dried maltenes were then diluted with n-heptane and mixed with activated alumina (80−200 mesh, Merck, Germany). The slurry was dried and loaded on the top of a glass column, packed with neutral alumina sorbent. In sequence, n-heptane, toluene, and toluene/ methanol (9:1, v/v) mixtures were used to elute saturates, aromatics, and resins. A total of 350 ml of solvent/g of maltenes was used for the chromatographic separation.
[image:4.595.82.503.427.678.2]Finally, the fractions were rotary-evaporated to dryness and then weighed. To have a correct mass balance, the volatile part of the original sample was also determined using rotavap vapor at 26 mbar and 30°C. The obtained mass balance and recovery
is presented in Table 1. The reported SARA-values of the low-yield samples in this study are corrected to 100 % by adjusting the saturate and aromatic values. Hence, the evaporation loss from the resin fraction is considered to be negligible.
Determination of hydrocarbon fractions concentration by gas chromatography
Recovered hydrocarbon samples were analyzed using Hewlett Packard gas chromatograph of model 5890 series Π equipped with flame ionization detector (FID), using HP-1 fused silica capillary column packed with 100% dimethyl polysiloxane as stationary phase, 100 m in length, 0.53 mm int. diameter, and thickness film 0.5 μm. Nitrogen (Oxygen-free) was used as mobile phase, all gas flow rates were set to manufacturer specifications, performing conditioning and standardization of the system.
The flow rate was measured from the end of the column with a soap bubble flow rate. Methane as an unretained marker was used to correct the dead volume in the column. Injections were made in split mode with a split ratio of 1:15. Glass linear is packed with deactivated glass wool which changed after six injections .The column oven was programmed from 50 °C (hold 1 min) to 350 °C at a rate 5 °C/min with 190 min hold at 350 °C. The injector temperature is set at 300 °C and the detector temperature is 320 °C. The data was estimated by integration of the area under the resolved chromatographic
profile, using total Chrom, Ver. 6.2.1 software, via interface NCI 900, manual injection of 1 μL of samples after washing syringe with sample’s solvent and injected 1 μL of solvent.
Density
The density (ρ) of extracted oil was estimated by dividing a known mass of the oil to its volume. Briefly, 10 ml of the recovered oil was measured and weighed (Mettler AE 260, Mettler-Toledo, Switzerland). The density of the oil was derived from the following equation:
= mass/volume
Specific gravity
Specific gravity (SGtrue) is the ratio of the density of a liquid to the density of water (g/l).
The specific gravity of the claimed oil was measured according to ASTM D1298 and can be expressed mathematically from the following equation:
true 2
SG
= (n sample)/(n H O)
API gravity
[image:5.595.75.530.261.492.2]API gravity was calculated using the specific gravity of the oil extract, a unit-less property and determined at 60°F. API Figure 4. Oil recovery as a percentage of the original sludge mass vs. solvent-to-sludge mass
ratio for used solvents for semi-solid sludge TK-C5
Table 5. Hydrocarbons recovery from solid sludge TK-C-1 at various temperatures (time = 45 min, sludge/solvent = 1/8)
Solvent Xylene Toluene Kerosene Cut Naphtha Cut
Temperature
27 42.7 40.9 52.3 58.7
50 49.5 46.7 57.7 63.0
[image:5.595.181.417.572.625.2]gravity was calculated according to using the following equation:
[image:6.595.38.286.142.194.2]API gravity = (141.5/Specific Gravity) - 131.5
Table 6. Hydrocarbons recovery from semi-solid sludge TK-C-5 at various temperatures (time = 45 min, sludge/solvent = 1/8)
Solvent Xylene Toluene Kerosene Cut Naphtha Cut
Temperature
27 41.3 39.3 50.6 56.7
50 43.5 43.4 55.2 65.9
70 50.3 44.6 62.8 82.5
Viscosity
Viscosity (υ) was measured using a Cannon-Fenske (Fisher Scientific, Pittsburgh, PA) glass capillary kinematic viscometer in a constant temperature bath in accordance with ASTM D445. Kinematic viscosity is determined by measuring the time (t) for a known volume of liquid flowing under gravity to pass through a calibrated glass capillary viscometer tube. The manufacturer of the Cannon- Fenske type viscometer tubes supplied calibration constants (c) at a range of temperature 40°F and 100°F.
Kinematic viscosity (υ) in centistoke (cSt) was calculated from the following equation.
= c t
Salt content
The salinity of the extracted oil was determined using the electrometric method according to ASTM D3230 procedures using a Pro 2030 multimeter (YSI Incorporation, Yellow Springs. OH 45387. USA). In this method, the sample was dissolved in a mixed solvent and placed in a test cell consisting of a beaker and two parallel stainless steel plates. An alternating voltage was passed through the plates, and the salt
content was obtained by reference to a calibration curve of the relationship of salt content of known mixtures to the current.
RESULTS AND DISCUSSION
Characterization of Studied Oily Sludge
Several key properties of the sludge were analyzed and indicated in Table 2. The water content of the sludge was 3.2 and 9.7, the volatile hydrocarbons was 8.99 and 21.17, non-volatile hydrocarbons was 55.07 and 30.69, the solid content was 31.74 and 38.44, the Ash content was 1.2% and 1.01%, and the Carbon Residue was 2.1% and 1.8% for TK C1 and TK C5 respectively.
Factors affecting the recovery of hydrocarbons
Solvent - sludge ratio
Different types and volumes of the studied solvents in the extraction process from solid sludge and semisolid sludge were selected and given in Tables 3 and 4. The addition occurs as batches of each 5 min with the minimum ratio 1:2 (sludge (gram): solvent (ml). In order to study the preferred and ideal solvent sludge ratio, we would measure the recovery of hydrocarbons from sludge using various volumes of the studied solvents (different sludge-solvent ratio) as given in Tables 3 and 4.
Various volumes of the studied solvents were used at constant temperature of 70°C and constant shaking time of 45 min until the recovery was fixed. It has been found that xylene is the best single solvent used for extracting hydrocarbons from sludge giving recovery of 53.7% using a volume of 8 ml but it is difficult to remove it from the recovered oil. But the petroleum fractions naphtha and kerosene cuts are preferred for the process of hydrocarbon recovery reaching 86.8% using volume 8 ml only from these cuts. Oil recovery is shown in
Figures 3 and 4 for all solvent-to-sludge ratios. As is evident in the figure, more oil is recovered when the petroleum fractions Naphtha cut is used as the solvent than when Kerosene cut is used.
Although more oil is recovered when the single solvent Xylene is used as solvent than when Toluene is used.For all solvents, the amount of recovered oil increases with increasing solvent-to-sludge mass ratio, up to a ratio of eight for the petroleum
fractions Naphtha and kerosene cuts and then levels off for ratios of nine and up to a ratio of nine for Xylene and Toluene and then levels off for ratios of ten in the case of semi-solid sludge TK-C1.
The amount of recovered oil increases with increasing solvent-to-sludge mass ratio, up to a ratio of six for Naphtha and Kerosene cuts and then levels off for ratios of eight and up to a ratioof eight for Xylene and Toluene and then levels off for
[image:7.595.128.478.368.678.2]Figure 6. Hydrocarbons recovery from solid sludge TK-C5 at various temperatures (time = 45 min, sludge/solvent = 1/8)
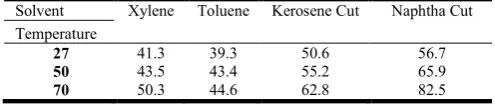
Table 7. Hydrocarbons recovery from semi-solid sludge TK-C1 at various times (T = 70 oC, sludge/solvent = 1/8)
Solvent Temperature
Xylene Toluene Kerosene Cut Naphtha Cut
15 46.13 39.5 49.3 56.7
30 52.0 41.3 55.3 63.3
45 53.7 44.4 73.3 86.8
60 53.7 - 73.3 86.8
ratios of nine in the case of solid sludge TK-C5. For solvent-to-sludge mass ratios greater than eight for Naphtha and Kerosene cuts and nine for Xylene and Toluene in the case of semi-solid sludge TK-C1, the amount of recovered oil does not increase with increasing solvent. Although for solvent-to-sludge ratio greater than six for Naphtha and kerosene cuts and eight for Xylene and Toluene in the case of solid sludge TK-C5 the amount of recovered oil does not increase with increasing solvent. This is likely due all extractable hydrocarbon may have been removed.
Temperature
The temperature was studied at the ideal sludge-solvent ratio and at shaking time 45 min. This study carried out for both semi-solid sludge TK-C-1 and solid sludge TKC-5 at three different temperatures, room temperature 27, 50 and 70°C the effect of temperature on the oil recovery from semi-solid sludge was given in Table 5 and from solid sludge was given at Table 6. Generally, as shown in Figures 5 and 6 the oil recovery increases as a function of temperature till reached to the maximum value then, there is no increase in recovery with
any increase of temperature. The temperature 70°C is preferred for all individual solvents and petroleum cuts using solid and semi-solid sludge giving the maximum oil recovery for each solvent.
Shaking time
The effect of shaking time (period of shaking) was studied at ideal sludge-solvent ratio and at temperature 70°C that obtained from the previous study.
[image:8.595.117.491.207.516.2]The effect of shaking time on the oil recovery was given in Tables 7 and 8 from semi solid sludge and solid sludge respectively. The shaking time was affected by the physical properties of sludge samples, generally, the oil recovery increases as the shaking time increase as shown in Figures 7 and 8 for semi-solid sludge TK-C1 and solid sludge TK-C5 respectively. For solid sludge sample, the recovered oil was completed at shaking time 75 min. and for semi-solid sludge sample; the recovered oil was completed at shaking time 45 min. Using the petroleum fractions naphtha and kerosene cuts
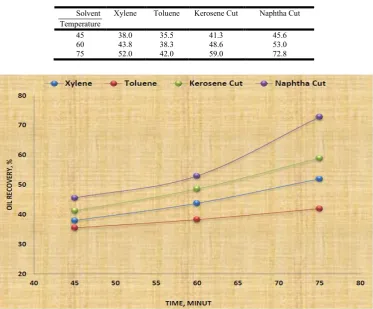
Table 8. Hydrocarbons recovery from solid sludge TK-C5 at various times (T = 70 oC, sludge/solvent = 1/8)
Solvent Temperature
Xylene Toluene Kerosene Cut Naphtha Cut
45 38.0 35.5 41.3 45.6
60 43.8 38.3 48.6 53.0
75 52.0 42.0 59.0 72.8
[image:8.595.124.481.567.627.2]Figure 8. Hydrocarbons recovery from semi-solid sludge TK-C1 at various times (T = 70 oC, sludge/solvent = 1/8)
Table 9. Results of mass fraction of oil in each solvent for TK-C1
Solvent volumes
Mass of recovered oil (R), g Mass fraction of oil in solvent (y-oil)
Xylene Toluene Kerosene Naphtha Xylene Toluene Kerosene Naphtha
30 5.7 5.1 5.80 6.49 0.159 0.145 0.162 0.177
60 6.7 6.0 6.94 7.54 0.1 0.09 0.103 0.111
90 6.9 6.25 10.09 11.97 0.07 0.064 0.10 0.11
at the optimum conditions of extraction, sludge-solvent 1 - 8 ratio, temperature 70°C and shaking time 75 min for solid sludge sample and 45 min for semi solid sludge, we can obtain maximum oil recovery.
Mass Fraction of Oil components in the Solvent Phase
The mass fraction of fuel oil in the solvent phase, yoil, is estimated from the following equation.
solv oil oil solv
+
oil solvent
m y
m m
=
The variable msolvoil denotes the mass of the fuel oil components in the solvent phase, and the variable msolventdenotes the mass of the solvent. This equation can be simplified by relating the
[image:9.595.149.457.66.347.2]Figure 9. Mass fraction of fuel oil components in the solvent phase vs. solvent-to-sludge mass ratio for used solvents for semi-solid sludge TK-C1
Table 10. Results of mass fraction of oil in each solvent for TK-C5
Solvent volumes
Mass of recovered oil (R), g Mass fraction of oil in solvent (y-oil)
Xylene Toluene Kerosene Naphtha Xylene Toluene Kerosene Naphtha
30 5.89 5.505 5.7 6.195 0.164 0.155 0.159 0.171
60 6.19 5.89 8.25 9.375 0.093 0.089 0.120 0.135
90 6.6 6.405 9.42 12.37 0.068 0.066 0.094 0.120
120 8.89 6.69 9.42 12.37 0.069 0.052 0.072 0.093
[image:9.595.120.483.398.674.2]mass of the solvent to the solvent-to-sludge ratio, S, and the original sludge mass, msludge,0. The mass of the fuel oil components in the solvent phase can also be related to msludge,0 by the oil recovery, R, expressed as a fraction.
oil
+ S
sludge,0
sludge,0 sludge,0
R m R
y
R m m R + S
=
=
Tables 9 and 10 show the results calculated for each solvent for both semi-solid sludge TK-C1 and solid sludge TK-C5 respectively. For illustration, the mass fraction of fuel oil in the solvent phase is shown in Figures 9 and 10 for semi-solid sludge TK-C1 and solid sludge TK-C5 respectively. As can be expected, the concentration of oil in the solvent phase decreases as more solvent is used.
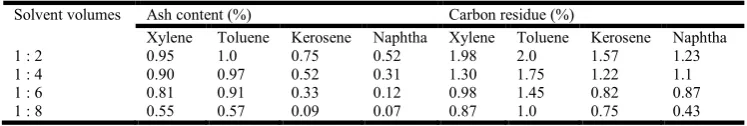
Quality of the Recovered Oil
[image:10.595.310.558.93.202.2]In addition to the amount of recovered oil, the quality of the oil is a major concern. The recovered oil was analyzed for levels of ash content and carbon residue. These results are provided in Tables 11 and 12 for solvent-to-sludge mass ratios of two to eight. The ash contents for oils recovered by either solvent ranged from 0.07% to 0.95%, and 0.03 to 0.85 which is lower than the ash content of the original sludge, 1.2% and 1.01 for semi-solid sludge TK-C1 and solid sludge TKC5 respectively. Also, the levels of ash decrease with the amount of solvent that is used. This indicates that a greater proportion of metal-containing hydrocarbons, usually high-molecular-weight hydrocarbons, are extracted when less solvent is used.
Table 14. Properties of recovered oil from 1:8 Naphtha cut extraction from TK-C5 compared to a commercial heavy fuel oil,
all percentages are by mass %, otherwise specified
property Recovered oil, 1:8
Naphtha cut
Commercial fuel oil from waste lube oil
Specific gravity @15oC 0.7604 0.912
Density 0.970 1.2
Carbon residue 0.93% 3.45%
Ash content 0.13% 3.37%
Asphaltene content 1.92% 2.875%
Water content (Vol. %) Nil 0.3%
Sulfur content 0.260% 1.2%
Salt content (mg/kg) 4.9 7
Viscosity, cst @ 40oC 120.9 126.9
A similar pattern can be observed for both carbon residue and asphaltene content; both decrease with increasing solvent-to-sludge ratios, indicating that more high-molecular-weight
[image:10.595.36.235.114.150.2]hydrocarbons are extracted by using lower amounts of solvent. A possible explanation for this behavior is that the heavier hydrocarbons have a much greater affinity for the oil components than for the solvent. Concentrations of oil in the solvent phase are highest when small amounts of solvent are used, as is illustrated in Figures 13 and 14. This could lead to more of the heavier hydrocarbons being extracted at the lower solvent-to-sludge ratios. To consider this possibility, asphaltene is evaluated further, as a representative of high-molecular-weight hydrocarbons. Additional physical properties of the recovered oil from one extraction are shown in Table 13 and 14 for semi-solid sludge TK-C1 and solid sludge TK-C5 respectively. Based upon the maximum oil recovery and the minimum ash, carbon residue, and asphaltene contents, the
Table 11. Ash content and carbon residue for recovered oil of TK-C1
Solvent volumes Ash content (%) Carbon residue (%)
Xylene Toluene Kerosene Naphtha Xylene Toluene Kerosene Naphtha
1 : 2 0.95 1.0 0.75 0.52 1.98 2.0 1.57 1.23
1 : 4 0.90 0.97 0.52 0.31 1.30 1.75 1.22 1.1
1 : 6 0.81 0.91 0.33 0.12 0.98 1.45 0.82 0.87
1 : 8 0.55 0.57 0.09 0.07 0.87 1.0 0.75 0.43
Table 12. Ash content and carbon residue for recovered oil of TK-C5
Solvent volumes Ash content (%) Carbon residue (%)
Xylene Toluene Kerosene Naphtha Xylene Toluene Kerosene Naphtha
1 : 2 0.85 0.88 0.55 0.48 1.1 1.5 0.97 0.85
1 : 4 0.78 0.81 0.32 0.27 0.97 1.0 0.86 0.68
1 : 6 0.60 0.62 0.21 0.95 0.78 0.93 0.70 0.47
1 : 8 0.42 0.38 0.05 0.03 0.57 0.87 0.46 0.21
Table 13. Properties of recovered oil from 1:8 Naphtha cut extraction from TK-C1 compared to a commercial heavy fuel oil, all percentages are by mass %, otherwise specified
property Recovered oil, 1:8 Naphtha cut Commercial fuel oil from waste lube oil
Specific gravity @15oC 0.8806 0.912
Density 0.8797 1.2
Carbon residue 0.43% 3.45%
Ash content 0.07% 3.37%
Asphaltene content 1.5% 2.875%
Water content (Vol. %) Nil 0.3%
Sulfur content 0.212% 1.2%
Salt content (mg/kg) 3.3 7
[image:10.595.112.486.273.336.2] [image:10.595.123.479.482.579.2]recovered oil from Naphtha cut at a ratio of 8 was chosen for these additional analyses.
Table 15. Analysis for metal content form TK-C1 and TK-C5.
Metal Concentration, %
TK-C1 TK-C5
Iron (Fe) 40.86 43.5
Cupper (Cu) 0.069 0.062
Nickel (Ni) 0.111 0.101
Manganese (Mn) 0.254 0.248
Sodium (Na) 1.54 1.67
Magnesium (Mg) 3.85 5.42
Phosphorous (P) 0.029 0.055
Zinc (Zn) 0.163 0.145
Aluminum (Al) 0.848 1.35
Barium (Ba) 0.083 0.067
Silicon (Si) 5.43 9.713
Chromium (Cr) 0.088 0.099
Titanium (Ti) 0.243 0.312
Iron (Fe) 40.86 43.5
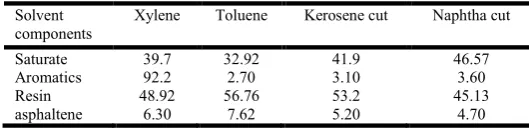
Table 16. SARA fractions of crude oil samples analyzed with traditional open column chromatography-gravimetry for TK-C1
Solvent components
Xylene Toluene Kerosene cut Naphtha cut
Saturate 41.2 36.6 45.9 50.7
Aromatics 3.52 3.1 3.7 4.5
Resin 50.27 54.1 45.6 41.3
[image:11.595.48.517.308.581.2]asphaltene 5.01 6.2 4.8 3.5
Table 17. SARA fractions of crude oil samples analyzed with traditional open column
chromatography-gravimetry for TK-C5
Solvent components
Xylene Toluene Kerosene cut Naphtha cut
Saturate 39.7 32.92 41.9 46.57
Aromatics 92.2 2.70 3.10 3.60
Resin 48.92 56.76 53.2 45.13
asphaltene 6.30 7.62 5.20 4.70
The recovered oil compares favorably with commercially available recovered fuel oil. The extracted oil contains less high-molecular-weight hydrocarbons, represented as ash,
carbon residue, and asphaltene than either of the other recovered oils. It also contained less water, sodium, and sulfur content than for the other oil recovered. Water content analysis indicated that the extracted oil was free of water. The presence of water lowers the heating value of the oil [56]; in addition, it generates steam and builds pressure in the refining processes [57]. The density of the oil was measured and found to be 0.8797 and 0.970 for TK-C1 and TK-C5 respectively which was higher than the density of the parent oil. Depending on the SG of the extracted oil, the mathematical calculation results show the API density to be 29.19.
The API density is one of the main parameters used to grade the crude oil. Martínez-Palou et al. [58] indicated that oil with API<10 is classified as extra heavy while API<22.3 is heavy, API 22.3 to 31.1 is medium and API>31.1 is light. The lighter the oil is the higher content of light hydrocarbon compounds, and the less wax and asphaltenes are present. Viscosity is the resistance to flow and a measure of the internal molecular fraction of the fluid and is an important parameter affecting the pumping of oil and atomization of fuel [59].
The kinematic viscosity of the extracted oil was measured at 40oC and compared to that of commercial fuel oil from waste lube oil. The viscosity was 118.5 and 120.9 for TK-C1 and TK-C5 respectively while the viscosity of the commercial fuel oil from waste lube oil was higher 126.9 cSt. Lower LHF content in the oil increases the density and viscosity of the oil.
Consequently more power is needed for pumping [59]. In addition to magnesium chloride (MgCl2), salts in crude oils consist of up to 75% sodium chloride (NaCl) [60]; typically the salinity of oil is measured as NaCl content. The salinity of the recovered oil was 3.30 mgl-1. This value was slightly higher than the salt content of Brega oil (3.2 mgl-1). Results of the analysis for metal content are shown in Table 15. Iron, Silicon, and Magnesium were found in relatively highconcentrations and could be problematic. Further treatment for these metals is necessary before the recovered oil could be used as a fuel.
[image:11.595.28.293.662.726.2]Saturate, Aromatic, Resin and Asphaltene (SARA) Analysis
The crude oil samples were fractionated by the traditional SARA technique as described by in the experimental chapter.
[image:12.595.118.479.52.246.2]The experiment was repeated several times and the average results, reported as wt. % are presented in Table 16 and 17 and Figures 11 and 12 for TK-C1 and TK-C5 respectively. In general, the mass ratios of asphaltenes to resins in crude oils around the world have been found to be quite small, in the range of 0–0.26.
[image:12.595.211.381.303.364.2]Figure 12. Distribution of Saturate, Aromatic, Resin and Asphaltene with different solvents from semi solid sludge for TK-C5
Table 18. Asphaltene-to-Resin ratio of each solvent for TK-C1 and TK-C5
Solvent Asphaltene-to-Resin Ratio
TK-C1 TK-C5
Xylene 0.099 0.130
Toluene 0.11 0.134
Kerosene cut 0.10 0.01
[image:12.595.116.483.410.666.2]Naphtha cut 0.08 0.04
Figure 16. Gas Chromatogram of the analyzed saturate sample from TK-C1 using Naphtha Cut 1:8 Sludge/solvent ratio
Table 20. Recovery % of n-C17, n-C18, pristane, phytane, nC17/pristane and nC18/phytane with different solvents from semi-solid sludge TK-C1
Solvent
Carbon group type
Xylene Toluene Kerosene cut Naphtha cut
n-C17 0.875 0.502 3.82 4.360
n-C18 0.815 0.53 3.51 4.208
Pristane 0.43 0.25 1.56 2.190
Phytane 0.57 0.35 1.94 1.679
Pristane/Phytane 0.75 0.71 0.804 1.30
n-C17/Pristane 2.034 2.01 2.44 1.99
n-C18/Phytane 1.43 1.51 1.81 2.50
For the recovered oils under study here the average ratio were found as in the Table 18. From Tables 16, 17 and 18 and Figures 13 and 14, Naphtha and kerosene cuts exhibit highest hydrocarbon recovery from solid and semi-solid sludge than the other used solvents, reflecting their powerful extraction.
Gas Chromatography
Gas chromatographic (GC) analysis of the extracted saturate oil from a semi-solid sludge TK-C1 using 1:8 sludge-to-solvent ratio showed the presence of a range of hydrocarbon fractions composed of 136 different compounds ranging from C13-C51 (Table 19 and Figures 13 and 14). The gas chromatogram of the saturated hydrocarbon fractions shows a shift in the normal alkane distribution to lower carbon numbers (Figure 13), reflecting relatively a moderate level of thermal maturity.
Non-biomarker maturity parameters
This study explains how certain non-biomarker parameters, such as ratios involving n-alkanes hydrocarbons, are used to assess thermal maturity. Various characteristics of petroleum samples ca6n be used to assess their relative level of thermal maturity.
The Pristane/Phytane ratio evolved as an indicator of the oxicity of the initial organic matter’s depositional environment. The Pristane/Phytane ratios are very helpful indetermining the pale depositional environment and source of the precursor organic matters of the reservoired oil. It is well known that Pristane/Phytane ratios >3.0 indicates predominantly non marine source from terrestrial organic matter, (terrigenous plant input) deposited underoxic to suboxic conditions (Hunt, 1996; Liu, 2009; Mater, 2006 and Lijmbach, 1975). An oil accumulation have Pristane/Phytane ratio < 0.8 indicates saline to hyper saline conditions associated with evaporate and carbonate deposition, while marine organic matters usually have Pristane/Phytane <1.5 (Peters, 2005). Also, the ratios nC17/pristane and nC18/phytane from both solid and semi-solid sludge in Tables 20 and 21 and Figures 15 and 16reflect the recovery of the normal paraffin’s and their corresponding isoprenoids.
Conclusion
[image:14.595.119.480.95.435.2] The petroleum fractions Naphtha and Kerosene are the efficient solvents increasing the total recovery of hydrocarbon residue from oily sludge. This method is a stable, simpler, higher performing and significantly more
Table 21. Recovery % of n-C17, n-C18, pristane, phytane, nC17/pristane and nC18/phytane with different solvents from solid sludge TK-C5
Solvent
Carbon group type
Xylene Toluene Kerosene cut Naphtha cut
n-C17 0.64 0.41 2.11 2.45
n-C18 0.58 0.38 1.89 2.21
Pristane 0.38 0.20 1.20 1.80
Phytane 0.41 0.28 0.55 0.875
Pristane/Phytane 0.93 0.714 2.18 2.05
n-C17/Pristane 1.70 2.05 1.75 1.36
n-C18/Phytane 1.41 1.36 3.43 2.53
economical process than the other solvent extraction technologies.
Recycling of maximum hydrocarbon residue from a waste-stream product to a usable refinery product was achieved using the optimum conditions: sludge-naphtha or kerosene ratio 1 - 8, temperature 70 °C and shaking time 75 min for solid sludge sample and 45 min for semi solid sludge.
The selected petroleum fractions as solvent extraction change the management of petroleum wastes and reuse of separated components and solve the waste disposal problems created by land ban. Also, they decrease the overall cost and time involved for recovery and disposal of hydrocarbon residue.
REFERENCE
Al-Futaisi, A. Jamrah, B. Yaghi, R. Taha, 2007. Assessment of alternative management techniques of tank bottom petroleum sludge in Oman, J. Hazard. Mater.141 557–564. Al-Futaisi, A. Jamrah, B. Yaghi, R. Taha, 2007. Assessment of alternative management techniques of tank bottom petroleum sludge in Oman, J. Hazard. Mater.141. 557–564. American standard for testing and materials (ASTM – D1266-98) 2001. Standard Test Method for Sulfur in Petroleum Products (Lamb method).
American standard for testing and materials (ASTM – D1298 – 12b). Standard Test Method for Density, Relative Density, or API Gravity of Crude Petroleum and Liquid Petroleum Products by Hydrometer Method
American standard for testing and materials (ASTM – D-3230-IP265). Standard Test Method for Salts in Petroleum Products.
American standard for testing and materials (ASTM – D445) 2001, standard test method for viscosity of petroleum crude oil.
American Standard for Testing and Materials (ASTM–D189-05) 2001, Standard Test Method for Conradson Carbon Residue of Petroleum Products.
American Standard for Testing and Materials (ASTM–D482-03) 2001. Standard Test Method for Ash from Petroleum Products.
American Standard for Testing and Materials (ASTM-D95-05) 2001. Standard Test Method for Water in Petroleum Products and Bituminous Material by Distillation.
Ramaswamy, D. Kar, D.D. De, S. 2007. A study on recovery of oil from sludge containing oil using froth flotation, J. Environ. Manage. 85, 150–154.
Zubaidy, E.A.H., Abouelnasr, D.M. 2010. Fuel recovery from waste oily sludge using solvent extraction, Process. Saf. Environ. 88 318–326.
Hunt, J. 1996. Petroleum geochemistry and geology, 2nd ed., Freeman and Company, New York, 743.
Liu, J., Jiang, X., Zhou, L., Han, X., Cui, Z. 2009. Pyrolysis treatment of oil sludge and model-free kinetics analysis, J. Hazard. Mater. 161, 1208–1215.
Mater, L., Sperb, R.M., Madureira, L., Rosin, A., Correa, A., Radetski, C.M., 2006. Proposal of a sequential treatment methodology for the safe reuse of oil sludge-contaminated soil, J. Hazard. Mater. B 136, 967–971.
Lijmbach, G. 1975. On the origin of petroleum: proceedings of the 9th world petroleum congress, applied science publishers, London, Vol. 2, 357-369.
Elektorowicz, M., Habibi, S. 2005. Sustaibable waste management: recovery of fuels from petroleum sludge, Can. J. Civil. Eng. 32, 164–169.
Ayotamuno, M.J. Okparanma, R.N. Nweneka, E.K. Ogaji, S.O.T. Probert, S.D. 2007. Bio-remediation of a sludge containing hydrocarbons, Appl. Energ. 84 936–943. Xu, N. Wang, W. Han, P. Lu, X. 2009. Effects of ultrasound
on oily sludge deoiling, J. Hazard. Mater. 171, 914–917. Peters, K., Walters, C. and Moldowan, J. 2005. The Biomarker
Guide: Biomarkers and isotopes in petroleum systems and Earth history Vol. 2, 2nd edition, Cambridge University press, New York.
da Silva, V.L., Alves, F.C., de Franc¸ F.P., 2012. a, A review of the technological solutions for the treatment of oily sludges from petroleum refineries, Waste Manage. Res. 30 1016–1030.
Wang, X. Wang, Q.H. Wang, S.J. Li, F.S. Guo, G.L. 2012. Effect of biostimulation on community level physiological profiles of microorganisms in field-scale biopiles composed of aged oil sludge, Bioresour. Technol. 111, 308–315.