RESEARCH ARTICLE
CHANGE DETECTION IN RICE AREA USING REMOTE SENSING DATA
*Mehmet SENER
Department of Biosystem Engineering, Agricultural Faculty, Namık Kemal University, 59030, Turkey
ARTICLE INFO ABSTRACT
Information on land use/land cover in the form of maps and statistical data is very vital for spatial planning, management and utilization of land. Satellite images are using in the investigation of changes in land use and land cover as extremely useful tools. The objective of this study was to obtain changing in land use/cover, especially the rice production area is nearly 40% of the production takes place in turkey is located along the Meric river in Edirne province of Thrace region in Turkey. Landsat TM of 2001, 2006 and 2011 were acquired by USGS Earth Resources Observation and Science Center Site. Rapideye image of 2011 was obtained from Local distributor in order to control classification accuracy of low resolution Landsat image. For this purpose, a supervised classification methodology has been employed using maximum likelihood technique in Erdas 9.3 software. Study area were categorized into six different classes namely, Rice, Forest, Water, Agriculture, Pasture and Roads. The results were validated using ground truth data and long term data of Turkish Statistical Institute (TSI). The results indicate that especially between 2001 and 2006 Rice areas have been great increased as 41% from 25909 ha to 43839.33 ha and decreased to 41021.18 ha in 2011. In addition, as a result of comparison of high resolution Rapideye and low resolution Landsat image, highly good relationship was found in detection of Rice areas. The results show that the Landsat images could potentially be applied at large spatial scales to monitoring of rice on a timely and accurately.
Copyright©2016, Mehmet SENER. This is an open access article distributed under the Creative Commons Attribution License, which permits unrestricted use,
distribution, and reproduction in any medium, provided the original work is properly cited.
INTRODUCTION
Especially tropical zones, rice is a crop at the top level based on worldwide food consumption. Also in our country, rice consumption has been increasing. The rice consumption has been met by importation because of insufficient output in our country. Right agricultural policies could be ensured by support of right, rapid and economic acquiring information methods. It is necessary to detect amounts of production and planting areas for crop production during our participation process in the European Union (Eraktan 2002). For this reason, consumption demand of agricultural products and our current production amounts are should be put forward. The crop pattern in the agricultural areas can be determined by many personnel and long working period by the reason of dynamic structure in agricultural production and their activities are performed in wide areas. This situation causes both to be achieved data with very large costs and obtained inaccurate
*Corresponding author: Mehmet SENER
Department of Biosystem Engineering, Agricultural Faculty, Namık
Kemal University, 59030, Turkey.
results based on the information are getting from declaration of farmers. Marketing prices could be determined realistically through the amount of production are detected properly and this case will provide that preventing price fluctuations when farmers sell their products and leading fulfillment of social expectations. Remote Sensing (RS) can be simply defined as the science which identifies characteristics of objects can without direct contact (Kansu 2006). The measured quantity of remote sensing system is electromagnetic energy spreading from related object. The observations and measurements which are made by devices carried through satellites or air vehicles are utilized from electromagnetic energy (Kavzoglu 2002). Plants are grown on land can be detected by using of different classification techniques. Generally, classification process is divided into two groups and these are supervised and unsupervised classification. Unsupervised classification applies in the case of inadequate information in study area. Supervised classification can be applied where there are detailed spatial information in study area. In the classification process there are several stages, these are selection and providing of the image to be used in the classification, implementation of pre-processing the image, image enhancement, obtaining supporting data by field studies and geodetic information, determination of the sampling areas,
ISSN: 0975-833X
International Journal of Current Research Vol. 8, Issue, 08, pp.36675-36679, August, 2016
OF CURRENT RESEARCH
Article History: Received 09thMay, 2016 Received in revised form 20thJune, 2016 Accepted 11thJuly, 2016 Published online 31stAugust, 2016
Key words: Rapideye, Landsat, Rice, Classification, Land use, Land cover.
Citation: Mehmet SENER, 2016.“Change detection in rice area using remote sensing data”,International Journal of Current Research, 8, (08),
36675-36679.
RESEARCH ARTICLE
CHANGE DETECTION IN RICE AREA USING REMOTE SENSING DATA
*Mehmet SENER
Department of Biosystem Engineering, Agricultural Faculty, Namık Kemal University, 59030, Turkey
ARTICLE INFO ABSTRACT
Information on land use/land cover in the form of maps and statistical data is very vital for spatial planning, management and utilization of land. Satellite images are using in the investigation of changes in land use and land cover as extremely useful tools. The objective of this study was to obtain changing in land use/cover, especially the rice production area is nearly 40% of the production takes place in turkey is located along the Meric river in Edirne province of Thrace region in Turkey. Landsat TM of 2001, 2006 and 2011 were acquired by USGS Earth Resources Observation and Science Center Site. Rapideye image of 2011 was obtained from Local distributor in order to control classification accuracy of low resolution Landsat image. For this purpose, a supervised classification methodology has been employed using maximum likelihood technique in Erdas 9.3 software. Study area were categorized into six different classes namely, Rice, Forest, Water, Agriculture, Pasture and Roads. The results were validated using ground truth data and long term data of Turkish Statistical Institute (TSI). The results indicate that especially between 2001 and 2006 Rice areas have been great increased as 41% from 25909 ha to 43839.33 ha and decreased to 41021.18 ha in 2011. In addition, as a result of comparison of high resolution Rapideye and low resolution Landsat image, highly good relationship was found in detection of Rice areas. The results show that the Landsat images could potentially be applied at large spatial scales to monitoring of rice on a timely and accurately.
Copyright©2016, Mehmet SENER. This is an open access article distributed under the Creative Commons Attribution License, which permits unrestricted use,
distribution, and reproduction in any medium, provided the original work is properly cited.
INTRODUCTION
Especially tropical zones, rice is a crop at the top level based on worldwide food consumption. Also in our country, rice consumption has been increasing. The rice consumption has been met by importation because of insufficient output in our country. Right agricultural policies could be ensured by support of right, rapid and economic acquiring information methods. It is necessary to detect amounts of production and planting areas for crop production during our participation process in the European Union (Eraktan 2002). For this reason, consumption demand of agricultural products and our current production amounts are should be put forward. The crop pattern in the agricultural areas can be determined by many personnel and long working period by the reason of dynamic structure in agricultural production and their activities are performed in wide areas. This situation causes both to be achieved data with very large costs and obtained inaccurate
*Corresponding author: Mehmet SENER
Department of Biosystem Engineering, Agricultural Faculty, Namık
Kemal University, 59030, Turkey.
results based on the information are getting from declaration of farmers. Marketing prices could be determined realistically through the amount of production are detected properly and this case will provide that preventing price fluctuations when farmers sell their products and leading fulfillment of social expectations. Remote Sensing (RS) can be simply defined as the science which identifies characteristics of objects can without direct contact (Kansu 2006). The measured quantity of remote sensing system is electromagnetic energy spreading from related object. The observations and measurements which are made by devices carried through satellites or air vehicles are utilized from electromagnetic energy (Kavzoglu 2002). Plants are grown on land can be detected by using of different classification techniques. Generally, classification process is divided into two groups and these are supervised and unsupervised classification. Unsupervised classification applies in the case of inadequate information in study area. Supervised classification can be applied where there are detailed spatial information in study area. In the classification process there are several stages, these are selection and providing of the image to be used in the classification, implementation of pre-processing the image, image enhancement, obtaining supporting data by field studies and geodetic information, determination of the sampling areas,
ISSN: 0975-833X
International Journal of Current Research Vol. 8, Issue, 08, pp.36675-36679, August, 2016
OF CURRENT RESEARCH
Article History: Received 09thMay, 2016 Received in revised form 20thJune, 2016 Accepted 11thJuly, 2016 Published online 31stAugust, 2016
Key words: Rapideye, Landsat, Rice, Classification, Land use, Land cover.
Citation: Mehmet SENER, 2016.“Change detection in rice area using remote sensing data”,International Journal of Current Research, 8, (08),
selecting suitable algorithm and accuracy analysis (Lillesand and Kiefer, 2000). Maximum likelihood algorithm was used for this study in supervised classification. It is assumed that data histograms band is normally distributed in the rule of maximum likelihood. Maximum likelihood decision rule is based on the probability that a pixel belongs to a certain class (Ayhan et al., 2003). Numerous studies were carried out using Landsat satellite images for determination of land use and land cover until today. Wood and Macomber (2001) conducted a study about determantion of changing forest cover in wide area by Landsat Image.Reis and Yomralioglu (2002) were attempted to determine land cover of Trabzon by Landsat UTM Image. Esetlili and Kurucu (2003) used supervised classification method to determine cotton cultivation area. Frokling et al. (2003) determined Rice cultivation area by using of Landsat Image. Rice (Oryza sativa L.) is one of the most important staple food crops, feeding over half of the world’s population. In 2010, the global Rice production was approximately 672 million tons from a cultivation area of around 154 million ha (Zhao et al., 2015). Rice is a very important plant in Turkey. Turkey contributed to Rice production was approximately in 99.400 ha and 900,000 tons in 2011. 55% of this production is realized from Thrace region. Satellite imagery from optical sensors has been widely utilized to discriminate and map the rice cropping systems (Peng et al., 2010; Sakamoto et al., 2006; Sakamoto et al., 2009; Xiao et
al., 2002a, b; Xiao et al., 2002). In this study, Rice fields tried
to determine in Edirne Province which is the most production area in Turkey. The changing of Rice production areas was monitored by 2001, 2006, and 2011 years of Landsat Images.
MATERIALS AND METHODS
This study was conducted in Edirne province because of it is the most important rice-producing area in TURKEY. In this research, the study area was started from Uzunkorpu District passing Ipsala District through Meric River and reached to Aeagan Sea in Turkey. Annual precipitation is 600 mm and annual mean air temperature is 13.5 C. The study area is under influence of Black Sea and Mediterranean Sea climate along coastline is neighbor of Marmara Sea. Interior part of the study area has continental climate. While the winter seasons are cold and rainy, the summer seasons are hot and little rainy. Meric and Ergene rivers are used as main water resource. Meric river is a much fresher water resource than Ergene river. The Rice cultivation areas in this study are comprised of the regions
which are close to river bed and bottom flat land (Şener et al,
2015).
This study had four stages; these were acquiring satellite image and pre-process, calculation of cropindex, classification and accuracy analysis. Landsat Thematic Mapper (TM) imagery with little or low cloud cover from 2001 to 2011 were acquired over the study area, which is covered by two path/row scenes (181/31 and 181/32). All image had been processed for geometric and radiometric calibration. Normalized Difference Vegetation Index (NDVI) was selected as the cropindex. NDVI is calculated with surface reflectance values from red and NIR spectral bands (Tucker, 1979). The formula is as follows:
NDVI
=
(1) [image:2.595.312.557.340.720.2]The temporal dynamics of NDVI derived from Landsat historical images could well characterize the temporal development of Rice fields. Afterwards, classification process was conducted by using of spectral values in selected samples. Maximum likelihood decision rule was implemented in classification process. Each pixel in image data was added to land cover category which was most similar type for pixel. All of data were categorized then, results were taken in the form of maps and statistical tables (Lillesand and Kiefer, 2000). The report of DSI and Agriculture Province Directory were examined and farmers survey studies were conducted. Also, 2011 year of Rapideye Satellite Image were used for accuracy process. Accuracy analysis was conducted to investigate suitability between assigned class for a pixel and actual class of it. The compatibility of actual class belonged pixels are obtained from existing maps and GPS measurements with classified pixels are controlled (Göksel, 1996). The samples belonged actual classes were randomly selected. As the pixel values of the sampling points which are basis of the classification may cause deviation for evaluating the results, land cover map can be useful (Erdas Field Guide, 2002).
RESULTS
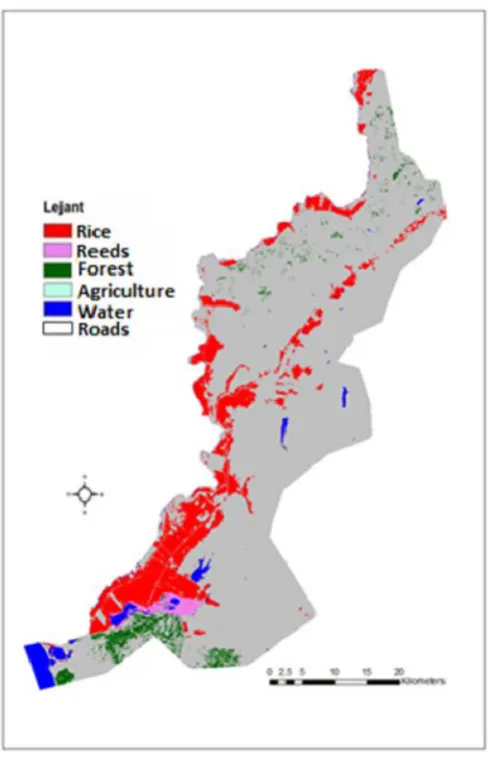
[image:3.595.334.527.86.166.2] [image:3.595.70.254.203.283.2]In the study, six main classes were Rice, forest, water, roads and agriculture were composed for type of land cover. Land use and vegetation cover distribution of year of 2011 by using Landsat TM of 2001 was given in Fig 1. Rice, agriculture, forest, water and roads were determined as 25909 ha, 150055 ha, 5615 ha, 2027 ha, 4551 ha and 963 ha respectively in 2001 (Table 1).
Table 1. Land use and vegetation cover distribution of year of 2001 (Landsat TM image)
LULC Area(ha) Percent (%)
Rice 25909 13,70
Agriculture 150055 79,34 Forest 5615 2,97
Reeds 2027 1,07
Water 4551 2,40
Roads 963 0,51
Total 189120 100
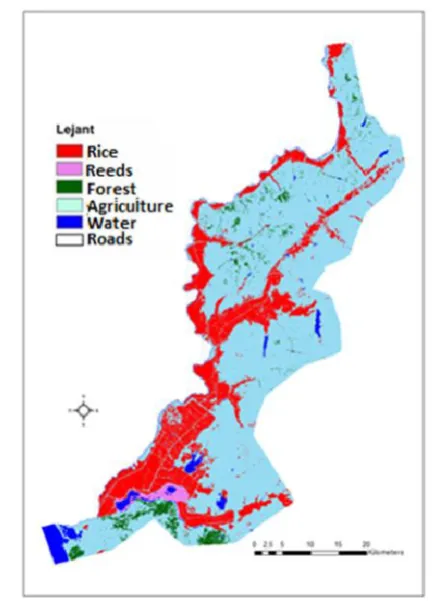
Fig 2 shows the major land use classes in the study area in 2006. Water bodies were easily identified with clear boundaries. Agricultural area was found the major land use type as 127321,25 ha in Table 2. Other land use types rice, forest, rice, water and roads were found as 43839,33 ha, 5559,56 ha, 5541,12 ha, 5089,74 ha and 1769 respectively.
[image:3.595.325.539.295.376.2]Fig. 2. Land use and vegetation cover distribution of year of 2006 (Landsat TM image)
Table 2. Land use and vegetation cover distribution of year of 2006 (Landsat TM image)
LULC Area (ha) Percent (%)
Rice 43839,33 23,2
Agriculture 127321,25 67,32 Forest 5559,56 2,9 Reeds 5541,12 2,9 Water 5089,74 2,7
Roads 1769 0,94
Total 189120 100
2011 year of Landsat satellite image classification map was given in the Fig 3.
[image:3.595.46.287.380.732.2]As it is seen in Table 3, After classification process belonged to year of 2011, agriculture, rice, forest, water, Rice and Roads were determined as 131234,90 ha, 42341,43 ha, 5562,1 ha, 6272,06 ha and 1884,50 ha, 1855ha respectively.
Table 3. Land use and vegetation cover distribution of year of 2011 (Landsat TM image)
LULC Area(ha) Percent (%)
Rice 42341.43 22,39
Agriculture 131234,90 69,38 Forest 5562.10 2.94 Reeds 1884.50 1.00 Water 6272.06 3.32 Roads 1855,00 0,98
Total 189150 100
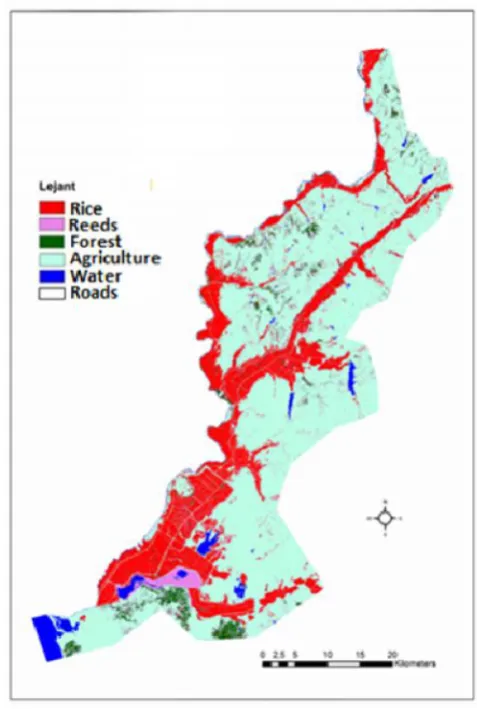
2011 year of Rapideye satellite image classification map was given in the Fig 4.
[image:3.595.75.533.410.738.2] [image:3.595.322.539.424.725.2]Fig 4. Land use and vegetation cover distribution of year of 2011 (Rapideye image)
[image:4.595.42.281.54.409.2]As it is seen in Table 4, After classification process belonged to year of 2011, agriculture, rice, forest, water and Roads were determined as 133776.11 ha, 41021.18 ha, 6855.11 ha, 5618.82 ha and 1878.44 ha respectively. Accordingly, it was seen that rice area covered 21.7 % of study area.
Table 4. Land use and vegetation cover distribution of year of 2011 (Rapideye image)
LUVC Area (ha) Percentage (%)
Rice 41021,18 21,7
Agriculture 131475,10 69,51
Forest 6855,45 3,6
Reeds 1878,44 1,0
Water 5618,82 3,0
Roads 2300,10 1,21
Total 189150 100
As a result of comparing Landsat and Rapideye image classification, LUVC were found close to each other’s especially Rice 3,21%, Agriculture 0,51% and Reeds 0,3%. this results indicated that Landsat image given sufficient results as much as Rapideye image. Changes in rice planting areas are given in Fig 5. As shown in Fig 5, it is generally observed that the increase in rice planting areas. Rice area in the 1990 was 16312 ha 43 839 ha in 2011 and in 2006 was identified as the 42 341 ha. Rice cultivation areas reached 42 341 ha in 2011, while it was 16 312 ha in 1990.
Fig. 5. Rice fields changing between in research area (2001-2011)
Accuracy assessment was derived from random selected point in order to reveal accuracy percentage of supervised classification technique for all year. Accuracy assessment was performed for all years. The results of accuracy assessment of 2011 Landsat and Rapideye images were given in Table 4.and Table 5. Overall accuracy was determined as 84,38 % and 85,56 % for 2011 Landsat image and Rapideye image respectively. On the other hand, kappa statistics were calculated as 0.8113 and 0,8232 for 2011 Landsat image and Rapideye image respectively.
Table 4. Accuracy assessment of land use and land cover classification (2011 Landsat image)
[image:4.595.312.557.395.475.2]Overall classification accuracy is 84.38%. Overall Kappa statistics is 0.8113
Table 5. Accuracy assessment of land use and land cover classification (2011 Rapideye image)
Class Name
Reference Totals
Classified Totals
Number Correct
Producers Accuracy
Users Accuracy
Rice 17 16 15 88,24 93,75
Reeds 9 11 8 88,89 72,73
Water 11 11 11 100,00 100,00
Road 25 21 18 72,00 85,71
Forest 11 10 9 81,82 90,00
Agriculture 17 21 16 94,12 76,19
Totals 90 90 77
Overall classification accuracy is 85,56 %. Overall Kappa statistics is 0,8232
DISCUSSION
[image:4.595.48.274.551.631.2] [image:4.595.297.572.554.644.2]Rice-dominated landscape areas but It was seen that Landsat satellite image classification also gives quite good results.
Conclusion
In this study, it was tried that determine changing of rice production area by years in Edirne Province. Rice remains under water for a long time in terms of plant breeding techniques and it makes easier to detect with the satellite’s thermal band. During the study, it was found to have a general upward trend over the years of Rice fields in the research area. On the other hand, during the study comparison between using of Rapideye and Landsat satellite images was also possible. When examining images for 2011, especially rice, agriculture and reeds field trials give very close results by the two images. So, it was determined that both images could be used safely in such activities.
REFERENCES
Aksoy E., G. Özsoy, M.S. Dirim, Z. Tümsavaş, Arazi Örtü/Arazi Kullanım Haritalamada Uzaktan Algılama ve CBS Tekniklerindeki Son Gelişmeler: U.Ü. Kampus Alanı
Örneği. Gap II. Tarı m Kongresi Bildirisi. Şanlıurfa, 24-26
Ekim 2001
Altinbaş Ü. Agriculturesal Alanlarda Yeni Tekniklerin
Kullanımı-Uydu Teknolojisi-Çiftçi Dergisi sayı: 2, 2003.
Ayhan E., F. Karsli, E. Tunç, Uzaktan Algılanmış
Görüntülerde Sınıflandırma ve Analiz, Harita Dergisi,2003.
Brooks C. N., R. Nevada, R.B. Powell, N.H.F. French, R.A. Shuchman, Multi-temporal and multi-platform agricultural land cover classification in Southeastern Michigan. ASPRS
2006 Annual Conference Reno, Nevada Š May 1-5, 2006
Chuvieco, E. Integration of Linear Programming and GIS for Land Use Modeling. International Journal of Geographical Information Systems, 7 (1), 71-83,1993.
Davidson D. A., S. P. Theocharopoulos, R.J. Bloksma, A L and Evaluation Project in Greece Using GIS and Based on Boolean and Fuzzy Set Methodologies. International Journal of Geographical Information Systems, 8(4), p. 369-384,1994.
Eraktan, G. Türk Agriculture Politikasında AB’ye Uyum
Çalışmaları, Agriculture ve Mühendisliği, 64,25-36, 2002.
http://www.tarim.gov.tr/arayuz/5/içerik.asp?efl_makaleler /index.htm &curdir=\sanal_kutuphane\makaleler &fl=turk Agriculture/turk_tarim1.html.
Esetlili M.T., Y. Kurucu, Research on Supervised Classification Methods to Determine Cotton Planted Areas by Remote Sensing Technique. Ege University, Journal of Agricultural Faculty. 40(2): 105-112,2002.
Frolking S., J. Qiu, S. Boles, X. Xiao, J. Liu, Y. Zhuang, C. LI, X. Qin, Combining remote sensing and ground census data to develop new maps of the distribution of rice agriculture in China, Global Biogeochemical Cycles, VOL. 16, NO. 4, 1091, doi:10.1029/2001GB001425, 2002.
Kansu, O., Uzaktan algılamada Görüntü Sınfılandırma yöntemleri analizi, Karadeniz Teknik Üniversitesi Fen Bilimleri Enstitüsü, Yüksek Lisans Tezi, 120s,Trabzon Kavzaoğlu T., G.Y.T.E Uzaktan Algılama 1 Ders Notları
(yayınlanmamış), G.Y.T.E Yüksek Lisans Programı , Gebze,2002.
Lillesand T. M., R. W. Kiefer, Remote Sensing and Image Interpretation, John Wiley&Sons Inc., New York,2000.
ReisS., T. Yomralioğlu, Landsat 7 ETM+ Uydu Görüntüsü ile
Trabzon İli Arazi Örtüsünün Belirlenmesi, Doğu Karadeniz Bölgesinde Kırsal Alanda Ulaşım, Yerleşim Sorunları ve Çözümleri Sempozyumu, s:306-315, 18-20,2004.
Woodcock C. E., S. A. Macomber, Monitoring large areas for forest change using Landsat: Generalization across space, time and Landsat Sensors. Remote Sensing of Environment. 78 (1): 194-203,2001.