ISSN Online: 1945-3108 ISSN Print: 1945-3094
DOI: 10.4236/jwarp.2018.1010058 Oct. 29, 2018 994 Journal of Water Resource and Protection
Development and Testing of a Variable Rate
Nitrogen Application System through an
Overhead Irrigation System
Phillip B. Williams
1, Ahmad Khalilian
1, Michael W. Marshall
2,
Joe Mari Maja
2, Haibo Liu
3, Dara Park
3, Ali Mirzakhani Nafchi
41Department of Agricultural Sciences, Clemson University, Clemson, USA 2Edisto Research and Education Center, Clemson University, Blackville, USA
3Department of Plant and Environmental Sciences, Clemson University, Clemson, USA 4Cornell University, Cooperative Extension, Ithaca, USA
Abstract
Nutrients are injected through overhead irrigation systems at a uniform rate in a process known as fertigation. The highly variable soils in the Southeas-tern US pose challenges for effective fertigation. Currently, there is no varia-ble-rate fertigation system available to apply the correct amount of N within a field through an overhead irrigation system. Therefore, the objective of this study was to develop and test a variable-rate N application system that works independently of irrigation water flow for site-specific N application. The va-riable-rate fertigation system (VRFS) was designed to apply different rates N using a pulse width modulation technique. The VRFS utilized the Clemson Lateral Irrigation Control software which controlled the solenoids in each zone by turning the N supply on and off (pulsing) for each zone. In this study, four tests were conducted to determine the uniformity of the VRFS. In test # 1, the pump output showed a linear slope relationship and was the same for water and N. In test # 2, nozzle flow and uniformity were determined us-ing four different irrigation system travel speeds at N application rates of 31, 59, 88, and 113 kg/ha. There was a strong correlation (R2 = 0.9998) between irrigation system speed and N rate. In test # 3, the uniformity across the length of the irrigation system was determined. The nozzles produced an av-erage flow of 31.1, 58.7, 87.6, and 112.7 kg N/ha with an overall avav-erage error of 0.1% across all N rates. Results also showed the system was capable of ac-curately applying N based on prescription maps with an error of less than 1.8%. Test # 4 was conducted to determine the accuracy of the map-based controller system for applying variable rate N. There was a strong correlation How to cite this paper: Williams, P.B.,
Khalilian, A., Marshall, M.W., Maja, J.M., Liu, H.B., Park, D. and Nafchi, A.M. (2018) Development and Testing of a Variable Rate Nitrogen Application System through an Overhead Irrigation System. Journal of Water Resource and Protection, 10, 994-1011.
https://doi.org/10.4236/jwarp.2018.1010058
Received: September 11, 2018 Accepted: October 26, 2018 Published: October 29, 2018
Copyright © 2018 by authors and Scientific Research Publishing Inc. This work is licensed under the Creative Commons Attribution International License (CC BY 4.0).
DOI: 10.4236/jwarp.2018.1010058 995 Journal of Water Resource and Protection between target N and actual N rates (R2 = 0.9999). In summary, the VRFS ap-plied the correct amounts of N within each zone by either manually control-ling the pulsing mechanism or utilizing a prescription map to apply different rates throughout the field.
Keywords
Cotton, Nitrogen, Fertigation, Irrigation, Variable Rate, Nutrient Management, Precision Agriculture
1. Introduction
The adoption of irrigation in the Southeast US has accelerated considerably since 2002, increasing at a rate of 4047 hectares per year [1]. Therefore, many growers apply nutrients through irrigation systems, known as fertigation. Dur-ing fertigation events, nutrients are injected into the irrigation water and dis-persed onto the ground and the leaves. The fertilizer that contacts the leaves is considered foliar fertilization. Foliar fertilization improves the efficiency and ra-pidity of nutrient utilization required by the plant for maximum growth and yield. In this way, the foliar fertilization that subsequently lands on the plants leaves provides a more efficient supply of nutrients to the developing plant for optimum yields and quality [2].
The common method of fertigation is using a pumping apparatus that injects the nutrients from a tank filled with nutrients at the base of the irrigation system into the main irrigation water line. This method applies fertilizer uniformly across the entire field [3]. However, this method does not account for variation in soil texture and water holding capacity (which can vary considerably in the Southeast region), all which could subsequently have a major impact on crop fertilizer management strategies [4]. Yield response to N fertilizer also varies significantly among different sections of a production field due to the variation in soil even in small fields (less than 4 hectares in size) in the Southeast region. The spatial soil variability adds to the difficulty in N application, use, and proper timing for a cropping season [5]. For example, soil variability can result in a tremendous amount of growth variability in cotton plants [6] [7]. Soil type also affects the frequency of fertilizer application. Sandy soils require more frequent applications of smaller amounts of nitrogen than clay soils because these nu-trients leach more readily in sandy soils due to its larger particle size. The nitrate form of N, which is the preferred form of N in the soil for plant uptake, is highly mobile and can move through the soil after rainfall or irrigation more rapidly in a sandy soil [8]. Therefore, a uniform application of N fertilizer over the entire field can be both costly and environmentally unsound [9].
DOI: 10.4236/jwarp.2018.1010058 996 Journal of Water Resource and Protection and wheat farmers over $1.8 billion annually [10]. Applying the proper N ferti-lizer rate is a critical management decision for producers in the Southeastern US. Currently, there is no variable-rate fertigation equipment available to apply a correct amount of N where it is needed within a field. Additionally, there are no practical decision-making tools available for variable-rate application of N through overhead sprinkler irrigation systems, which is the predominant type of row crop irrigation system in the Southeastern US.
2. Objectives
The objectives of this study were to: 1) design and develop a variable-rate N ap-plication system that works independently of irrigation water flow and can be retrofitted onto an overhead irrigation system (conventional or variable-rate), 2) adapt the Clemson Variable Rate Irrigation (VRI) software, developed for varia-ble-rate irrigation system [11] to apply variable-rate N based on crop needs, 3) test this system for accuracy under actual field conditions.
3. Methodology
3.1. Design Criteria
The variable-rate N application system was designed and constructed using the following criteria. The system should 1) Have the capability of applying different rates of N ranging from 0 to 337 kg/ha; 2) Utilize the pulsing technique to con-trol the rate of application to allow for precise zone management; 3) Easily be retrofitted on an existing overhead irrigation system (uniform-rate or varia-ble-rate); 4) Apply fertilizers based on crop needs and be independent of the amount of irrigation water is being applied at that location; 5) Be controlled us-ing pre-described fertilizer rates (map-based) and could communicate with GPS and GIS software; and 6) Maintain a constant pressure throughout the fertilizer application system so that uniform application of N can be achieved.
3.2. Equipment
A 76-m long linear-move irrigation system (Reinke Manufacturing, Deshler, Nebraska, USA), was modified to apply variable-rate nitrogen (VRN) using low energy precision application (LEPA) drops. The LEPA irrigation drops consisted of Quad Spray® nozzles (Senninger Irrigation Inc., Clermont, FL, USA) hanging so that the irrigation emitter was 25 cm above the ground.
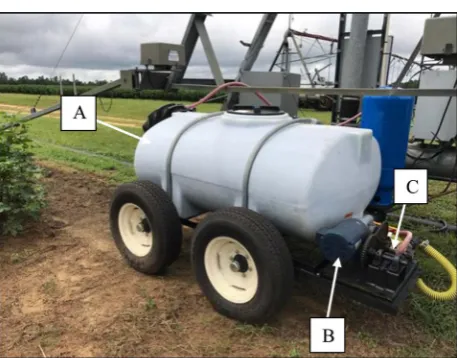
A special trailer was designed and constructed to carry the fertilizer tank and injection equipment alongside the irrigation system (Figure 1).
DOI: 10.4236/jwarp.2018.1010058 997 Journal of Water Resource and Protection
Figure 1. Custom designed trailer apparatus with 1250-liter tank (A), motor (B), and roller pump (C) attached to linear-move irrigation system.
pressure throughout the injection system by using an adjustable pressure switch (Square D Industries, Andover, MA, USA). The pressure switch energized the electric motor to pump more N into the bladder tank when the system pressure dropped below 0.276 MPa and to turn off the motor when pressure reached above 0.345 MPa. The bladder tank and pressure switch combination also kept N pressures above that of the irrigation water which facilitated injection into the LEPA drops. A flow divider (Prince Hydraulics, North Sioux City, SD, USA) was installed between the bladder tank and the main N line, which made it possible to increase or decrease maximum N rate throughout the system and send any excess flow back to the tank.
The VRFS uses the nozzle pulsing system as described by Perry [12]. The pulsing system cycles individual or a group of N injection solenoids OFF and ON to achieve desired N rates within management zones. The N injection system was divided into ten zones along the length of the irrigation system. Each zone was controlled independently to apply different N rates based on the prescription map. The VRFS consists of one main N line made from 1.9-cm Chlorinated Polyvinyl Chloride (CPVC) that spans the length of the irrigation system. The main N line feeds ten manifolds along the irrigation system. Ten normally closed, 2-way, 24 V electric solenoid valves (US Solid model: USS-LSV00005, Joyfay International LLC, Cleveland, OH, USA) were used to control N rates.
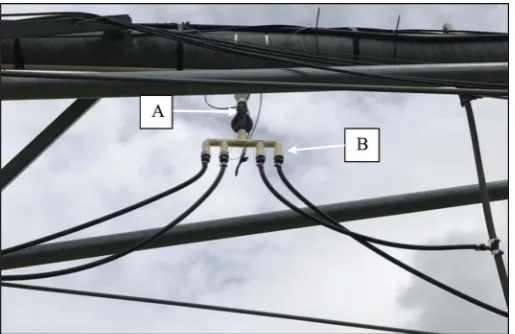
Each solenoid valve was attached to a manifold with four outlets which, in-jected N into four irrigation drop nozzles (Figure 2).
irriga-DOI: 10.4236/jwarp.2018.1010058 998 Journal of Water Resource and Protection tion drop.
3.3. Control System and Custom Software
The electrical signals, sent to the solenoids to turn the N flow off and on, were controlled by a solid-state relay board (SSR-RACK24, Measurement Computing, Middleboro, MA, USA) with AC-switch solid-state relays (SSR-OAC-05, Mea-surement Computing, Middleboro, MA, USA). A laptop computer, equipped with a data acquisition and control adaptor (MiniLab-1008, Measurement Computing), was used to control ten lines of digital output to the solid-state re-lay board. A GPS antenna was installed on top of the lateral and connected to a receiver (AgGPS 132, Trimble Navigation Limited, Sunnydale, CA, USA), the GPS system provided 30 cm accuracy. A 120 to 24-volt AC transformer (Acme Electric, Menomonee Falls, WI, USA) was used to supply power to the solenoids. These electronic components were mounted inside a weather-proof NEMA box
[image:5.595.246.504.307.474.2](Figure 3).
Figure 2. US Solid 24v solenoid (A) and nitrogen injection manifolds (B).
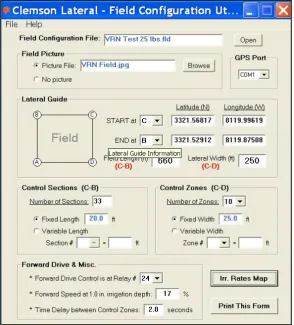
[image:5.595.260.486.504.692.2]DOI: 10.4236/jwarp.2018.1010058 999 Journal of Water Resource and Protection Clemson Lateral Irrigation Control (CLIC) software [11] was modified and utilized to support Clemson variable rate N injection system. To operate this system, two software programs were utilized; one to setup the field data and one to setup the rates for each zone. The software first collects field information, in-cluding the length and width of the field, its GPS coordinates, the orientation of the lateral, and the number of N control sections and zones. The field was di-vided into “Sections” and “Zones” in which the N rates could be controlled
(Figure 4).
The “Control Section” followed the direction of the Lateral Guide (travel path). The section length can be fixed or variable. In this study, fix length of 18-m was selected for all sections.
The number of zones was set by the hardware and matched the number of re-lays (solenoid valves) installed on the lateral. In this study, the zone width was eight rows because the N was injected from the manifold into four irrigation drops. The program had the capabilities to manage up to 24 digital control lines. In the present study, only ten were utilized representing the number of solenoids (zones) that were used.
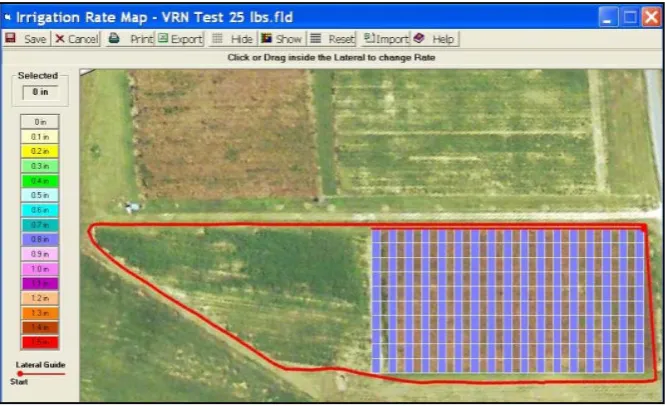
[image:6.595.226.521.368.694.2]The N rate information was then entered on the second part of the “Field Configuration Utility”. The N amount was set by clicking one of the rate buttons
DOI: 10.4236/jwarp.2018.1010058 1000 Journal of Water Resource and Protection on the left and clicking anywhere inside the field to apply the selected rate to the zone. A custom rate could be set by right-clicking on any section (or plot) and entering a N rate (Figure 5).
A N prescription map could also be imported from or exported to an Excel spreadsheet. The second software program, Clemson Lateral Nitrogen Control (CLNC), utilizes the N application map and controls the fertigation system using the position signal from the DGPS. The control system can turn a bank of N in-jectors (solenoids) ON/OFF in each zone, utilizing a 60-s cycle. The CLNC pro-gram determines the highest N rate among the zones along the irrigation system. It then calculates the nozzle ON/OFF time for the rest of each zone, as the frac-tion of the highest N rate, in a 60-s ON/OFF cycle. For example, if zone one has the highest N rate of 100 kg/ha, and the N rate for zone two is 50 kg/ha, then the solenoid in zone one will stay ON, while the solenoid in zone two will be turned ON for 30 sec. and OFF for 30 sec. To accomplish this, the program conti-nuously reads the GPS location signal to determine which section of the field the injection system is located. When the injection system moves into a new section in a field, the software checks all the N rates in that section. The software then identifies the highest N rate that needs to be applied to that section. The system does not pulse the nozzles for the highest rate but calculates the new pulsing (ON and OFF times) pattern for the rest of the N rates, as percent of the highest rate. However, the system cannot adjust the flow control valve to deliver the highest N rate. This is because the current flow control valve installed on the in-jection system is a “manually controlled” valve. Currently, the highest rate (for a given section) is adjusted manually.
[image:7.595.208.541.487.690.2]The forward speed of a conventional irrigation system is constant; therefore, all N rates (for developing a prescription map) can be calculated for the entire field, based on a constant speed. However, for a variable-rate irrigation system,
DOI: 10.4236/jwarp.2018.1010058 1001 Journal of Water Resource and Protection the forward speed (in addition to pulsing patterns) changes based on the irriga-tion water rates. The change in system speed will affect the applied N rates. For example, if a section in the field requires only one rate of N (100 kg N/ha) and two rates of irrigation water (1 and 2-cm deep), then the forward speed of the ir-rigation system will be reduced to increase irir-rigation water depth from one 1 cm to 2 cm. This change in forward speed could almost double the N rate for a por-tion of that secpor-tion, as a result, fertilizer would be wasted. Therefore, the out flow of the fertilizer injection system (without pulsing) needs to be calibrated for different speeds, after installing the equipment on an overhead irrigation system.
3.4. N Injection System Performance Tests
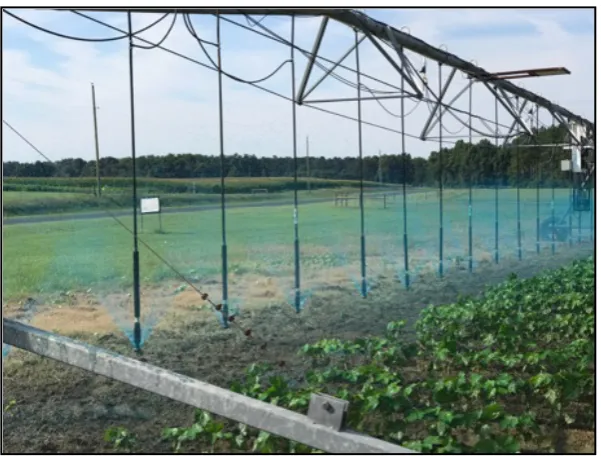
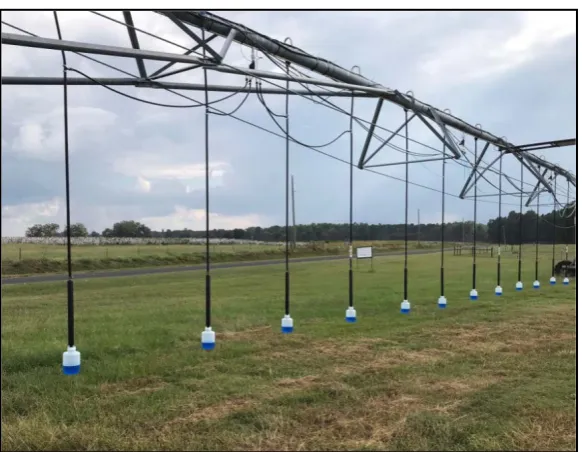
Four tests were conducted to determine the uniformity of the variable-rate N fertigation application system. The variable rate N fertigation system was cali-brated for accuracy using 3-L bottles (Figure 6). Thirty-eight of these bottles were used to match the number of the irrigation drop nozzles that were on the system. Because the system pulses solenoids ON and OFF to produce the desired amount of N, the uniformity of fertilizer application along the system was a concern. Application uniformity can be defined as a measure of the evenness of distribution over the entire area [13]. The Quad Spray® drops at the end of all drop nozzle were removed, and the bottles were installed using custom designed bottle caps. Since every drop nozzle had a bottle, calibrations were accurately measured with no loss of liquid (Figure 6).
[image:8.595.225.523.485.706.2]The first step was to visually observe that the injection system was adequately dispersing N into the drop nozzles once the irrigation water was on. For this purpose, the fertilizer tank was filled with water, and four liters of a blue spray indicator (Turf Mark, BASF, Research Triangle Park, NC, USA) was added to the tank and was thoroughly mixed with the water inside the tank. The irrigation
DOI: 10.4236/jwarp.2018.1010058 1002 Journal of Water Resource and Protection water was then turned on along with the N injection system. It was apparent that the blue dye was being injected through all the manifolds, mixing with irrigation water and being dispersed properly (Figure 7).
3.4.1. Test # 1
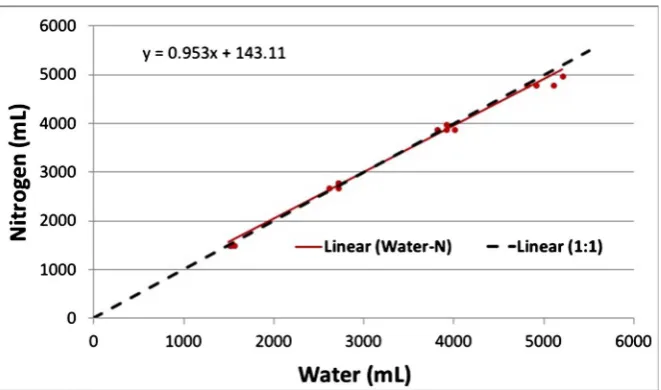
For calibration purposes, the system was tested using dyed water to not inadver-tently waste N. To accurately test the system, a “water:nitrogen” test was con-ducted to ensure that the amount of water produced corresponded to how much N was being applied. This was obtained by pumping N with the VRFS and doing the same with water to see if there were any differences between the two liquids. Collection bottles were placed on each drop nozzle and the VRFS was set at 100% so the system would not pulse; then timed for a total of two minutes. After the two minutes the system was shut off. This was replicated five times for both water and N. The amount (in units of volume) collected from both the N and the water was measured and recorded from each drop.
3.4.2. Test # 2
For this test, the N rates were controlled by changing the travel speed of the lat-eral irrigation system without pulsing nozzles. Four travel speeds of 31, 41, 62, and 123 m/h were used for this purpose. The speed was set at the control panel and bottles were placed on each nozzle of the lateral (Figure 8). The samples were collected for a 30-m distance for each travel speed, and the tests were rep-licated 5 times. The amounts (in units of volume) were collected, measured, and recorded from each drop nozzle.
3.4.3. Test # 3
[image:9.595.223.524.466.694.2]The fertilizer injection system was tested for uniformity across the length of the
DOI: 10.4236/jwarp.2018.1010058 1003 Journal of Water Resource and Protection
Figure 8. Uniformity test sample collection using 3-L bottles attached to the LEPA drop nozzles.
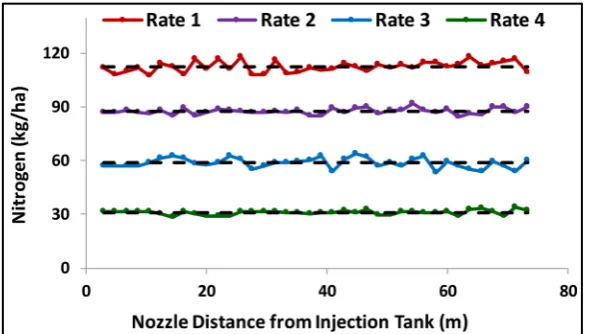
irrigation system. This test was conducted to determine if the N amounts from the nozzles closest to the N tank were different than the N amounts from the nozzles farthest from the N tank. Four different N application rates (31, 59, 88, and 113 kg/ha) were tested by manually setting the flow control valve. These N rates were assigned to all ten zones and replicated five times. Each rate was col-lected with the irrigation system stationary for a total of one minute. The amounts (in units of volume) were collected, measured, and recorded from each drop nozzle. The actual data were compared with the target N rates between each drop nozzle and zone. Deviations from target values for each drop nozzle were calculated as percent error.
Individual nozzles were also tested in all ten zones to ensure that each nozzle was giving the desired amount of N rate when nozzles were pulsing. Bottles were installed at the end of each nozzle of the lateral, and the N injection system was turned on and N samples were collected in the bottles for one minute. The bot-tles were measured after each pulsing test. All the nozzles were tested at the 100%, 75%, 50%, and 25% pulsing (ON and OFF) simultaneously for each puls-ing percentage. Errors for each nozzle output were calculated by subtractpuls-ing the measured value by the target value and dividing by the target value. Control lim-its were also tested to determine the acceptability of the systems uniformity and performance.
3.4.4. Test # 4
DOI: 10.4236/jwarp.2018.1010058 1004 Journal of Water Resource and Protection kg/ha which corresponds to the solenoids constantly on (100% pulsing). For the other three rates (28, 56, 84 kg/ha), the controller pulsed the nozzles at 25%, 50%, and 75%, respectively. For example, for 25%, the nozzles were ON for 15 s (25% of one minute) and OFF for 45 s. Again, bottles were mounted in place of each nozzle of the lateral, and samples were collected for 6 m along the lateral ir-rigation travel. Tests were repeated five times. The collected samples (actual) were compared to target values in the N prescription map, to determine system accuracy.
4. Results and Discussion
4.1. Test # 1
A pump output test was conducted with N and again with water. To determine agreement between N and water volume a scatter plot was created to visualize the relationship (Figure 9). To confirm a 1:1 relationship a regression analysis was conducted which included the replication effect. A t-test of the slope coeffi-cient confirmed that the actual slope was close to 1, which determined that the output volume of the pump with water and N was the same. The only difference is the density of material was 1 kg/L and 1.28 kg/L for water and N, respectively.
4.2. Test # 2
Nozzle flow and uniformity tests were conducted using four different travel speeds (125, 62, 41 and 31 m/hr). N application rates for these speeds were 31, 59, 88, and 113 kg/ha, respectively. This determined that there is an exponential relationship with N rates versus speed of travel. Figure 10 shows correlation between the irrigation system’s forward speed and the N rates.
[image:11.595.210.541.508.703.2]4.3. Test # 3
Figure 11 shows application uniformity across the width of the irrigation system.
DOI: 10.4236/jwarp.2018.1010058 1005 Journal of Water Resource and Protection
Figure 10. The correlation of N rates with the forward speed of the linear-move irrigation system.
Figure 11. The nozzle output across the width of the linear-move irrigation system at four different rates of N. The (---) lines indicate the target rates of 31, 59, 88, and 113 kg N/ha for actual N rate 4, 3, 2, and 1, respectively.
[image:12.595.226.521.362.529.2]DOI: 10.4236/jwarp.2018.1010058 1006 Journal of Water Resource and Protection for all rates was 0.1%.
Individual nozzle output was also tested at different pulsing rates for all ten zones. The tests were conducted for the duration of one minute at 25%, 50%, 75%, and 100% of nozzle pulsing (ON time). In each zone (plot), there were four drop nozzles, marked as nozzles 1, 2, 3, and 4. Output flow from these nozzles was collected and converted to kg N/ha. Tests were replicated ten times for each percentage ON time. To determine if the system was uniform along the length of the irrigation system a control limits statistical analysis was performed. All puls-ing rates were uniform and were within control limits (Figure 12).
The average target and actual N rates for each nozzle were tested for accu-racy of delivery. These nozzles produced average N rates of 26.0, 55.6, 82.9, and 111.3 kg/ha, for 25%, 50%, 75%, and 100% of nozzle ON time, respectively. The overall average error for this test was 1.8% with a maximum error of 5.2%.
4.4. Test # 4
[image:13.595.115.543.315.676.2]This test was conducted to determine the accuracy of the map-based controller
DOI: 10.4236/jwarp.2018.1010058 1007 Journal of Water Resource and Protection system for applying variable-rate N. (Figure 13) shows the results of the accura-cy test for the map-based controller system. The system produced an average flow of 26.8, 55.6, 83.1, and 113.3 kg N/ha, for prescription map rates of 28, 56, 84, and 112 kg N/h, respectively. The average application error for all rates was 1.8%. The application errors ranged from 0.8 % to 4.4%. The 28 kg N/ha rate had the highest error, whereas, the 112 kg N/ha rate had the lowest application error. To determine agreement between N application uniformity and distance traveled a scatter plot was created to visualize the relationship for each N rate over the distance traveled by the linear-move irrigation system (Figure 13).
To determine agreement between N application uniformity and distance tra-veled a 1:1 relationship a regression analysis was conducted which included the replication effect. A t-test of the slope coefficient was conducted to confirm that the actual slope was equal to 1 (Table 1). A control limit test was also conducted to determine if the application rates were acceptable (Figure 14).
[image:14.595.208.542.368.549.2]There was a strong correlation (R2 = 0.9999) between the target and actual N application rates. To determine agreement between target N rates and actual N rates a scatter plot was created to visualize the relationship (Figure 15). To con-firm a 1:1 relationship a regression analysis was conducted which included the replication effect. A t-test of the slope coefficient was conducted to confirm that
Figure 13. Application uniformity at 25%, 50%, 75%, and 100% pulsing along the direc-tion of the linear-move irrigadirec-tion system travel using the map-based controller over a 6 m distance.
Table 1. ANOVA table for application uniformity along the direction of the lateral irriga-tion travel using the map-based controller.
Source DF Sum of Squares Mean Square F Value Pr > F Model 1 140099.14 140,099 47,423 <0.0001
Error 178 525.86 2.954259
Corrected Total 179 140625
[image:14.595.205.539.636.724.2]DOI: 10.4236/jwarp.2018.1010058 1008 Journal of Water Resource and Protection
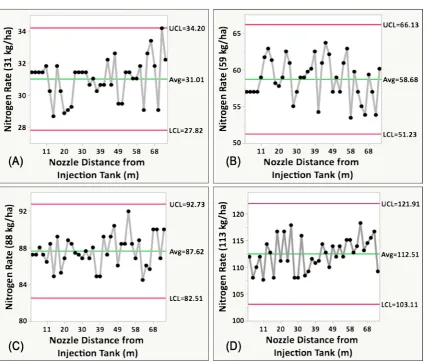
Figure 14. Application uniformity along the direction of the linear-move irrigation system travel using the map-based controller. (A) 25% pulsing N rate, (B) 50% pulsing N rate, (C) 75% pulsing N rate, (D) 100% pulsing N rate.
[image:15.595.170.486.456.702.2]DOI: 10.4236/jwarp.2018.1010058 1009 Journal of Water Resource and Protection
Table 2. ANOVA table for Target N versus actual N rates of the map-based controller.
Source DF Sum of Squares Mean Square F Value Pr > F Model 1 15666.678 15666.7 55411.62 <0.0001
Error 18 5.089 0.282733
Corrected Total 19 15671.767
Term Estimate Std Error t Ratio Prob > |t| Lower 95% Upper 95% Actual/Target
(kg/ha) 1.0013328 0.004254 235.40 <0.0001 0.9923 1.0102
the actual slope was equal to 1 (Table 2).
5. Conclusions
A VRFS was developed, installed, and tested on a lateral-move irrigation system to deliver site-specific N rates. The application system closely followed design specifications and can apply different rates of N ranging from 0 to 135 kg/ha and could easily be retrofitted on an existing overhead irrigation system (uni-form-rate or variable-rate). The VRFS was completely independent of the amount of irrigation water being applied to a location in a field and could apply fertilizers based on crop needs.
The average application errors for the nozzle flow uniformity tests were 0.3%, 0.5%, 0.5%, and 0.3%, for the target application rates of 31, 59, 88, and 113 kg N/ha, respectively. Surprisingly, the average error for all rates was 0.1%. These results determined that the output of the VRFS was uniform across the whole length of the irrigation system.
Nozzle pulsing test produced average N rates of 26.0, 55.6, 82.9, and 111.3 kg N/ha, for 25%, 50%, 75%, and 100% of nozzle ON time, respectively. The overall average error for this test was 1.8% with a maximum error of 5.2%.
The controller system successfully communicated with GPS and GIS soft-ware, which closely followed the prescription map, and switched from one rate of N to another at the exact location, specified in the prescription map. The controller software was written so that no two banks of nozzles would turn ON or OFF at the same time to reduce fluctuations in the line pressure of the in-jection system. The system produced an average flow of 26.8, 55.6, 83.1, and 113.3 kg N/ha, for prescription map rates of 28, 56, 84, and 112 kg N/h, re-spectively. The average application error for all application rates was 1.8%. The application errors ranged from 0.8 % to 4.4%. The 28 kg N/ha rate had the highest error, whereas, the 112 kg N/ha rate had the lowest application error. There was also a strong correlation (R2 = 0.9999) between the target and actual N application rates.
DOI: 10.4236/jwarp.2018.1010058 1010 Journal of Water Resource and Protection
Acknowledgements
Technical Contribution No. 6587 of the Clemson University Experiment Sta-tion. This material is based upon work supported by NIFA/USDA, under project numbers 2016-04590 and SC-1700540. Additional funding provided by National Cotton Council and the SC Cotton Board. The authors also acknowledge the funding support of the Clemson Public Service Activities.
Disclaimer
The mention of a trade name does not imply endorsement of the product by Clemson University to the exclusion of others that might be suitable.
Conflicts of Interest
The authors declare no conflicts of interest regarding the publication of this pa-per.
References
[1] United States Department of Agriculture (2017) National Agricultural Statistics Service, Crop Production Summary.
http://usda.mannlib.cornell.edu/usda/current/CropProdSu/CropProdSu-01-12-201 8.pdf
[2] Oosterhuis, D. (2009) Foliar Fertilization: Mechanisms and Magnitude of Nutrient uptake. Proceedings of the Fluid Forum, 15-17 February 2009, Phoenix, AZ. http://www.fluidfertilizer.com/Forum%20Presentations/2009/2009%20Forum%20P
roceedings/Derrick%20Oosterhuis.pdf
[3] Verbree, D., McClure, A. and Leib, B. (2013) Fertigation of Row-Crops Using Overhead Irrigation. University of Tennessee Extension Publication, W303.
https://extension.tennessee.edu/publications/Documents/W303.pdf
[4] Duffera, M., White J. and Weisz, R. (2007) Spatial variability of Southeastern U.S. Coastal Plain Soil Physical Properties: Implications for Site-Specific Management.
Geoderma, 137, 327-339. https://doi.org/10.1016/j.geoderma.2006.08.018
[5] Scharf, P., Lorry, J., Kitchen, N., Sudduth, K. and Davis, J. (2002) Spatial Variability of Optimum N Rate for Corn. American Society of Agronomy, Madison, WI. [6] Kablan, L.A., Chabot, V., Mailloux, A., Bouchard, M.È. and Bruulsema, T. (2017)
Variability in Corn Yield Response to Nitrogen Fertilizer in Eastern Canada.
Agronomy Journal, 109, 2231-2242.
[7] Jones, M.A. (2008) Utilizing Crop Vegetation Indices (NDVI) Measurements to Potentially Reduce Input Costs Associated with Plant Growth Regulator and Harv-est Aid Applications. Proceedings of the Beltwide Cotton Conferences, National Cotton Council of America, 8-11 January 2008, Memphis, TN,158-161.
[8] Dexter, A.R. (2004) Soil Physical Quality; Part I. Theory, Effects of Soil Texture, Density, and Organic Matter, and Effects on Root Growth. Geoderma, 120, 201-214.https://doi.org/10.1016/j.geoderma.2003.09.004
[9] Crouse, D.A. (2017) Soils and Plant Nutrients, North Carolina Extension Gardener Handbook. NC State Extension, Raleigh, NC.
DOI: 10.4236/jwarp.2018.1010058 1011 Journal of Water Resource and Protection
[10] Nafchi, A.M., Maja, J.M., Khalilian, A., Han, Y., Rogers, N., Payero, J.O., Marshall, M.W., Williams, P.B. and Fox, J. (2017) An Electro-Mechanical Controller for Ad-justing Piston Pump Stroke On-the-Go for Site-Specific Application of Crop Nu-trients. Agricultural Sciences, 8, 949-959. https://doi.org/10.4236/as.2017.89069 [11] Han, Y.J., Khalilian, A., Owino, T.O., Farahani, H.J. and Moore, S. (2009)
Devel-opment of Clemson Lateral Variable-Rate Irrigation System. Computers and Elec-tronics in Agriculture, 68, 108-113. https://doi.org/10.1016/j.compag.2009.05.002 [12] Perry, C., Pocknee, S. and Hansen, O. (2003) A Variable Rate Pivot Irrigation
Con-trol System. In: Stafford, J. and Werner, A., Eds., ECPA 2003, Proceedings of the Fourth European Conference on Precision Agriculture, Wageningen Academic Publishers, Wageningen, 539-544.