Electrospray deposition in vacuum as method to create functionally
active protein immobilization on polymeric substrates
Enzo Fornari a, Clive J. Roberts a, Robert H. Tempertonb, James N. O’Sheab a
Laboratory of Biophysics and Surface Analysis, School of Pharmacy, The University of Nottingham, Nottingham NG7 2RD, UK
b
School of Physics and Astronomy and Nottingham Nanotechnology and Nanoscience Centre (NNNC), University of Nottingham, Nottingham NG7 2RD, UK
Abstract
We demonstrate in this work the deposition of a large biological molecule (fibronectin) on
polymeric substrates in a high vacuum environment using an electrospray deposition
system. Fibronectin was deposited and its distribution and structure investigated and
retention of function (ability to promote cell adhesion) on return to liquid environment is
shown. AFM was used to monitor changes in the morphology of the surface before and after
fibronectin deposition, whilst the biological activity of the deposited protein is assessed
through a quantitative analysis of the biomolecular adhesion and migration of fibroblast
cells to the modified surfaces. For the first time we have demonstrated that using high
vacuum electrospray deposition it is possible to deposit large protein molecules on
polymeric surfaces whilst maintaining the protein activity. The deposition of biological
molecules such as proteins with the retention of their activity onto clean well-controlled
surfaces under vacuum condition, offers the possibility for future studies utilizing high
resolution vacuum based techniques at the atomic and molecular scale providing a greater
understanding of protein–surface interface behaviour of relevance to a wide range of
applications such as in sensors, diagnostics and tissue engineering.
1. Introduction
The ability to create functional scaffolds with the capacity to support cell adhesion, growth
and migration, for applications in tissue engineering requires scaffolds with specific
biochemical microenvironment play an essential role in the promotion of cell adhesion, cell
viability and migration. The use of extra cellular membrane proteins and cell surface
markers to facilitate cell adhesion and migration on substrates such as fibronectin, has been
extensively studied. [3,4].
Fibronectin (FN) is a large dimeric glycoprotein, 450 kDa in size, found in both blood plasma
and extracellular matrix. It binds various molecules at specific binding sites located on
distinct fragments or modules of the protein. Among these is a large central cell-binding
domain (CCBD) that contains a motif recognized by many integrins: the amino acid sequence
Arg-Gly-Asp (RGD) in the FNIII10; the recognition depending on the conformations of both
integrin and FN [5]. The ability of fibronectin to change its native conformation when
absorbed on a substrate, influencing the cell adhesion and spreading [6,7] through changes
in the cytoskeletal organization, has been identified as an important consideration in the
design of biomaterial substrates for tissue engineering and biotechnology applications.
Many studies have been performed concerning the spatial bio-functionalisation of surfaces
by adhesion of ECM proteins such as fibronectin, laminin and collagen [8,9] using traditional
and soft lithography techniques (micro contact printing and self-assembled monolayers),
with the creation of defined protein micro patterns on surfaces. The deposition of
biomolecules directly on substrates for use in cell patterning can also be achieved using
electrospray techniques [10,11]. Such substrates have demonstrated biomolecular
deposition with a resolution close to critical cellular dimension. The ability of electrospray
techniques to functionalise surfaces with organic and biological molecules is potentially of
fundamental importance in molecular nanotechnology, opening up new opportunities
ranging from molecular electronics [12] to specific biological recognition and sensor
applications [13].
Electrospray ionisation, a technique most commonly used in mass spectrometry [14,15] to
solution of the molecule of interest through an emitter (often a metal capillary with OD < 1
mm) held at a high voltage (typically a few kilovolts). At the emitter tip, the large electric
field causes polarisation of the solvent and the formation of a Taylor cone. At the tip of the
Taylor cone there is an instability, and if the field is sufficiently large a jet of liquid is emitted
which breaks up into droplets due to the repulsion of ions at the liquid–air interface. These
droplets travel towards a grounded counter-electrode meanwhile solvent is evaporating
from the drops. As the drop size reduces, the repulsive effects of the ions become greater
and these overcome the effect of surface tension causing the drop to split (a process called
Coulomb fission). The processes of solvent evaporation and Coulomb explosion cause the
droplets to desolvate producing a plume of molecular ions. Aside from mass spectroscopy,
electrospray has been used for the atomization and the surface deposition of a wide range
of materials including DNA, [16] biocompatible polymers, [17,18] polysaccharides, and a
range of proteins [19,20] with retention of structure and function. Previously most work
concerning protein deposition on materials has been performed under ambient conditions.
However, Rauschenbach and co-workers [21] reported the deposition of the protein bovine
serum albumin on graphite surfaces analysed ex situ by atomic force microscopy, and more
recently the deposition of folded cytochrome C proteins imaged by scanning tunnelling
microscopy [22].
The potential advantages of depositing biological molecules such as proteins with the
retention of their activity onto surface held under high vacuum or ultra-high vacuum (UHV)
are potentially substantial. The UHV environment allows the preparation of clean surfaces
prior to deposition and the in-situ application of high resolution scanning probe microscopy,
electron spectroscopy and X-ray absorption techniques to understand interactions at the
atomic and molecular scale. The combination of such techniques with UHV-compatible
electrospray deposition has successfully been applied by the authors to the deposition of
complex, fragile and non-volatile molecules on surfaces prepared in UHV including giant
porphyrin nanorings, [23] single molecule magnets [24] and organometallic dye molecules
with retention of their chemical, electrical and magnetic properties the question remains if
proteins deposited in this manner in vacuum retain their biological activity when returned
to liquid environments of relevance to their application in a wide range of fields such as
[image:4.595.138.457.178.611.2]sensors, diagnostics and tissue engineering.
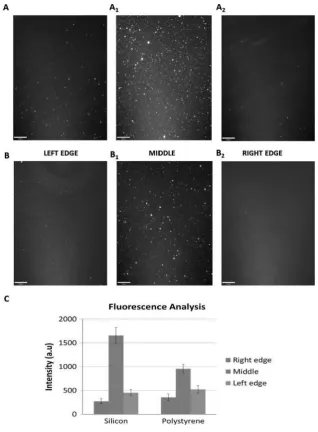
Fig. 1. Fluorescence images of the silica (A1, A2, A3) and non-TCP polystyrene (B1, B2, B3) substrates after Fibronectin deposition (Scale bar 90 Lm), and an analysis of the relative fluorescence intensity
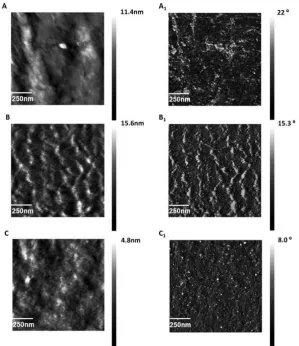
Fig. 2. Representative AFM images recorded on silicon substrate, showing bare substrate (A, A1),
higher protein deposition (B, B1) and lower deposition (C, C1) (400 x 400 DPI).
Table 1. AFM images analysis before and after fibronectin deposition on silicon and non-TCP
substrates (mean ± SD).
Silicon Bare substrate High FN (centre) Low FN (outsides)
Roughness 0.35 nm ± 0.1 nm 1.7 nm ± 0.2 nm 0.65 nm ± 0.12 nm
Particle size / 31.52 nm ± 3.2 nm 28.2 nm ± 2.7 nm
Surface coverage / 78% 32%
Non-TCP
[image:5.595.65.541.564.681.2]In this work in order to perform deposition experiments with large organic and biological
molecules on polymeric substrates using a high vacuum electrospray deposition system,
fibronectin was deposited and its distribution, structure and function (retention cell-binding
activity), when in a relevant liquid environment was investigated. AFM was used to monitor
changes in the morphology of the surface before and after fibronectin deposition, whilst the
biological activity of the deposited protein is assessed through a quantitative analysis of the
biomolecular adhesion and migration of fibroblast cells to the modified surfaces. For the
first time we have demonstrated that using high vacuum electrospray deposition it is
possible to deposit large protein molecules on polymeric surfaces whilst maintaining the
[image:6.595.149.449.311.658.2]protein activity when returned to a liquid environment.
Fig. 3. Representative AFM images recorded on not-TCP substrate, showing bare substrate (A),
higher protein deposition (B) and lower deposition (C). In figures A1, B1 and C1 phase images are
2. Experimental session 2.1. Materials and methods
2.1.1. Chemical compounds
Silicon wafers (p-type, 100 orientations), were obtained from Compart-TechMagnus,
Tamworth, U.K. Pluronic F127, rhodamine-labelled fibronectin (MW 450 kDa), phosphate
buffer pH 7.4, DMEM media, FCS, PBS, non-TCP (polystyrene plastic plates) were obtained
from Sigma Gillingham, Dorset, UK.
2.1.2. Instrumental and analytical tools
AFM DI3000, RTESPA probes Brucker Coventry (UK). Fluorescence microscopy (IRE2) Leica
(UK). Nikon Eclipse TS100 Microscope Diagnostic Instruments (UK). Volocity 5.2 software
Improvision (UK).
2.1.3. Electrospray methodology and protein deposition on substrates The substrates were
placed in the deposition chamber and pumped down over 12–18 h to a base pressure of 1 x
10~7 mbar. A Molecularspray (UK) UHV4 electrospray deposition system was used to
deposit the protein onto the substrates in high vacuum conditions: The solution of protein
was diluted in using HPLC grade methanol (Sigma Aldrich) in 1:1 ratio (by volume) and was
fed into the electrospray emitter (stainless steel, ID = 100 micron, OD = 320 micron, by New
Objective) at a rate of 0.3 mL per hr using a syringe pump (World Precision Instruments). A
small quantity of the droplets ( 1%) produced by the emitter in atmospheric conditions pass
through an inlet capillary into a series of differentially pumped vacuum chambers reducing
the pressure in the deposition chamber to <1 x 10⁶ mbar during deposition. The depositions
lasted approximately an hour and were monitored via the fluctuations in the pressure in the
deposition chamber using an ion gauge. Reductions in the size of fluctuations was linked to
the gradual clogging of the entrance capillary which was flushed through with solvent every
20 mins.
2.1.4. Substrate functionalization
To obtain a uniform distribution of fibroblasts on the areas of the substrate exposed to the
plastic plate), the substrate was coated with Pluronic F127 a surfactant tri-block copolymer
to block cell adhesion but not protein deposition. Non-TCP was treated with 3% (w/v) of
Pluronic F127. The procedure used, in brief, was that the non-TCP was first functionalised
using Pluronic F127 with a concentration of 3% (w/v) and left for 24 h to be absorbed. A
solution of fibronectin dissolved in methanol to a final concentration of 10 lg/mL was
[image:8.595.114.482.223.590.2]sprayed on the functionalised substrate in vacuum for 60 min.
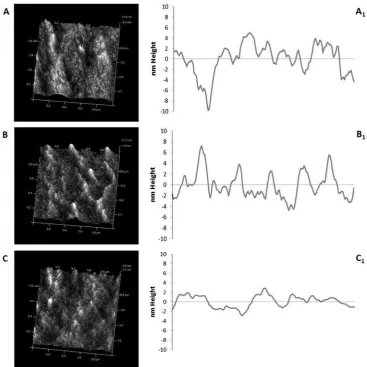
Fig. 4. AFM profile analysis before and after protein immobilization on not-TCP substrate. In figures
A, B, C, 3D images (1 lm scan size) recorded on bare substrate, higher protein density and lower
protein density respectively. In figures A1, B1 and C1 the corresponding profile analysis are reported
2.1.5. Cell culture
NIH-3T3 mouse fibroblasts were grown in Dulbecco’s modified Eagle’s medium (DMEM)
with 10% FCS and standard additives. Cells were genetically labelled as previously described
[26] using transduction of lenti viruses expressing enhanced monomeric red fluorescent
protein (mRFP). Cells were selected with Puromycin (NIH-3T3: 3 mg/mL) for three passages.
Flow cytometric analysis confirmed that cells were >95% labelled. For patterning, cell
sus-pensions of 106 cells (in 4 mL per well) were seeded onto non-TCP (previously functionalised
with pluronic F127), already functionalised with rhodamine-labelled fibronectin in defined
media conditions (lacking FCS). Cells were allowed to attach for a defined period (NIH-3T3, 2
h). Non-adhered cells were removed by gently washing twice with phosphate buffered
saline (PBS) and replacing this with fresh growth media.
2.1.6. Imaging
Fluorescence microscopy and atomic force microscopy (AFM) were used to monitor
property changes before and after protein immobilization. Fluorescence analysis was
conducted using a Leica IRE2 microscope with appropriate filtering conditions for
rhodamine-labelled fibronectin (535 nm excitation and 585 nm emission). AFM images were
acquired in air in tapping mode using a Bruker D3000 micropscope with RTESPA probes
(spring constant 20–80 N/m, resonant frequency 300–400 kHz) using different scan sizes
and rates. The Nanoscope Analysis program (Bruker, Version 1.20) was used for quantitative
analysis of the AFM images. Bright field and fluorescent images of 3T3 fibroblasts cells were
taken using a Nikon Eclipse TS100 Microscope and analysed using Volocity 5.2 software
(PerkinElmer).
2.1.7. Cell migration
NIH-3T3 mouse fibroblasts were seeded with a cell density of 106 cells (in 4 mL per well)
onto non-TCP (previously functionalised with pluronic F127 and already patterned with
fibronectin as described above) and left two hours for adhesion to the substrate. A media
and the other proteins present in the media. After two hours cells were washed abundantly
with PBS and then the media replaced. Time-lapsed fluorescent micrographs images were
taken at 24 h, which were subsequently analysed with the Chemotaxis tool (ibidi) for Image J
(National Institute of Heath).
2.1.8. AFM imaging analysis
Quantitative imaging analysis of the substrates before and after protein immobilization was
performed using the Nanoscope Analysis program (Version 1.20). Different scan size images
were collected on the substrate before and after protein deposition from 5 tm to 0.5 tm
scan size, an example of which is reported in Fig. 2. Quantitative analysis of the surface
coverage after protein deposition was performed considering the differences observed
between the bare and the functionalised substrate conducting a specific particle analysis
with the Nanoscope Analysis programme. For each sample, 10 independent analyses where
conducted in different areas ranging from the centre to the edges of the substrate. The
analysis of the particle diameters and the surface coverage were represented considering
three areas and the average value of the analysis reported in Table 1. Analysis of the height
profile of the surface before and after protein immobilization was performed considering
three sections of each area (total of 15 areas analysed) and an average value of the
roughness reported Table 1. Due to the difficulties in studying the rough polystyrene
substrate, five different areas for every point (15 areas analysed in total) were analysed and
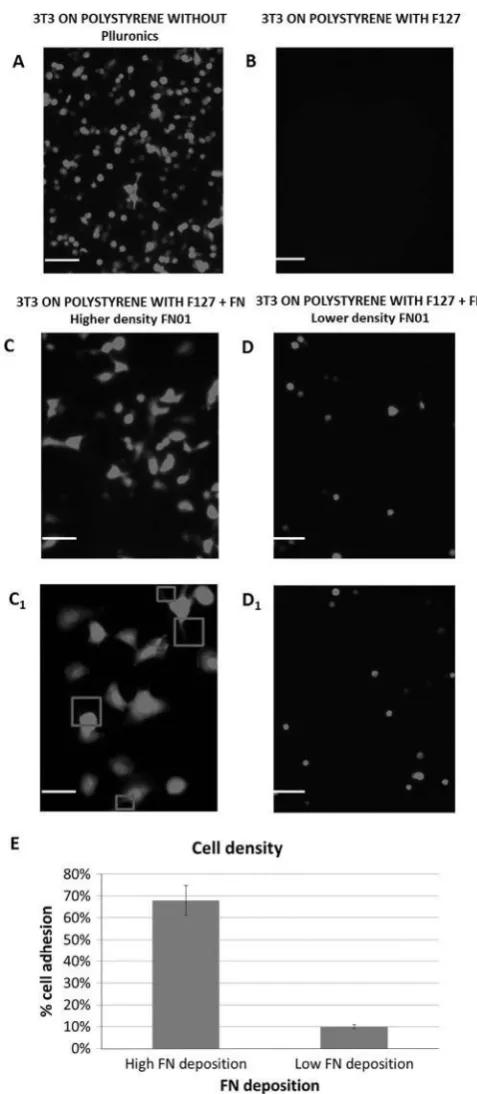
Fig. 5. Fluorescence microscopy images of fibroblasts adhesion acquired before and after FN and
Pluronics F127 immobilization on not-TCP substrate (scale bar 100 tm). In figures C1 and D1 zoom
(scale bar 50 tm) of the fibroblasts adhesion at higher and lower protein deposition from flattened
and spindled profile to rounded in shape respectively. In figure E analysis of cell adhesion is reported
2.1.9. Fluorescence images analysis
Fluorescence microscopy was performed using a Leica DM IRE2 Differential Interference
Contrast (DIC) microscope with full stage incubation (37 °C, 5% CO2) and a Hammamatsu
OrcaER monochrome camera. Fluorescence analysis was conducted using a specific filter
FITC, in our case considering the excitation and emission value (535 nm excitation and 585
nm emission for Rhodamine labelled fibronectin). Time-lapse fluorescence images were
acquired every 10 min for 24 h.
2.1.10. Cell adhesion and migration analysis
Analysis of the 3T3 fibroblast cells adhesion was conducted on fluorescent images before
and after cell deposition on fibronectin. The Image J programme was used to evaluate the
cell density on the substrate before and after the functionalisation. Three areas were
analysed along the pattern and the average value reported in Fig. 5E. 3T3 fibroblast cells
migration was evaluated analysing the videos collected using a time-lapse microscope every
10 min for 24 h on a Nikon live imaging station equipped with a 10x phase-contrast
objective, automated X–Y–Z-stage, a climate chamber and camera. Cell migration speed and
directionality were analysed with the Chemotaxis and Migration tool plug-in (ibidi) for
ImageJ. At least five independent analyses were considered for every point and an example
of the analysis reported in Fig. 6. The two parameters that were considered to detect the
cell migration were the centre of mass (Mend), and the X, Y forward migration index as
reported in the literature [27–29].
3. Results and discussion
3.1. Protein deposition characterisation
As described, deposition of fluorescent protein was achieved using an electrospray
technique in vacuum on silica wafer surfaces and polystyrene substrates. In Fig. 1 results of
fluorescence microscopy analysis of the deposited protein is reported (using 10 tg/mL stock
middle of the deposit, which decreased in the proximity of the edges. For both substrates
there is a clear decrease in the intensity from the middle point to the edges of the samples.
Characterisation of the surface before and after protein immobilization was conducted using
AFM imaging in tapping mode in air. Fig. 2 shows a selection of images obtained before and
after protein (Rhodamine labelled fibronectin) immobilization on the silicon wafer substrate.
Comparing the images before and after protein immobilization it was observed that the
surface of the silicon wafer was flat, with a Ra roughness value of 0.4 nm ± 0.1 nm (1 tm by
1 tm scan in air). After protein immobilization a uniform surface with a Ra value of 1.7 nm ±
0.2 nm was observed for same sized images. This was also confirmed by the quantitative
analysis of surface coverage (Table 1). This demonstrated that the nanome-tre sized
droplets produced by the electrospray process created a thin protein film deposited on the
[image:13.595.83.514.347.622.2]silicon surface (around 30 nm features size).
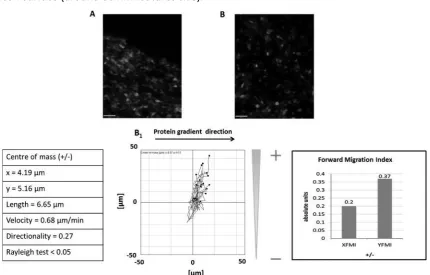
Fig. 6. 3T3 cell migration analysis. In A and B an example of the fluorescence images acquired at time
0 and after 24 h respectively using time lapse microscopy. The analysis of the cell migration was
conducted using Image J Chemotaxis tool IBIDI (Germany), evaluating the forward migration index as
The investigation of protein activity under relevant liquid conditions after electrospray
deposition on silicon using a cell-adhesion based studies, is difficult because whilst this
surface is normally used in surface analysis studies due to its flatness and chemical
homogeneity, relative inertness and potential compatibility with sensors, it is not frequently
used in cell based studies. For this reason another substrate namely the transparent
polystyrene based material (not-Tissue Culture Plate substrate, not-TCP) was used in this
investigation. In Fig. 1 fluorescence microscopy images on the non-TCP substrate, showing
different intensity of protein deposited as for the silicon is reported. Due to the relatively
rough nature of the not-TCP substrate, AFM image analysis is not so easily able to
distinguish protein features. Fig. 3 shows AFM images of the non-TCP substrate both before
and after the FN deposition. Analysis of the images showed a difference in roughness but
clear detail of the protein distribution could not be resolved as was achieved for the silicon
substrate. An increase in roughness was observed from Ra = 2.9 ± 0.5 nm (before
deposi-tion) to Ra = 3.5 ± 0.3 nm (after fibronectin deposideposi-tion). A comparable roughness parameter
approach was previously used in similar work to confirm protein deposition on a similar
substrate demonstrating how variations in substrate materials can influence fibronectin
deposition and activity [30,31]. In Fig. 4 an analysis of the substrate profile before and after
fibronectin deposition is reported showing clear differences before and after the deposition
(10 analysed areas). The analysis of the profiles clearly showed that there is a change in the
surface profile considering the bare substrate and after fibronectin immobilization. It is of
interest to note that the measured roughness value for the lower protein surface coverage
corresponding to Ra = 1.8 ± 0.2 nm is lower than for the bare surface. This could indicate a
partial filling of “valleys” with FN molecules as was observed for the adsorption of FN
molecules into valleys on titanium oxide surface [32] or the “cavities” on a poly(ethylene
glycol) substrate [33]. The increased deposition of fibronectin on the substrate in the middle
of the deposit (as previously confirmed from the fluorescence data analysis) led to the
increased roughness observed in this area which may be related to disorder in the
3.2. Assessment of fibronectin bio-functionality
The aim of this study was to validate the use of high vacuum electrospray as a method for
depositing functional fibronectin onto a material surface and to demonstrate retention of
bioactivity of the deposited protein on return to a relevant liquid environment. This was
evidenced by studying the deposited proteins capacity to promote cell adhesion. To assess
the protein availability a cell adhesion a migration bioassay was performed.
Non-TCP substrates were used for protein immobilization and 3T3 fibroblast cells as a
suitable cell type. Initially 3T3 fibroblast cells were seeded on the fibronectin deposits using
a concentration of 106 cells in 4 mL of final volume. To reduce cell adhesion to the bare
plastic substrate the surfactant Pluronic F127 was used to coat the non-TCP substrate.
Following exposure of fibroblasts on the deposited fibronectin, cell adhesion was observed
(Fig. 5). The cell adhesion was consistent with the area and density of protein deposition
observed, with higher cell adhesion observed in the centre compared to the outer perimeter
of the deposits, confirming the sensitivity of the cells to detect differences in protein
deposition concentration. As shown in Fig. 5E a difference in surface coverage was observed
comparing the higher and lower protein deposition from 68% to 10% of coverage. The
morphology of the cells was also investigated (Fig. 5C1, D1). Morphological changes in
attached cells were observed from the higher regions of FN deposition: more flattened and
spindled profile, distributed more regularly and evenly across the not-TCP surface, to the
lower FN deposition areas; more rounded in shape and distributed in a clustered and patchy
fashion.
To assess the specificity of the response to the deposition of fibronectin, further adhesion
studies were conducted using fibronectin and Pluronics F127 functionalized surfaces.
Fluorescent microscopy analysis revealed a complete covering of cells on the fibronectin
coated surface, with no cell adhesion on Pluronic F127. The concentration of surfactant
used in the cell investigation (3% w/v) was optimal to avoid cell adhesion but weak enough
to permit protein deposition. Cell migration in the direction of the higher protein deposition
chemo-attractant signals on the substrate. This behaviour is related to the ability of
fibronectin to change its native conformation when absorbed on the substrate, influencing
the cell adhesion and spreading [35]. The role of the RGD sequence within fibronectin in
fibroblast adhesion and migration is well known [36], and it is reasonable to propose that
the presence of a higher fibronectin deposition can increase the chance to find more RGD
complexes on the surface favouring cell adhesion at that location. It should be noted,
how-ever, that cellular attachment to fibronectin can occur through a variety of mechanisms,
involving integrins, syndecans, and other receptor systems. Further studies are required to
elucidate the mechanism of attachment.
4. Conclusions
The aim of this study was to validate the use of electrospray in vacuum as a method for
depositing fibronectin onto a material surface and to demonstrate that on return to a liquid
environment protein functionality was retained. The deposition of fibronectin was
characterised using atomic force microscopy and fluorescence microscopy. This data
demonstrated changes in protein deposition and surface coverage on the silicon wafer and
not-TCP substrates. Images of the fibronectin deposition on the silica wafer demonstrated
nanoscale features consistent with the protein with an increased concentration of
fibronectin in the centre of the deposition spot compared to the edges. AFM analysis of the
non-TCP (polystyrene) substrate revealed a changed profile before and after protein
deposition confirming the immobilization of protein on the substrate as reported. To assess
the bioavailability of the protein on the substrate, a biological assay was performed
assessing the cell adhesion and cell shape before and after FN deposition. The data collected
confirmed the ability of the fibroblasts to recognise FN on the substrate in the right
conformation to permit cell adhesion. A migration in the direction of the higher deposition
was also observed after 48 h confirming the presence of a chemo-attractant signal.
Previous studies [30,32,33] have demonstrated that proteins may be deposited with
assessment of protein function has been extended by studying the cellular response to
electrospray deposits. We have shown that high vacuum electrospray deposition can be
used to produce surface that retain their biologically activity in liquid for fibronectin
deposits on substrates. The ability to deposit proteins in vacuum environment opens new
frontiers in the potential in situ use of a range of analytical techniques that can probe the
interaction geometry, electronic structure and self-assembly at the atomic scale such
photoelectron spectroscopy and low temperature scanning tunnelling microscopy. Such
studies would improve our understanding of the protein at a solid interface. In addition this
work it paves the way for biological molecules to be incorporated into the fabrication of
semiconductor devices such as biosensors without breaking vacuum, and that these
molecules will retain their biological functionality. Moreover, this approach could offer
precise control over the surface coverage of functional biomolecules from sub-monolayer to
multilayer films for the formation of concentration gradients and related applications.
References
[1] H. Park, C. Cannizzaro, G. Vunjak, R. Langer, C.A. Vacanti, O.C. Farokhzad, Tissue Eng. 2007
(1867) 13, http://dx.doi.org/10.1089/ten.2006.0198.
[2] S.J. Hollister, Nat. Mater. 4 (2005) 518, http://dx.doi.org/10.1038/nmat1421.
[3] R. Ruoslahti, M.D. Pierschbacher, Science 238 (1987) 491,
http://dx.doi.org/10.1126/science.2821619.
[4] G.M. Edelman, Science 219,(1983) 450, http://dx.doi.org/10.1126/science.6823544.
[5] T.A. Haas, E.F. Plow, Curr. Opin. Cell Biol. 6 (1994) 662, http://dx.doi.org/
10.1016/0955-674(94)90091-4.
[6] H.A. Stone, S. Kim, Al. Ch. E. J. 47 (2001) 1250, http://dx.doi.org/10.1002/ aic.690470602.
[7] T.M. Squires, S.R. Quake, Rev. Mod. Phys. 77 (2005) 977,
http://dx.doi.org/10.1103/RevModPhys.77.977.
[8] M. Mrksich, L.E. Dike, J. Tien, D.E. Ingber, G.M. Whitesides, Exp. Cell Res. 235 (1997) 305,
http://dx.doi.org/10.1006/excr.1997.3668.
[9] P.G. Campbell, E.D. Miller, G.W. Fisher, L.M. Walker, L.E. Weiss, Biomaterials 26 (2005) 6762,
[10] J.U. Park, M. Hardy, S.J. Kang, K. Barton, K. Adair, D.K. Mukhopadhyay, C.J. Lee, M.S. Strano, A.G.
Alleyne, J.G. Georgiadis, P.M. Ferreira, Nat. Mater. 6 (2007) 782,
http://dx.doi.org/10.1038/nmat1974.
[11] M.D. Paine, M.S. Alexander, K.L. Smith, J.P. Stark, J. Aerosol Sci. 38 (2007) 315,
http://dx.doi.org/10.1016/j.jaerosci.2006.12.004.
[12] M.A. Reed, C. Zhou, C.J. Muller, T.P. Burgin, J.M. Tour, Science 278 (1997) 252,
http://dx.doi.org/10.1126/science.278.5336.
[13] Y. Cui, Q. Wei, H. Park, C.M. Lieber, Science 293 (2001) 1289,
http://dx.doi.org/10.1126/science.10672711.
[14] J.B. Fenn, M. Mann, C.K. Meng, F.S. Wong, C.M. Whitehouse, Science 64 (1989) 4926,
http://dx.doi.org/10.1126/science.2675315.
[15] R.B. Cole, J. Mass Spectrom. 35 (2000) 763, http://dx.doi.org/10.1002/1096-9888(200007).
[16] V.N. Morozova, T.Y. Morozova, Anal. Chem. 71 (1999) 3110,
http://dx.doi.org/10.1021/ac9808775.
[17] V.N. Morozova, T.Y. Morozova, N.R. Kallenbach, Int. J. Mass Spectrom. 178 (1998) 143,
http://dx.doi.org/10.1016/S1387-3806(98)14083-6.
[18] L.Y. Yeo, Z. Gagnon, H. Chang, Biomaterials 26 (2005) 6122,
http://dx.doi.org/10.1016/j.biomaterials.2005.03.033
[19] S.N. Jayasinghe, M.J. Edirisinghe, J. Mater. Sci. Lett. 22 (2003) 1443, http://
dx.doi.org/10.1007/s10019-003-0228-4.
[20] B. Lee, J.W. Kim, K. Ishimoto, Y. Yamagata, A. Tanioka, T. Nagamune, J. Chem. Eng. Jpn. 36 (2003)
1370, http://dx.doi.org/10.1252/jcej.36.1370.
[21] S. Rauschenbach, L.F. Stadler, E. Lunedei, N. Malinowski, S. Koltsov, G. Costantini, K. Kern, Small
4 (2006) 540, http://dx.doi.org/10.1002/ smll.200500479.
[22] Z. Deng, N. Thontasen, N. Malinowski, G. Rinke, L. Harnau, S. Rauschenbach, K. Kern, Nano Lett.
12 (5) (2012) 2452–2458, http://dx.doi.org/10.1021/ nl3005385.
[23] M.C. O’Sullivan, J.K. Sprafke, D.V. Kondratuk, C. Rinfray, T.D.W. Claridge, A. Saywell, M.O. Blunt,
J.N. O’Shea, P.H. Beton, M. Malfois, H.L. Anderson, Nature 72 (2011) 469,
http://dx.doi.org/10.1038/nature09683.
[24] K. Handrup, V.J. Richards, M. Weston, N.R. Champness, J.N. O’Shea, J. Chem. Phys. 139 (2013)
[25] A. Gibson, R.G. Temperton, K. Handrup, M. Weston, L.C. Mayor, J.N. O’Shea, J. Chem. Phys. 140
(2014) 234708, http://dx.doi.org/10.1063/1.4882867.
[26] J.E. Dixon, E. Dick, D. Rajamohan, K.M. Shakesheff, C. Denning, Mol. Ther. 19 (2011) 1695,
http://dx.doi.org/10.1038/mt.2011.125.
[27] P. Suraneni, B. Rubinstein, J.R. Unruh, M. Durnin, D. Hanein, R. Li, J. Cell Biol. 2 (2012) 251,
http://dx.doi.org/10.1083/jcb.201112113.
[28] C.O. Morgner, P. Reichardt, M. Chopin, S. Braungart, C. Wahren, M. Gunzer, R. Jessberger, J.
Immunol. 186 (2011) 5355, http://dx.doi.org/10.4049/ jimmunol.1003461.
[29] P.J. Hanley, Y. Xu, M. Kronlage, K. Grobe, P. Schön, J. Song, L. Sorokin, A. Schwab, M. Bähler,
PNAS 107 (2010) 12150, http://dx.doi.org/10.1073/ pnas.0911986107.
[30] H.M. Kowalczynska, R. Kolos, M.N. Wyrzykowska, J. Dobovsky, D. Elbaum, A. Szczepankiewicz, J.
Kaminski, J. Biomed. Mater. Res. 01 (2009) 1239, http:// dx.doi.org/10.1002/jbm.a.32473.
[31] N.B. Guerra, C.G. Garcıa, V. Llopis, J.C.R. Hernandez, D. Mortal, S. Rico, S.M. Sanchez, Soft Matter
6 (2010) 4847, http://dx.doi.org/10.1039/C0SM00345J.
[32] S.R. Sousa, M.M. Bras, P. Moradas-Ferreira, M.A. Barbosa, Langmuir 23 (2007) 7046,
http://dx.doi.org/10.1021/la062956e.
[33] E. Tziampazis, J. Kohn, P. Moghe, Biomaterials 21 (2000) 511, http://dx.doi.org/
10.1016/S0142-9612(99)00212-4.
[34] M. Bergkvist, J. Carlsson, S. Oscarsson, J. Biomed. Mater. Res. A 64 (2003) 349,
http://dx.doi.org/10.1002/jbm.a.10423.
[35] T.P. Ugarova, C. Zamarron, Y. Veklich, R.D. Bowditch, M.H. Ginsberg, J.W. Weisel, E.F. Plow,
Biochemistry 34 (1995) 4457, http://dx.doi.org/10.1021/ bi00013a039.
[36] R.A.F. Clark, A.J. Qiang, D. Greiling, A. Khan, J.E. Schwarzbauer, J. Invest. Dermatol. 121 (2003) 4,